Sample Category Title
Technical Outlook: USDJPY – Extended Consolidation Should Remain Capped By Falling 10SMA
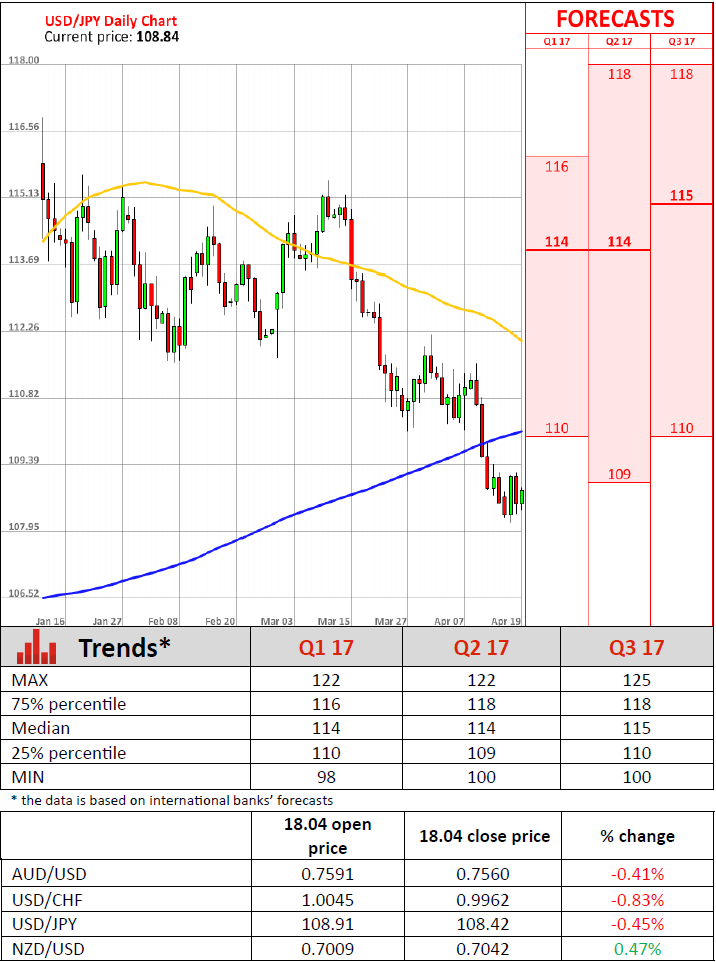
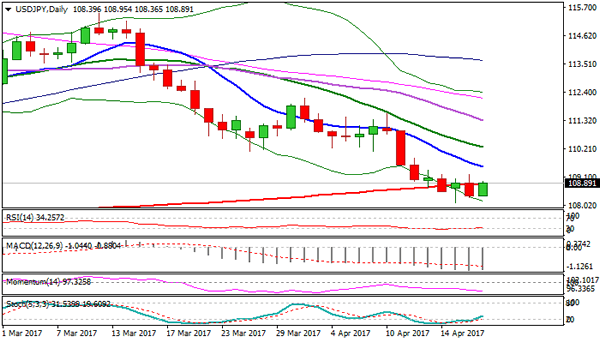
The pair is probing above 200SMA (108.84) again, on fresh rally from 108.30 zone, where Tuesday's / today's downside attempts found footstep, keeping intact fresh five-month low at 108.11 for now.
Fresh recovery action was signaled by reversal of slow stochastic from oversold zone on daily chart and may keep the pair in prolonged consolidation before larger bears resume.
Strong negative sentiment on risk-aversion mode keeps the pair under pressure for extension towards next target at 107.84 (Fibo 61.8% of larger 101.17/118.65 rally. Current structure sees limited upside attempts, which should be ideally capped by falling 10SMA (currently at 109.51) and psychological 110.00 barrier.
Firm break above the latter barriers would signal stronger correction and put immediate bears on hold.
Res: 109.00, 109.20, 109.51, 110.00
Sup: 108.60, 108.30, 108.11, 107.84
GBP/USD Candlesticks and Ichimoku Analysis
Weekly
• Last Candlesticks pattern: Long white candlestick
• Time of formation: 16 Jan 2017
• Trend bias: Down
Daily
• Last Candlesticks pattern: Long white candlestick
• Time of formation: 18 Apr 2017
• Trend bias: Near term up
GBP/USD – 1.2820
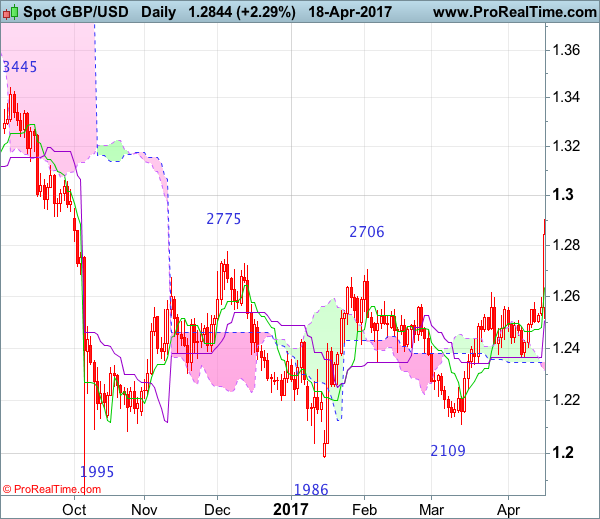
Yesterday’s rally above indicated resistance at 1.2706 and 1.2775 adds credence to our view that another leg of the corrective rise from 1.1986 low (Jan low) is underway and upside bias remains for further gain to 1.2940-50, then towards 1.3000 psychological resistance, however, reckon upside would be limited to 1.3090-00 and 1.3140-50 (38.2% Fibonacci retracement of 1.5018-1.1986) would hold on first testing, risk from there is seen for a retreat to take place later.
On the downside, whilst initial pullback to 1.2705-10 cannot be ruled out, reckon downside would be limited to 1.2650-60 and bring another rise later. Below 1.2600-10 would defer and risk test of previous resistance at 1.2575, however, a daily close below this level is needed to suggest top is possibly formed, bring test of support at 1.2515. Only a drop below this level would add credence to this view, then subsequent fall towards the Kijun-Sen (now at 1.2441) but support at 1.2365 should remain intact, bring another rise later.
Recommendation: Buy at 1.2710 for 1.2910 with stop below 1.2610.
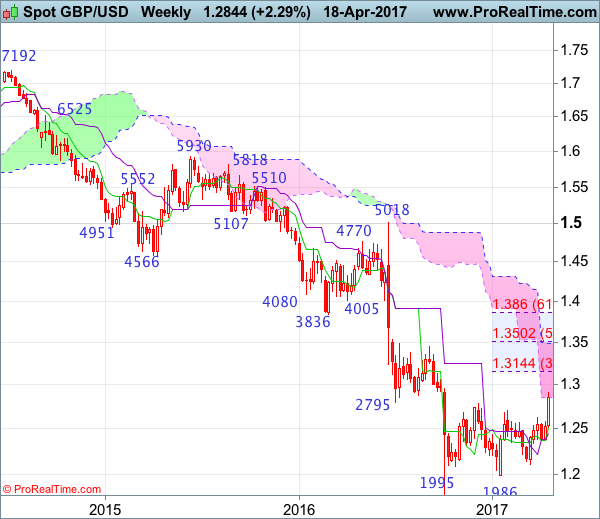
On the weekly chart, after finding renewed buying interest at 1.2365 last week, cable has rallied again this week and broke above resistance at 1.2706 as well as 1.2775, adding credence to our bullish view that the erratic rise from this year’s low at 1.1986 has resumed and near term upside bias remains for this rise to bring retracement of early decline and gain to 1.2900-10 and then 1.2940-50 would be seen, however, reckon psychological resistance at 1.3000 would limit upside and price should falter well below 1.3140-50 (38.2% Fibonacci retracement of 1.5018-1.1986), bring retreat later.
On the downside, although initial pullback to 1.2775 cannot be ruled out, reckon downside would be limited to another previous resistance at 1.2706 and bring another rise later. Below 1.2640-50 would risk test of previous resistance at 1.2616, break there would defer and suggest top is possibly formed, bring weakness to 1.2550-60 but last week’s low at 1.2515 should hold, bring another rise later. Only a drop below 1.2500 would abort and signal top is formed instead, then test of the Kijun-Sen (now at 1.2446) would follow but support at 1.2365 should remain intact.
Forex Technical Analysis: EUR/USD, USD/JPY, GBP/USD
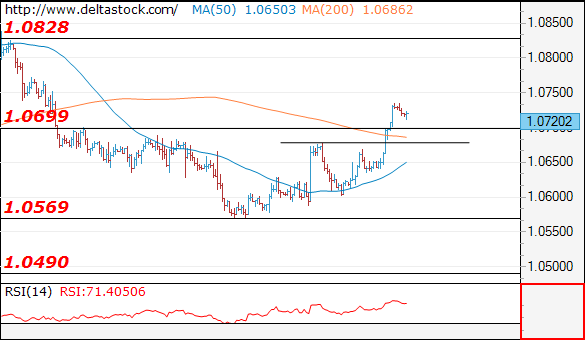
EUR/USD
Current level - 10720
The bias is positive after yesterday's break through 1.0675 resistance and initial intraday support lies at 1.0700. Minor resistance is projected at 1.0775, followed by 1.0828.
| Resistance | Support | ||
| intraday | intraweek | intraday | intraweek |
| 1.0775 | 1.0828 | 1.0700 | 1.0600 |
| 1.0828 | 1.0904 | 1.0600 | 1.0490 |
USD/JPY
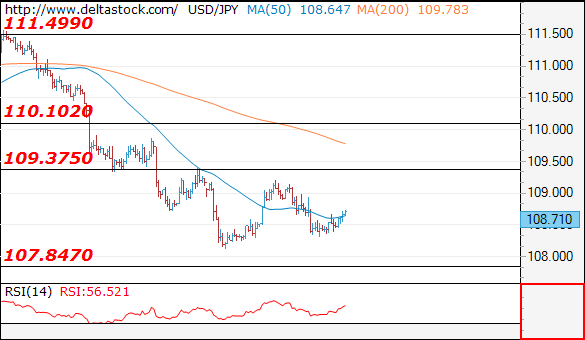
Current level - 108.71
The corrective pattern above 108.10 should extend further towards 109.40 and even 110.10 major hurdle.
| Resistance | Support | ||
| intraday | intraweek | intraday | intraweek |
| 109.40 | 113.50 | 107.80 | 107.80 |
| 110.10 | 115.65 | 107.80 | 105.80 |
GBP/USD
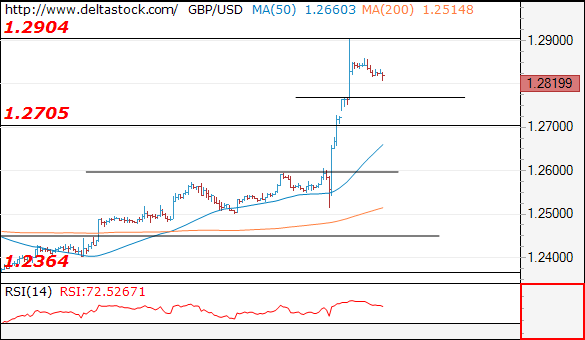
Current level - 1.2819
The break through 1.2600 resistance unleashed a fast uptrend, all the way up to 1.2904 high. The intraday bias is bearish, for a corrective pullback towards 1.2770, en route to 1.2705 zone.
| Resistance | Support | ||
| intraday | intraweek | intraday | intraweek |
| 1.2904 | 1.3000 | 1.2770 | 1.2610 |
| 1.3000 | 1.3500 | 1.2705 | 1.2510 |
UK Prime Minister Calls For A Snap Election
Yesterday, in a surprise for the markets move, British PM Theresa May announced that she will seek an early election on June 8th in order to strengthen her hand going into the UK-EU divorce negotiations. "Every vote for the Conservatives will make it harder for opposition politicians who want to stop me from getting the job done" she said in her speech. However, in order to be able to hold an election, the Prime Minister must gather the support of two-thirds majority in the lower chamber of Parliament, the House of Commons. The vote is scheduled for today, and with the Labour party favouring a new election, May is very likely to get it through.
The pound tumbled a few minutes before May's speech, on rumours that she will call for snap election. Nevertheless, it rebounded at the confirmation, erasing all the rumour-related losses and gaining even more. This is a “sell the rumour, buy the fact” market reaction and reminded us the 17th of January, when Theresa May announced her negotiating plans. A couple of days ahead of the scheduled speech, sterling fell on leaks of her plans. When May actually delivered, the currency surged.
In our view, yesterday's rally may have been fueled further by speculation that a new government may negotiate a softer Brexit process or even cancel it altogether. However, based on the most recent opinion poll, the Conservatives are in the driver's seat, which increases the likelihood for May to enter the negotiating process with a stronger mandate.
GBP/USD surged on May's call, and continued to trade north throughout the whole day. The rally was stopped by the 1.2900 (R2) level and then, the rate immediately retreated to settle slightly below the 1.2850 (R1) key territory, which happens to be the upper bound of the medium-term sideways range that has been containing the price action since the 7th of October, between that area and the 1.2100 support zone. We prefer to wait for a clear close above the 1.2850 (R1) area before we get confident on larger upside extensions.
Today:
Besides the UK parliament vote, today we have Eurozone's final CPI for March and three speakers. Expectations for Eurozone's CPI are for the final print to confirm the preliminary estimate, so we expect the market reaction in the euro to be muted.
As for the speakers, from the Fed, we have Boston President Eric Rosengren. From the ECB, Board members Peter Praet and Benoit Coeure will speak. Following the Reuters report that the market has over-interpreted the signals from the March ECB meeting, it will be interesting to hear from them, especially ahead of next week's policy gathering.
EUR/USD traded higher yesterday, breaking above the resistance (now turned into support) of 1.0700 (S1) to stop slightly below 1.0740 (R1). Any comments from the aforementioned officials that the ECB is not planning to start reducing its stimulus program any time soon may bring the pair back below 1.0700 (S1). As for the bigger picture, we believe that the outlook remains neutral. The pair remains below the downtrend line taken from the peak of the 3rd of May, but also above the upside support line drawn from the low of the 3rd of January.
GBP/USD
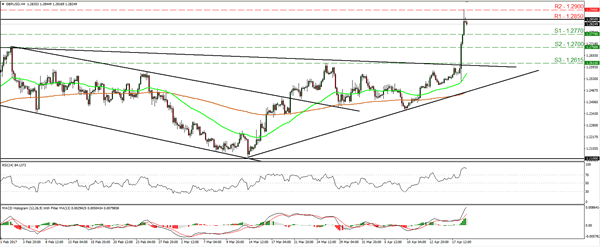
Support: 1.2770 (S1), 1.2700 (S2), 1.2615 (S3)
Resistance: 1.2850 (R1), 1.2900 (R2), 1.2940 (R3)
EUR/USD
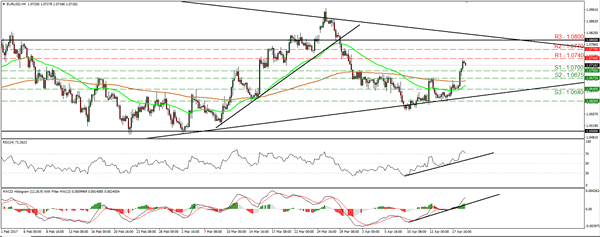
Support: 1.0700 (S1), 1.0675 (S2), 1.0640 (S3)
Resistance: 1.0740 (R1), 1.0770 (R2), 1.0800 (R3)
USD/CHF Candlesticks and Ichimoku Analysis
Weekly
• Last Candlesticks pattern: Doji
• Time of formation: 26 Sep 2016
• Trend bias: Sideways
Daily
• Last Candlesticks pattern: Shooting star
• Time of formation: 25 Oct 2016
• Trend bias: Near term up
USD/CHF – 0.9978
As dollar’s retreat from 1.0108 (last week’s high) has kept price under pressure, suggesting initial downside risk remains for weakness to 0.9960 (50% Fibonacci retracement of 0.9813-1.0108), however, if our view that a temporary low formed at 0.9813 is correct, downside should be limited to support at 0.9948 and bring rebound later, above 1.0067 would signal the retreat from 1.0108 has ended, bring retest of this level, break there would retain bullishness and extend the rebound from 0.9813 towards key resistance at 1.0171. Looking ahead, only a sustained breach above this level would add credence to our view that the erratic decline from 1.0344 top has ended at 0.9813, bring further rise to 1.0200-10, then 1.0250 but price should falter well below said resistance at 1.0344 (2016 high).
On the downside, whilst initial marginal weakness to 0.9960 cannot be ruled out, reckon minor support at 0.9948 would limit downside and bring another rebound. Below 0.9890-00 would abort and signal the rebound from 0.9813 has ended, bring another fall to this level. Looking ahead, only a drop below said support at 0.9813 would revive bearishness and signal the decline from 1.0344 top has resumed instead and extend further fall to 0.9735-40 (76.4% retracement of 0.9550-1.0344) and later towards 0.9700 but reckon 0.9650-60 would hold.
Recommendation: Hold long entered at 0.9990 for 1.0190 with stop below 0.9890.
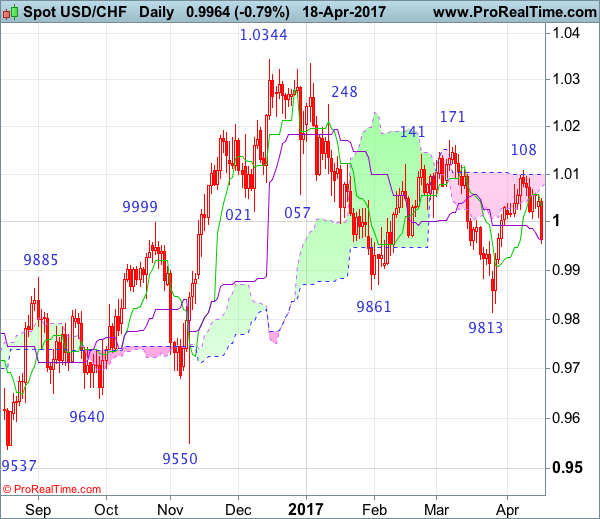
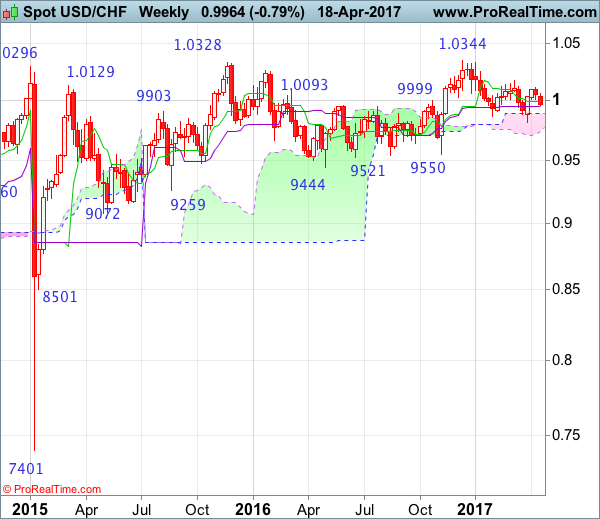
On the weekly chart, although dollar’s retreat from 1.0108 (last week’s high) has continued pressuring the pair and weakness towards the Kijun-Sen (now at 0.9947) cannot be ruled out, reckon 0.9900 would contain downside and bring another rebound later, above 1.0067 would suggest the pullback from 1.0108 has ended, bring test of this level. A break above 1.0108 would extend the rebound from 0.9813 to resistance at 1.0171, however, a weekly close above this level is needed to confirm the fall from 1.0344 top has ended at 0.9813, bring further subsequent rise towards key resistance at 1.0248. A sustained breach above this level would signal early upmove has possibly resumed, bring test of 1.0335-44 resistance area, above there would provide confirmation and headway to 1.0400-10 and later 1.0500 would follow.
On the downside, expect pullback to be limited to the Kijun-Sen (now at 0.9947) and bring another rise later. A drop below 0.9890-00 would defer but only below said support at 0.9813 would abort and signal the erratic fall from 1.0344 top is still in progress, bring further decline for retracement of early upmove to 0.9735-40, then towards the lower Kumo (now at 0.9712) but reckon downside would be limited to 0.9640-50 and price should stay well above support at 0.9550.
Trade Idea : USD/CHF – Hold short entered at 1.0000
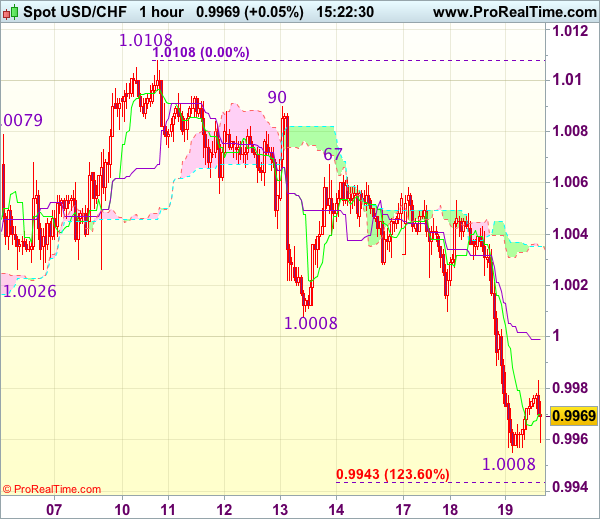
USD/CHF - 0.9975
Most recent candlesticks pattern : N/A
Trend : Near term down
Tenkan-Sen level : 0.9971
Kijun-Sen level : 0.9998
Ichimoku cloud top : 1.0035
Ichimoku cloud bottom : 1.0035
Original strategy :
Sold at 1.0000, Target: 0.9900, Stop: 1.0035
Position : - Short at 1.0000
Target : - 0.9900
Stop : - 1.0035
New strategy :
Hold short entered at 1.0000, Target: 0.9900, Stop: 1.0030
Position : - Short at 1.0000
Target : - 0.9900
Stop : - 1.0030
As the greenback has recovered after falling to 0.9955 yesterday, suggesting minor consolidation would be seen, however, reckon upside would be limited to the Kijun-Sen (now at 0.9998) and bring another decline later, below said support at 0.9955 would extend recent fall from 1.01089 top to 0.9943-48 (1.236 times projection and previous support) and then 0.9926 (61.8% Fibonacci retracement of 0.9813-1.0108) but reckon 0.9900-05 (1.618 times projection) would hold on first testing, bring rebound later.
In view of this, we are holding on to our short position entered at 1.0000. Above previous support at 1.0008 would defer and risk rebound to 1.0020-30 but still reckon indicated resistance at 1.0067 would remain intact.
Snap General Election Breathes Life Into The Pound
Yesterday morning, the UK Prime Minister Theresa May kick started a day of GBP volatility after her shock decision to call a snap general election for June 10th.
Although the Conservative Party currently holds the majority in parliament, recent polling numbers have suggested that they will increase this majority in the general election. With some political parties, still against Brexit and a cloud of doubt surrounding the kind of deal the UK will reach with the EU, a larger majority will help strengthen the negotiating position of May when trying to achieve the best possible kind of deal.
The vote in the Commons to approve the proposal for a snap general election instead of a 2020 election will require more than 2/3 of votes to pass. Some opposing parties have shown their support for the decision and the proposal is expected to pass.
Uncertainty surrounding the platform outside No.10 resulted in GBP/USD initially plunged around 80 points. However, this was followed by a dramatic reversal when the Prime Minister announced the general election, sending Cable surging around 390 pips, hitting the highest level of 1.2904 since October 3, and marking the biggest intra-day volatility since January 17.
The surge was helped by market expectations that the Conservative Party would become the massive majority in the parliament after the election, and that the UK would be in a stronger position during the Brexit negotiations, which would provide greater support for the Pound.
EUR/GBP fell from the psychological level at 0.8500, hitting the lowest level of 0.8312 since December 5, marking the biggest intra-day fall since November 9.
Volatility is expected to remain somewhat constant around GBP as the pace of Brexit begins to ramp up, with the EU and Theresa May both trying to secure the best possible deal in what could be a very messy divorce.
A result of the surge of GBP was a slump in the FTSE 100 index, hitting the lowest level of 7109 since February 2, with the strengthening of GBP weighing on exporters. The mining sector in particular felt the brunt of the strengthening GBP and was one of the worst performers.
In other news, the dollar has continued to weaken since Trump made the second USD overly strong statement. Tuesday EUR/USD hit the highest level of 1.0735 since March 30.
Elliott Wave View: US OIL
A break below the small best fit channel on the daily chart indicated a trend change for US Oil.
Members were then advised to enter a short position. Short positions are now positive.
Summary: Use the small best fit channel on the daily Elliott wave count. If price breaks below the lower edge, then expect Oil has changed trend. The target would be at least a new low below 47.06; it should be comfortably below that point. Expect price may continue higher while it remains within the channel.
New updates to this analysis are in bold.
MONTHLY ELLIOTT WAVE COUNT
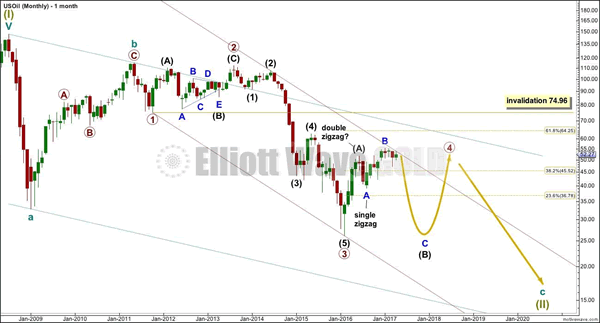
Within the bear market, cycle wave b is seen as ending in May 2011. Therea!er, a five wave structure downwards for cycle wave c begins.
Within cycle wave c, at this stage it does not look like primary wave 5 could be complete. That would only be possible if primary wave 4 was over too quickly.
Primary wave 1 is a short impulse lasting five months.
Primary wave 2 is a very deep 0.94 zigzag lasting 22 months. Primary wave 3 is a complete impulse with no Fibonacci ratio to primary wave 1. It lasted 30 months. Primary wave 4 is likely to exhibit alternation with primary wave 2. Primary wave 4 is most likely to be a flat, combination or triangle. Within all of these types of structures, the first movement subdivides as a three. The least likely structure for primary wave 4 is a zigzag.
Primary wave 4 is likely to end within the price territory of the fourth wave of one lesser degree; intermediate wave (4) has its range from 42.03 to 62.58.
If primary wave 4 is incomplete, then it looks like it may not remain contained within the channel. Sometimes fourth waves overshoot channels and this is why Elliott developed a second technique to redraw the channel when it does not contain a fourth wave.
Primary wave 4 is most likely to be shallow to exhibit alternation in depth with primary wave 2. So far it has passed the 0.382 Fibonacci ratio at 45.52. It may now continue to move mostly sideways in a large range.
Primary wave 4 may not move into primary wave 1 price territory above 74.96.
At this stage, primary wave 4 has completed intermediate wave (A) only. Intermediate wave (B) is incomplete.
WEEKLY ELLIOTT WAVE COUNT
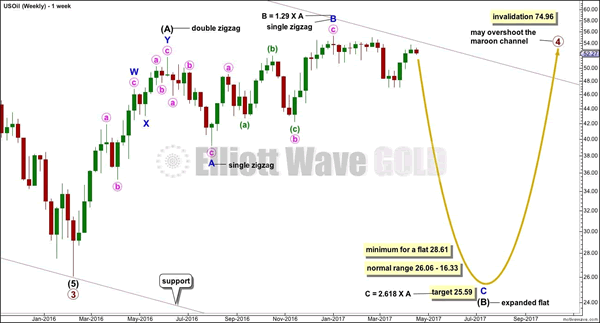
Within the bear market, cycle wave b is seen as ending in May 2011. Therea!er, a five wave structure downwards for cycle wave c begins.
Within cycle wave c, at this stage it does not look like primary wave 5 could be complete. That would only be possible if primary wave 4 was over too quickly.
Primary wave 1 is a short impulse lasting five months.
Primary wave 2 is a very deep 0.94 zigzag lasting 22 months. Primary wave 3 is a complete impulse with no Fibonacci ratio to primary wave 1. It lasted 30 months. Primary wave 4 is likely to exhibit alternation with primary wave 2. Primary wave 4 is most likely to be a flat, combination or triangle. Within all of these types of structures, the first movement subdivides as a three. The least likely structure for primary wave 4 is a zigzag.
Primary wave 4 is likely to end within the price territory of the fourth wave of one lesser degree; intermediate wave (4) has its range from 42.03 to 62.58.
If primary wave 4 is incomplete, then it looks like it may not remain contained within the channel. Sometimes fourth waves overshoot channels and this is why Elliott developed a second technique to redraw the channel when it does not contain a fourth wave.
Primary wave 4 is most likely to be shallow to exhibit alternation in depth with primary wave 2. So far it has passed the 0.382 Fibonacci ratio at 45.52. It may now continue to move mostly sideways in a large range.
Primary wave 4 may not move into primary wave 1 price territory above 74.96.
At this stage, primary wave 4 has completed intermediate wave (A) only. Intermediate wave (B) is incomplete.
WEEKLY ELLIOTT WAVE COUNT
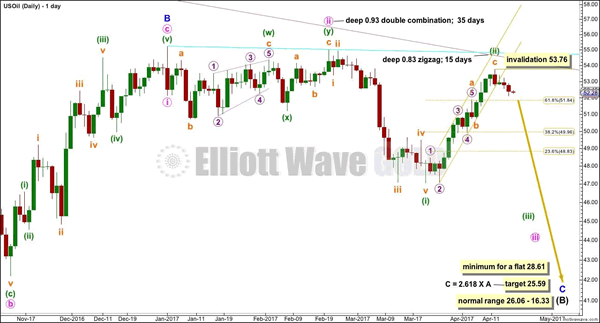
Minor wave C downwards must subdivide as a five wave structure.
Within minor wave C, minute waves i and ii should be complete and minute wave iii must be incomplete. Upwards movement, which is labelled minuette wave (ii), cannot be minute wave iv as it overlaps back into minute wave i price territory.
Within minute wave iii, minuette wave (i) is complete and minuette wave (ii) now looks most likely to be over.
small best fit channel is drawn about the zigzag of minuette wave (ii). This channel is now breached providing trend channel confirmation of a trend change. This wave count would now expect an increase in downwards momentum.
Minuette wave (iii) must make a new low below the end of minuette wave (i) at 47.06. It must move far enough below that point to allow for subsequent upwards movement for minuette wave (iv) to unfold and remain below minuette wave (i) price territory.
Within minuette wave (iii), no second wave correction may move beyond the start of its first wave above 53.76.
The cyan trend line is drawn from the high labelled minor wave B to the next swing high labelled minute wave ii. This is a Magee trend line for a bear market. Expect that US Oil is most likely in a downwards trend as long as price remains below this cyan trend line.
TECHNICAL ANALYSIS
DAILY CHART
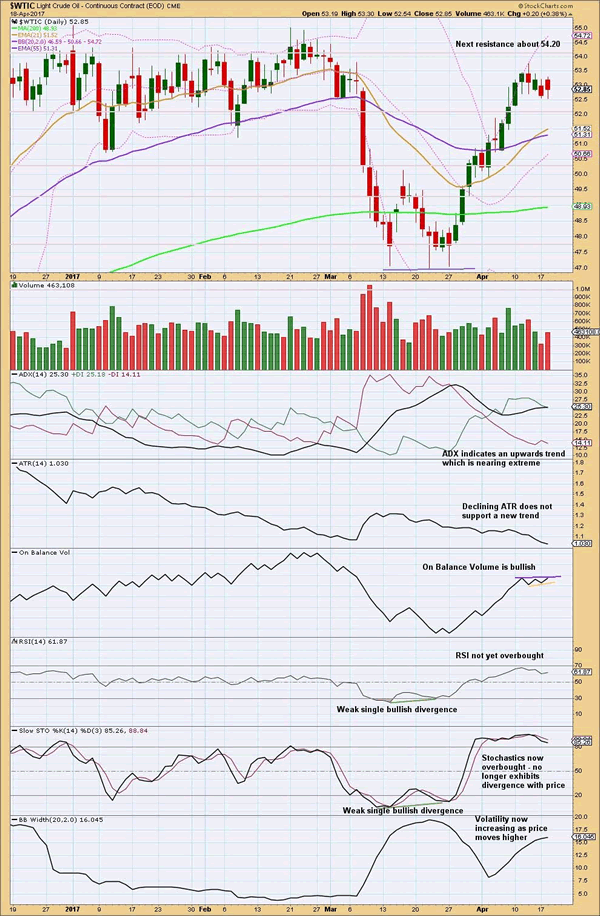
The candlestick of the 12th of April completes a Bearish Engulfing Candlestick reversal pattern. The important condition for this pattern (where the close of the second candlestick is below the open of the first) is met. This is one of the most reliable reversal patterns. It works more o!en than not, but not always. An example of it not working is shown on the 3rd of April.
The reversal pattern of the 12th of April has support from volume whereas the 3rd of April did not. This increases the probability that price may reverse here.
The long lower wick on the last daily candlestick for the 18th of April is bullish, as is stronger volume to support upwards movement of price during the session (indicated by On Balance Volume moving higher for this session). This bounce may move a little higher.
New trend lines are drawn on On Balance Volume. These do not yet have good technical significance, so a breach here would be only a weak signal.
VOLATILITY INDEX
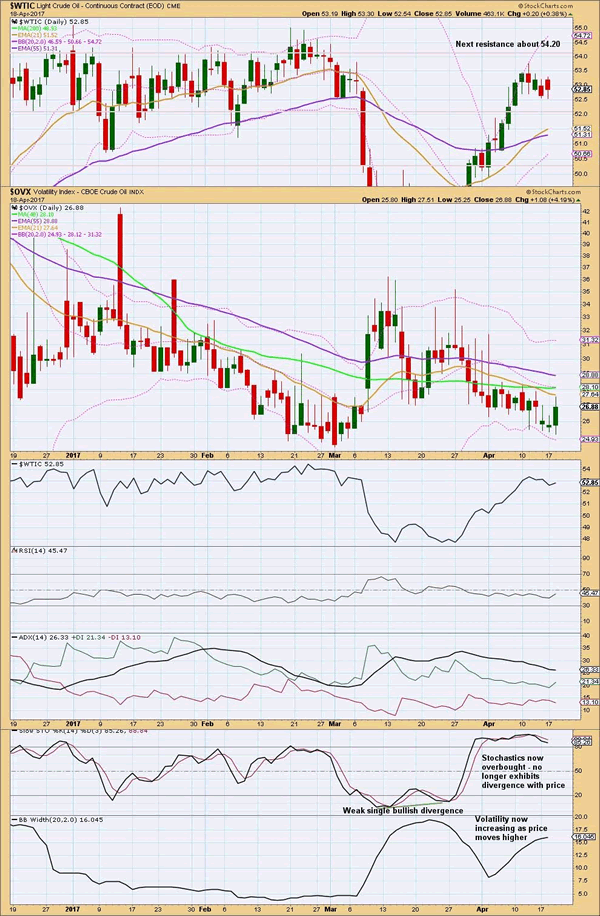
For the last session, here dated the 18th of April, volatility has declined below the 11th of April but price has not made a new high. This divergence is bearish and supports the idea of a trend change here for Oil.
Trade Idea : GBP/USD – Buy at 1.2650
GBP/USD - 1.2818
Most recent candlesticks pattern : N/A
Trend : Near term up
Tenkan-Sen level : 1.2833
Kijun-Sen level : 1.2711
Ichimoku cloud top : 1.2566
Ichimoku cloud bottom : 1.2550
Original strategy :
Buy at 1.2650, Target: 1.2750, Stop: 1.2615
Position : -
Target : -
Stop : -
New strategy :
Buy at 1.2720, Target: 1.2850, Stop: 1.2685
Position : -
Target : -
Stop : -
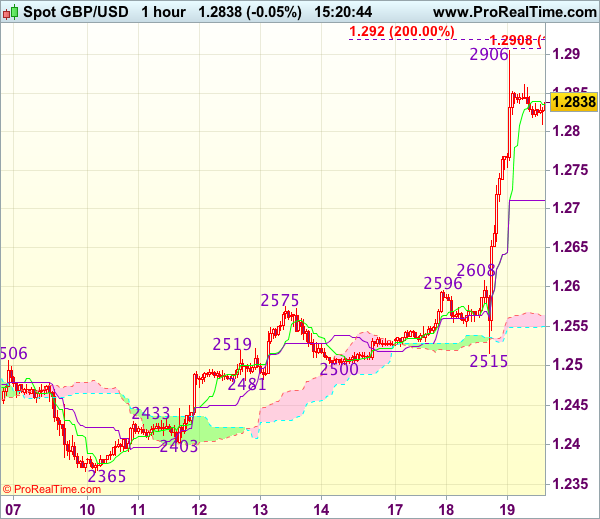
Yesterday’s rally from 1.2515 to 1.2906 signals recent upmove from 1.1986 low is still in progress and although price has eased from 1.2906 reckon downside would be limited to 1.2750 and the Kijun-Sen (now at 1.2711) should hold, bring another rise later, above said resistance at 1.2906 would extend recent rise to 1.2920-30 (2 times extension of 1.2365-1.2575 measuring from 1.2500), then 1.2950 but loss of near term upward momentum should prevent sharp move beyond 1.2990-00 (1.236 times projection of 1.2109-1.2616 measuring from 1.2365 and psychological resistance), risk from there is seen for a retreat to take place later.
In view of this, would not chase this rise here and would be prudent to buy cable on subsequent pullback as price should stay above the Kijun-Sen (now at 1.2711), bring another rise later. Below 1.2690-00 would defer and risk correction to 1.2660 but price should stay well above 1.2608-16 (previous resistance now support), bring another upmove.
US Homebuilding Activity And Manufacturing Production Raise Concerns Over Q1 GDP Growth
'The economy seems to have hit a soft patch in the first quarter and Fed officials are likely to wait to see the rebound before raising rates again. The clouds from the outlook skies may not lift until late this summer.' - Chris Rupkey, MUFG Union Bank
US homebuilding activity dropped more than expected last month amid the unusually warm weather and weaker manufacturing activity, official figures revealed on Tuesday. The US Department of Commerce reported that housing starts fell 6.8% to a seasonally adjusted rate of 1.22M, as construction of single-family homes in the Midwest posted the largest decline since 2014. Meanwhile, market analysts anticipated a slighter drop to a 1.25M unit rate in March, following the preceding month's upwardly revised 1.30M unit rate. On an annual basis, housing starts were up 9.2%. Data also showed that building permits climbed to a 1.26M unit rate in March, compared to the previous month's upwardly revised 1.22M unit rate, whereas analysts expected a rise to 1.25M unit rate. Separately, the Federal Reserve reported that manufacturing output plunged 0.4% in March, driven by a 3.0% decrease in the motor vehicle and part sector. On a yearly basis, manufacturing output advanced 2.7% in the Q1 of 2017. Both reports raised concerns over the Fed postponing its second rate hike this year. Moreover, the data suggested that the US economy performed weaker than expected in the Q1. Following Tuesday's releases, the US Dollar hit its three week low against a basket of major currencies.