

Sample Category Title
Markets Back in Risk Aversion, Pound Maintains Gains
Markets are generally trading in risk averse mode after UK Prime Minister Theresa May's surprised call for snap election. That also adds to the backdrop of geopolitical tensions in North Korea and Syria. DJIA closed down -113.64 pts or -0.55% at 20523.28. S&P 500 lost -6.82pts or -0.29% to close at 2342.19. Nonetheless, both indices are still trying to draw support from 55 day EMA. In Asian session, China leads other Asian markets lower as SSE composite index drops -40 pts or -1.23% at the time of writing. Hong Kong HSI is losing -150 pts or -0.63%. Nikkei, however, recovers and is trading up 0.2% at the time of writing.
Bond yield plunges on safe haven flows
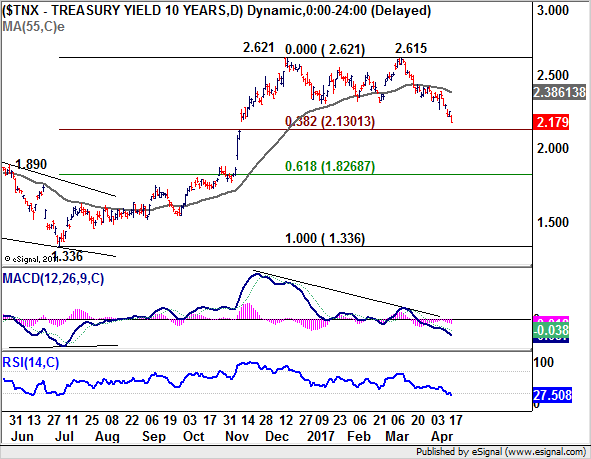
Biggest movements were actually seen in bond markets on safe haven flow. US 30 year yield dropped -0.071 to close at 2.842. US 10 yield also lost -0.073 to close at 2.179. 10 year yield's correction from 2.615 is still on course to 2.13 fibonacci level. In addition to risk aversion, markets are also paring bets on a June Fed rate hike. Fed fund futures is now pricing in only 44.7% chance of that, comparing to over 60% chance last month. Japan 10 year bond yield also briefly touches zero percent today, first time since last November. In the currency markets, Sterling remains the strongest one as boosted by the snap election news. Strength in the British Pound lifted Euro and Swiss Franc higher. Aussie and Loonie are trading as the weakest ones.
UK PM May seeks snap election
UK PM Theresa May announced yesterday that she would seek MPs' support for an early general election to be held on June 8. The news came in less than a month after her affirmation that "the next election will be in 2020". The rationale behind such move is to consolidate her power after Brexit was formally triggered in late March. A landslide victory of the Conservative Party would strengthen May's mandate in the 2-year Brexit negotiations.
Pound reactions indicates market confidence
The strong rally of the sterling suggested that the market was confident that the election would serve its purpose. Indeed, latest opinion polls showed that 44% of the British people support Conservatives, compared with Labor's 23%. Support for LibDem stayed at low teen. Meanwhile, 50% of interviewees indicated that May would make the best PM Minister, compared with 14% for Labor's Jeremy Corbyn.
It is usually positive for a country's currency if the ruling party retains power in an election, as it means lower uncertainty. Sterling's volatility would remain elevated from now until the election. Yet, short-term rebound does not alter the currency's long-term bearishness should the tough Brexit negotiations eventually return to the spotlight.
More in UK Prime Minister Theresa May Changes Stance and Calls for Snap Election
EC Tusk: "It was Hitchcock, who directed Brexit"
In response to the news, European Council President Donald Tusk's spokesman said that "the UK elections do not change our EU27 plans." And, "we expect to have the Brexit guidelines adopted by the European Council on 29 April and following that the Brexit negotiating directives ready on 22 May. This will allow the EU27 to start negotiations." Tusk tweeted with his own account that he had a "good" conversation with May after the announcement. But his also tweeted that "it was Hitchcock, who directed Brexit: first an earthquake and the tension rises."
Kansas City Fed George: Don't over interpret soft Q1
Kansas City Fed President Esther George said yesterday that "the economy has these fits and starts and we've seen this over the last five years." And, while first quarter "looks soft" Fed shouldn't "over-interpret" the data. "For the year as a whole, I still see consumer spending in a way that should carry the economy forward." Meanwhile, George also said that "balance sheet adjustments will need to be gradual and smooth, which is an approach that carries the least risk in terms of a strategy to normalize its size." And, "importantly, once the process begins, it should continue without reconsideration at each subsequent FOMC meeting. In other words, the process should be on autopilot and not necessarily vary with moderate movements in the economic data."
On the data front
Australia Westpac leading index rose 0.1% mom in March. Eurozone trade balance and CPI will be the main feature in European session. Fed will release Beige Book report later in the day.
GBP/JPY Daily Outlook
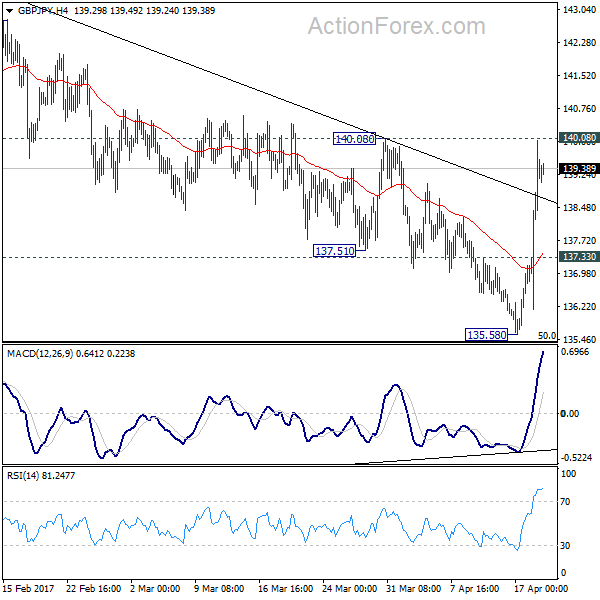
Daily Pivots: (S1) 136.92; (P) 138.46; (R1) 140.80; More...
GBP/JPY rises to as high as 140.01 so far, just inch below 140.08 near term resistance. Current developments argues that consolidation pattern from 148.42 is possibly completed at 135.58, just ahead of 135.39 fibonacci level. Intraday bias stays on the upside and break of 140.08 will affirm this case. GBP/JPY should then target a test on 148.42 key resistance level. Meanwhile, this bullish case will be favored as long as 137.33 minor support holds, in case of retreat.
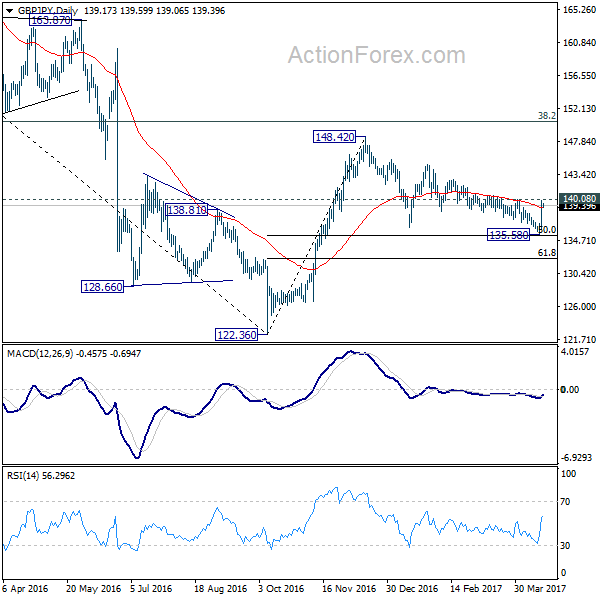
In the bigger picture, price actions from 122.36 medium term bottom are still seen as a corrective pattern. As long as 50% retracement of 122.36 to 148.42 at 135.39 holds, another rising leg would be seen to 38.2% retracement of 195.86 to 122.36 at 150.42 and possibly above. However, firm break of 135.39 will bring retest of 122.36, with prospect of resuming the larger down trend from 195.86.
Economic Indicators Update
| GMT | Ccy | Events | Actual | Forecast | Previous | Revised |
|---|---|---|---|---|---|---|
| 00:30 | AUD | Westpac Leading Index M/M Mar | 0.10% | -0.10% | ||
| 09:00 | EUR | Eurozone Trade Balance (EUR) Feb | 18.6B | 15.7B | ||
| 09:00 | EUR | Eurozone CPI M/M Mar | 0.40% | 0.40% | ||
| 09:00 | EUR | Eurozone CPI Y/Y Mar F | 1.50% | 1.50% | ||
| 09:00 | EUR | Eurozone CPI - Core Y/Y Mar F | 0.70% | 0.70% | ||
| 14:30 | USD | Crude Oil Inventories | -2.2M | |||
| 18:00 | USD | Federal Beige Book |
Market Update – Asian Session: US Equities Started The Morning Lower
US Session Highlights
(US) MAR HOUSING STARTS: 1.22M V 1.25ME; BUILDING PERMITS: 1.26M V 1.25ME
(CA) CANADA MAR EXISTING HOME SALES M/M: 1.1% V 5.2% PRIOR
(US) MAR INDUSTRIAL PRODUCTION M/M: 0.5% V 0.4%E; CAPACITY UTILIZATION: 76.1% V 76.1%E
IMF raises FY17 global growth forecast to 3.5% from 3.4% prior
US equities started the morning lower, weighed down by weakness in European bourses and disappointing earnings from Goldman Sachs and J&J. Markets pared losses as the session wore on but ended in the red. The EUR/USD hit fresh 2-week highs and Dollar index dropped 0.7% after UK Prime Min May's call for snap elections, and U.S. Treasuries moved higher as the 10-yr yield lost 6bps. Oil dropped in a choppy trading day, and WTI crude settled down 0.5%. Consumer staples were solidly in the green on the day, boosted by new all-time highs in PepsiCo and Dr Pepper Snapple, while health care and financials were the market laggards.
US markets on close: Dow -0.6%, S&P500 -0.3%, Nasdaq -0.1%
Best Sector in S&P500: Consumer Staples
Worst Sector in S&P500: Health Care
Biggest gainers: AN +3%; IP +1.9%; IRM, +1.8%
Biggest losers: CAH -11.5%; GWW -11.4%; ABC -4.7%
At the close: VIX 14.4 (-0.2pts); Treasuries: 2-yr 1.16% (-4bps), 10-yr 2.17% (-8bps), 30-yr 2.84% (-7bps)
US movers afterhours
NVLS To merge with Alpine Immune Sciences in all-stock deal valuing NVLS at approx $50M; +29.6% afterhours
RARE Ultragenyx, Kyowa Hakko Kirin and Kyowa Kirin International announce positive 24-week data from Adult Phase 3 Study of Burosumab (KRN23) in X-Linked Hypophosphatemia; +22.9% afterhours
ISRG Reports Q1 $5.09 v $4.90e, R$674.2M v $661Me; +4.3% afterhours
LRCX Reports Q3 $2.80 v $2.54e, R$2.15B v $2.13Be; Guides Q4 $2.88-3.12 v $2.63e; R$2.2-2.4B v $2.18Be; +3.6% afterhours
IBM Reports Q1 $2.38 v $2.34e, R$18.2B v $18.5Be; Affirms FY17 at least $13.80 v $13.80e; -3.8% afterhours
DSX Announces $70M offering of common shares (16% of market cap); CEO, other executives and directors agree to buy $20M in the public offering; -9.8% afterhours
Key economic data
(NZ) NEW ZEALAND MAR PERFORMANCE SERVICES INDEX: 59.0 V 58.7 PRIOR
(AU) AUSTRALIA MAR WESTPAC LEADING INDEX M/M: +0.1% V -0.1% PRIOR
(AU) AUSTRALIA MAR NEW MOTOR VEHICLE SALES M/M: 1.9% V -2.7% PRIOR; Y/Y: -3.0% V -4.0%PRIOR
Asia Session Notable Observations, Speakers and Press
Risk appetite waning in the wake of soft US housing data and a bombshell out of the UK about snap elections. Asia indices tracking lower close on Wall St, where Financials, Energy and Health Care were the worst performs while lower-beta Utilities/Telecom/Staples gained. US Treasuries were also bid higher, with 10-yr yield extending its slide below 2.20%. May WTI contract declined about $0.30 on lower draw in API petroleum inventories.
China:
(CN) China said to have eased its yuan outflow controls last week - Chinese press
(CN) China premier Li: China and EU should send signals of globalization and free trade - press citing comments from meeting with EU's Mogherini
Japan:
(JP) Japan deputy chief cabinet Sec Hagiuda: To closely monitor UK election and Brexit developments - press
(JP) Incoming members on the BOJ board to bolster the camp of proponents for quantitative easing - Nikkei
Australia:
(AU) Australia Trade Min Ciobo: Have seen a strengthening in Japan/Australia relations
Korea:
(KR) South Korea Fin Min Yoo: Facing risks including North Korea and trade; Q1 GDP may exceed forecasts
Asian Equity Indices/Futures (23:30ET)
Nikkei flat, Hang Seng -0.7%, Shanghai Composite -1.0%, ASX200 -0.7%, Kospi -0.5%
Equity Futures: S&P500 +0.1%; Nasdaq +0.1%, Dax flat, FTSE100 -0.2%
FX ranges/Commodities/Fixed Income (23:30ET)
EUR 1.0715-1.0735; JPY 108.38-68; AUD 0.7524-0.7563; NZD 0.7034-0.7052
June Gold -0.4% at 1,289/oz; May Crude Oil -0.2% at $52.31/brl; May Copper +0.9% at $2.55/lb
iShares Silver Trust ETF daily holdings fall to 10,178 tonnes from 10,208 tonnes prior
(US) Weekly API Oil Inventories: Crude: -0.8M v -1.3M prior; 3rd straight draw
(CN) PBOC SETS YUAN MID POINT AT 6.8664 V 6.8849 PRIOR; strongest setting since Apr 13th, first firmer setting in 4 days
(AU) Australia MoF (AOFM) sells A$800M in 2.75% 2027 Bonds; avg yield: 2.5146%; bid-to-cover: 3.24x
Asia equities / Notables
Australia
Oil Search (OSH) -2.8%; (Q1 output)
Brambles (BXB) +4.3% (9-month Rev)
Newcrest (NCM) -1.4% (Cadia mine closed; Cut at Morgans)
Hong Kong
Geely (175) +2.8% (raised at Daiwa)
Top Spring International (3688) -1.5% (contracted sales)
Japan
Toshiba (6502) +1.6% (chip unit bid report from ICJ)
Hakuhodo DY Holdings (2433) +1.3% (FY result speculation)
Mitsubishi Electric (6503) +3.0% (China sales expansion)
Crude Oil Prices Have Come Under Pressure In Recent Days On Rising Global Growth Concerns
Market movers today
A relatively quiet day ahead in terms of data releases with the final reading of eurozone March HICP inflation due; the first release revealed a marked drop in headline CPI to 1.5% y/y (from 2.0% in February) and core inflation dropped to 0.7% (from 0.9%), a trend we think will be cemented in the months ahead, due partly to base effects of past energy price rises fading and due partly to subdued core inflation.
The ECB's Coeure and Praet are both due to speak in New York and markets will stay alert to comments regarding how tolerant the ECB will be in seeing lower inflation prints ahead and to comment son whet her or not ‘exit easing' discussions are ongoing at the Governing Council.
In the US, the Fed's Rosengren is speaking and the Beige Book is released, which will be scrut inised for hints of whether the Fed sees a slowing US economy, as we have highlighted as a key risk following the fading Trump growth euphoria.
No Scandi events scheduled for today. For more on Scandi markets, see page 2.
Selected market news
Political risks continue to be in charge of markets after Prime Minister Theresa May yesterday called for an early UK general election, and as the first round of the French presidential election is coming up, this Sunday looks increasingly open.
While the UK Prime Minister still needs backing from the House of Commons to send voters to the polls on 8 June, she is likely to get t his in t oday's session. See Brexit Monitor No. 28: Snap election increases number of uncertainty factors, 18 April 2017. Based on the most recent opinion polls, the Conservatives maintain a clear lead over Labour and due to the UK's 'first past the post ' system, this means that the Tories are likely to increase their majority lead in the Commons. This could leave the May government with a stronger mandate to negotiate Brexit. Crucially, the election call opens up the sample space for Brexit outcomes wi th markets notably eyeing a chance that Brexit may be softened, and, as a result , sterling cheered yesterday. EUR/GBP is trading around the 0.8350 mark this morning.
The upcoming French election is also adding to political risks in Europe near term with left-wing Mélenchon having seen a marked rise in the polls, suggesting he could win against Fillon or Le Pen should he manage to make it to the second round (st ill not the most likely outcome though). A potential run-off between the two EU-sceptics Mélenchon and Le Pen seems to be the biggest risk-scenario in the market at the moment. See French Election Monitor No. 2: Mélenchon could enter second election round in May for details.
Uncertainty has indeed grabbed hold of markets in recent days. Equity markets posted losses predominantly in the US and Asian sessions, dragged down by disappointing earnings and the souring risk sentiment more broadly. Oil prices have come under pressure in recent days on rising global growth concerns, while gold is moving higher still on geopolitical tensions. The safety of government bonds is back in demand with notably the Japanese 10Y benchmark yield falling below zero overnight .
Australia’s Westpac Leading Index Rebounded In March
For the 24 hours to 23:00 GMT, the AUD declined 0.44% against the USD and closed at 0.7553.
LME Copper prices declined 0.6% or $34.5/MT to $5620.5/MT. Aluminium prices rose 1.4% or $25.5/MT to $1915.5/MT.
In the Asian session, at GMT0300, the pair is trading at 0.7529, with the AUD trading 0.32% lower against the USD from yesterday's close.
Overnight data showed that Australia's Westpac leading index rebounded 0.08% in March. The index had recorded a drop of 0.07% in the previous month.
The pair is expected to find support at 0.7511, and a fall through could take it to the next support level of 0.7492. The pair is expected to find its first resistance at 0.7557, and a rise through could take it to the next resistance level of 0.7584.
The currency pair is trading below its 20 Hr and 50 Hr moving averages.

Euro Trading Lower, Ahead Of The Euro-Zone’s Final Inflation Data
For the 24 hours to 23:00 GMT, the EUR rose 0.83% against the USD and closed at 1.0729.
The greenback lost ground against most of its key counterparts, following disappointing housing starts and manufacturing production data in the US that supported the notion that the US economy lost momentum in the first quarter of 2017.
Data indicated that housing starts in the US dropped 6.8% on a monthly basis, to an annual rate of 1215.0K in March. Markets expected housing starts to fall to a level of 1250.0K, following a revised level of 1303.0K in the prior month. Additionally, the nation's manufacturing production registered an unexpected drop of 0.4% in March, dropping for the first time in seven months as auto production dropped sharply. In the previous month, manufacturing production had climbed by a revised 0.3%, while markets were expecting for a flat reading.
On the other hand, the US industrial production rose 0.5% in March, in line with market expectations, driven by a record rebound in utility output. In the prior month, industrial production had recorded a revised rise of 0.1%. Moreover, the nation's building permits climbed more-than-anticipated by 3.6% MoM, to an annual rate of 1260.0K in March, against market expectations for a rise to a level of 1250.0K and after recording a revised reading of 1216.0K in the prior month.
In the Asian session, at GMT0300, the pair is trading at 1.0720, with the EUR trading 0.08% lower against the USD from yesterday's close.
The pair is expected to find support at 1.0661, and a fall through could take it to the next support level of 1.0603. The pair is expected to find its first resistance at 1.0757, and a rise through could take it to the next resistance level of 1.0795.
Moving ahead, investors will focus on the Euro-zone's final consumer price index for March and trade balance data for February, slated to release in a few hours. Additionally, in the US, the Federal Reserve (Fed) Beige Book report and MBA mortgage applications data, will attract a lot of market attention.
The currency pair is trading above its 20 Hr and 50 Hr moving averages.

Theresa May Calls Snap General Election On 8th June
For the 24 hours to 23:00 GMT, the GBP rose 2.27% against the USD and closed at 1.2842, following Britain Prime Minister, Theresa May’s snap election announcement.
In a surprise move, the British Prime Minister called for an early parliamentary election in order to strengthen her hand in divorce talks with the European Union.
In the Asian session, at GMT0300, the pair is trading at 1.2821, with the GBP trading 0.16% lower against the USD from yesterday’s close.
The pair is expected to find support at 1.2588, and a fall through could take it to the next support level of 1.2355. The pair is expected to find its first resistance at 1.2979, and a rise through could take it to the next resistance level of 1.3137.
In absence of any economic releases in the UK, investors will focus on a speech by the Bank of England (BoE) Governor, Mark Carney, slated tomorrow.
The currency pair is trading above its 20 Hr and 50 Hr moving averages.

Japanese Yen Trading A Tad Lower In The Morning Session
For the 24 hours to 23:00 GMT, the USD declined 0.55% against the JPY and closed at 108.43.
In the Asian session, at GMT0300, the pair is trading at 108.48, with the USD trading marginally higher against the JPY from yesterday’s close.
The pair is expected to find support at 108.13, and a fall through could take it to the next support level of 107.78. The pair is expected to find its first resistance at 108.99, and a rise through could take it to the next resistance level of 109.50.
Moving ahead, traders would concentrate on Japan’s adjusted merchandise trade balance for March, due to release overnight.
The currency pair is showing convergence with its 20 Hr and 50 Hr moving averages.

Swiss Franc Trading On A Weaker Footing In The Asian Session
For the 24 hours to 23:00 GMT, the USD declined 0.81% against the CHF and closed at 0.9961.
In the Asian session, at GMT0300, the pair is trading at 0.9971, with the USD trading 0.1% higher against the CHF from yesterday’s close.
The pair is expected to find support at 0.9936, and a fall through could take it to the next support level of 0.9901. The pair is expected to find its first resistance at 1.0024, and a rise through could take it to the next resistance level of 1.0077.
Amid a lack of economic releases in Switzerland today, trading trend in the CHF is expected to be determined by global macroeconomic factors.
The currency pair is trading below its 20 Hr and 50 Hr moving averages.

Canada’s Existing Home Sales Advanced In March
For the 24 hours to 23:00 GMT, the USD rose 0.44% against the CAD and closed at 1.3383.
In economic news, Canada's existing home sales climbed 1.1% on a monthly basis in March, following a rise of 5.2% in the prior month.
In the Asian session, at GMT0300, the pair is trading at 1.3397, with the USD trading 0.1% higher against the CAD from yesterday's close.
The pair is expected to find support at 1.3338, and a fall through could take it to the next support level of 1.3279. The pair is expected to find its first resistance at 1.3429, and a rise through could take it to the next resistance level of 1.3461.
The currency pair is trading above its 20 Hr and 50 Hr moving averages.

Daily Technical Outlook And Review: EUR/USD, GBP/USD, AUD/USD, USD/JPY, USD/CAD, USD/CHF, DOW 30, GOLD
A note on lower timeframe confirming price action...
Waiting for lower timeframe confirmation is our main tool to confirm strength within higher timeframe zones, and has really been the key to our trading success. It takes a little time to understand the subtle nuances, however, as each trade is never the same, but once you master the rhythm so to speak, you will be saved from countless unnecessary losing trades. The following is a list of what we look for:
- A break/retest of supply or demand dependent on which way you're trading.
- A trendline break/retest.
- Buying/selling tails ... essentially we look for a cluster of very obvious spikes off of lower timeframe support and resistance levels within the higher timeframe zone.
- Candlestick patterns. We tend to only stick with pin bars and engulfing bars as these have proven to be the most effective.
EUR/USD
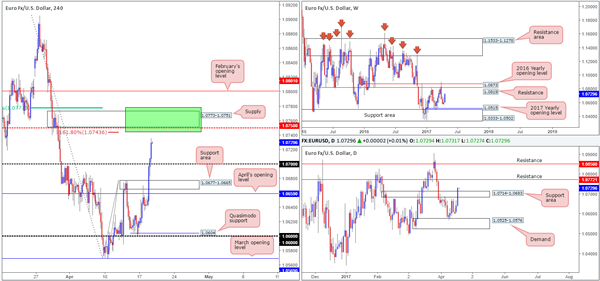
The EUR/USD, as you can see, recently ran through multiple H4 tech resistances amid a generally well-bid EUR and a beaten US dollar. With 1.07 now out of the picture, the next area of interest falls in around 1.0773-1.0751: a supply zone that sits in between a mid-level resistance at 1.0750/161.8% Fib extension at 1.0743 (drawn from the low 1.0569) and a 61.8% Fib resistance at 1.0777 (taken from the high 1.0905).
Yesterday's advance also managed to brush through the resistance area seen over on the daily chart at 1.0714-1.0683. This move, according to our technicals, has potentially opened the path north up to resistance at 1.0772, which happens to sit within the upper limits of the said H4 supply.
Our suggestions: The above points all suggest that the single currency may find resistance within our green area drawn on the H4 chart fixed at 1.0777/1.0743. Seeing as how the area is rather large and the weekly chart shows room to appreciate beyond the H4 sell zone, however, we will wait for a reasonably sized H4 bearish candle to print within before looking to sell.
Data points to consider: No high-impacting events.
Levels to watch/live orders:
- Buys: Flat (stop loss: N/A).
- Sells: 1.0777/1.0743 ([waiting for a reasonably sized H4 bear candle to form before pulling the trigger is advised] stop loss: ideally beyond the candle's wick).
GBP/USD:
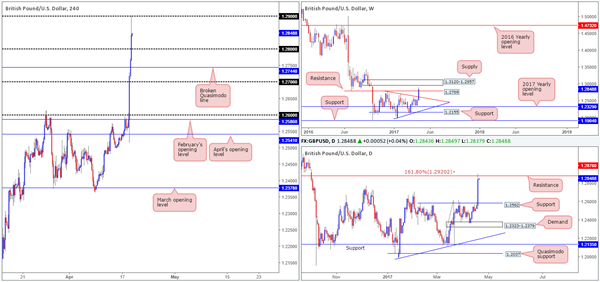
UK Prime Minister Theresa May surprised the markets yesterday by announcing plans to call a snap general election on June 8th. As can be seen from the charts, this received early backing from investors as the pair rallied over 300 pips!
In recent hours, however, H4 price managed to catch a relatively strong offer from the 1.29 handle, giving back over 50 pips into the closing bell. Also noteworthy is daily price recently connected with resistance coming in at 1.2876, which is shadowed closely by a 161.8% Fib extension taken from the low 1.2108. Up on the weekly timeframe, price also breached a resistance level seen at 1.2789, and may have set the stage for a continuation move up to supply drawn in at 1.3120-1.2957.
Our suggestions: It'll be interesting to see how the markets respond to recent events today. Technically, the pair does appear to be oversold, but it's very difficult to judge given the recent advance, which could very well continue. Therefore, opting to stand on the sidelines today may be the better path to take.
Data points to consider: No high-impacting events.
Levels to watch/live orders:
- Buys: Flat (stop loss: N/A).
- Sells: Flat (stop loss: N/A).
AUD/USD
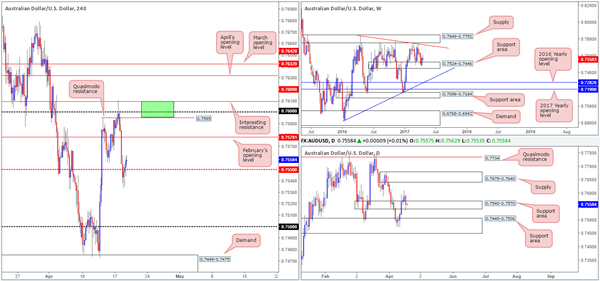
Using a top/down approach, we can see that weekly price remains above the support area at 0.7524-0.7446. This zone can be seen offering support and resistance as far back as mid-2016. Down on the daily chart, price can be seen aggressively retesting the support area coming in at 0.7540-0.7570. Providing that this base holds ground, the next upside target is seen around supply penciled in at 0.7679-0.7640.
With H4 price now seen trading back above the mid-level number 0.7550, the candles may look to go about challenging February's opening level today at 0.7578. Personally, we feel this resistance is rather soft, since, in our opinion, the stronger area for shorts is seen above (green zone) between 0.7609/0.7595 (Resistance/psychological handle/ Quasimodo resistance/).
Our suggestions: Although the noted green zone boasts attractive H4 confluence, it lacks higher-timeframe structure. Therefore, should you consider a short from here we'd still recommend waiting for additional confirmation in the form of a lower-timeframe sell signal (see the top of this report).
Data points to consider: No high-impacting events.
Levels to watch/live orders:
- Buys: Flat (stop loss: N/A).
- Sells: Flat (stop loss: N/A).
USD/JPY
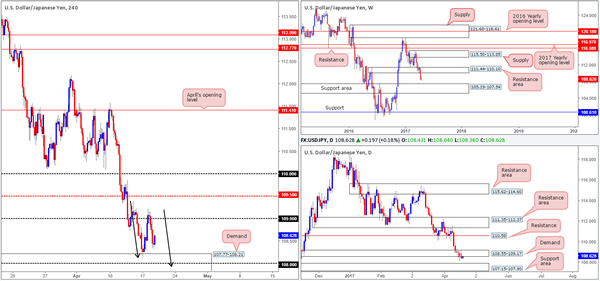
As can be seen from the H4 chart, the buyers failed to sustain gains beyond the 109 handle and dropped to a low of 108.32 into the close. Just ahead of current price sits a demand base coming in at 107.77-108.21, which holds the 108 handle within. Also of interest here is the approach: an AB=CD formation that completes just below the 108 number (see black arrows). Bolstering the noted H4 demand is a daily support area seen at 107.15-107.90, which itself is supported by a weekly support area at 105.19-107.54.
Our suggestions: Given the H4 demand is reinforced by a weekly and daily support area, and the additional H4 confluence, we feel a second try at longs from here is certainly worth the risk. Only this time, however, we will want to see a reasonably sized bull candle form out of the area before committing.
Data points to consider: No high-impacting events.
Levels to watch/live orders:
- Buys: 107.77-108.21 ([waiting for a reasonably sized H4 bull candle to form before pulling the trigger is advised] stop loss: ideally beyond the candle's tail).
- Sells: Flat (stop loss: N/A).
USD/CAD
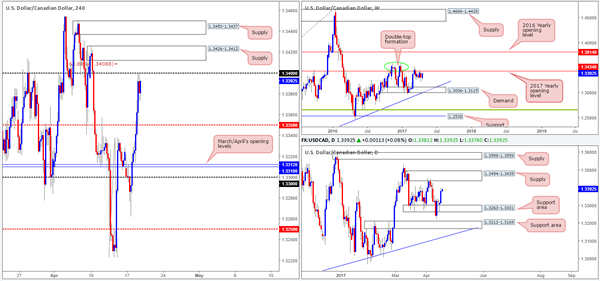
The US dollar made considerable ground against the Canadian dollar during yesterday's segment. It was only once price shook hands with the 1.34 handle did we see price stabilize.
Technically speaking, 1.34 looks vulnerable to the upside at the moment. It has absolutely no connection to the higher timeframes, and seen sitting just above this number is a H4 supply zone at 1.3426-1.3412 that boasts a 161.8% Fib extension at 1.3408 taken from the low 1.3223.
While the said H4 supply has a good chance of bouncing price, we're a little concerned with the daily supply at 1.3494-1.3439 positioned above, and also the 2017 yearly opening level at 1.3434.
Our suggestions: To protect oneself from a possible fakeout above the H4 supply zone, we would highly recommend waiting for a lower-timeframe confirming signal to form before executing a trade (see the top of this report). Failing that, you could always wait and see if price tests the H4 supply above at 1.3450-1.3437, as this zone actually sits within the boundaries of the aforementioned daily supply.
Data points to consider: No high-impacting events.
Levels to watch/live orders:
- Buys: Flat (stop loss: N/A).
- Sells: 1.3426-1.3412 ([waiting for additional lower-timeframe confirming price action is advised] stop loss: dependent on where one confirms this area). 1.3450-1.3437 ([waiting for additional lower-timeframe confirming price action is advised] stop loss: dependent on where one confirms this area).
USD/CHF
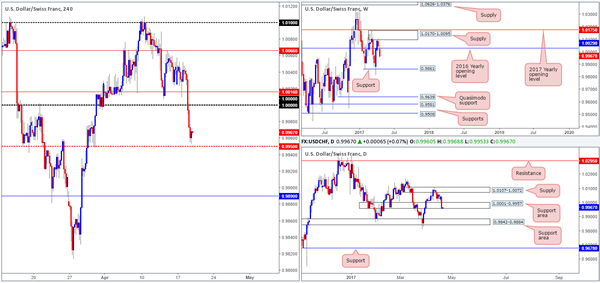
The USD/CHF broke below and retested the underside of parity (1.0000) going into the early hours of yesterday's US segment. From there, the US dollar continued to sag and ended the day closing just ahead of the H4 mid-level support at 0.9950.
With daily flow now seen teasing the lower edge of a support area at 1.0001-0.9957, there a possibility that we may see the pair reverse some of yesterday's losses today and maybe revisit parity. The only grumble here is that the weekly candles indicate that further selling could be on the cards down to support seen at 0.9861.
Our suggestions: In an ideal world, we would really like to see price interact with the H4 mid-level number 0.9950, before we think about taking a long position. A solid rejection off this number, coupled with the current daily support area already in play, would, in our opinion, be enough evidence to warrant a buy, targeting parity as an initial take-profit target.
Data points to consider: No high-impacting events.
Levels to watch/live orders:
- Buys: 0.9950 region ([waiting for a reasonably sized H4 bull candle to form before pulling the trigger is advised] stop loss: ideally beyond the candle's tail).
- Sells: Flat (stop loss: N/A).
DOW 30
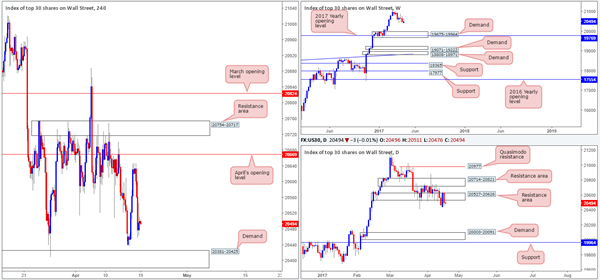
Looking at this index from the weekly timeframe, we can see that price looks poised to extend the pullback seen from record highs of 21170. The next base of support on this scale falls in at 19675-19964: a demand area that's bolstered by the 2017 yearly opening level at 19769.
In conjunction with weekly flow, the daily support area at 20527-20626 appears to be extremely fragile. So much so, that we've now labeled this zone as a resistance area. Assuming that the bears remain in the driving seat here, the next downside target can be seen around demand at 20003-20091, which happens to sit directly above the said weekly demand.
Before one looks to go about shorting this market though, it might be worth noting that there's a H4 demand area at 20381-20425 to contend with first. Once this area is cleared, the daily demand will likely be brought into the picture.
Our suggestions: Sit on your hands and wait for the H4 demand to be taken out. Once/if this comes to fruition, one can then look at shorting any retest seen to the underside of this zone, targeting the daily demand mentioned above.
Data points to consider: No high-impacting events.
Levels to watch/live orders:
- Buys: Flat (stop loss: N/A).
- Sells: Waiting for the H4 demand at 20381-20425 to be engulfed before considering shorts.
GOLD:
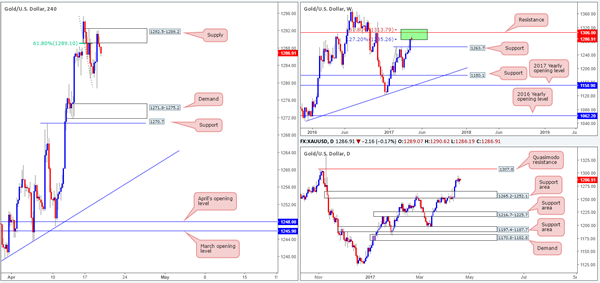
As highlighted in yesterday's report, the H4 supply at 1292.5-1289.2 (bolstered by a 61.8% Fib retracement at 1289.1) was a possible area for the bears to make an appearance. Well done to any of our readers who managed to jump aboard here!
In view of the weekly chart showing price trading within two Fibonacci extensions 161.8/127.2% at 1313.7/1285.2 taken from the low 1188.1 (green zone) at the moment, we feel further selling could be on the cards. In the event that the bears remain energetic, the support at 1263.7 could see a retest soon. Of particular interest on the daily timeframe is that the said weekly support is seen lodged within a daily support area marked at 1265.2-1252.1.
Our suggestions: It seems we might have missed the boat from the H4 supply, so the best we can do right now is wait and see if price retests the zone for a second time today, and enter on any reasonable H4 bearish rotation candle.
Levels to watch/live orders:
- Buys: Flat (stop loss: N/A).
- Sells: 1292.5-1289.2 ([waiting for a reasonably sized H4 bear candle to form before pulling the trigger is advised] stop loss: ideally beyond the candle's wick).