
Sample Category Title
Trade Idea Wrap-up: GBP/USD – Buy at 1.2650
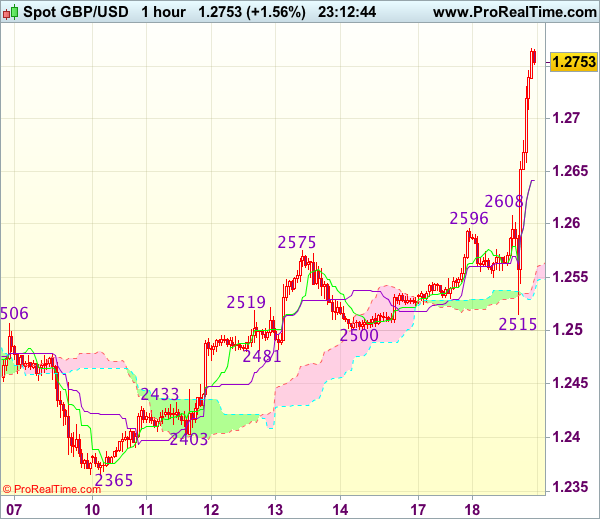
GBP/USD - 1.2763
Most recent candlesticks pattern : N/A
Trend : Near term up
Tenkan-Sen level : 1.2641
Kijun-Sen level : 1.2641
Ichimoku cloud top : 1.2549
Ichimoku cloud bottom : 1.2536
Original strategy :
Buy at 1.2650, Target: 1.2750, Stop: 1.2615
Position : -
Target : -
Stop : -
New strategy :
Buy at 1.2650, Target: 1.2750, Stop: 1.2615
Position : -
Target : -
Stop : -
As cable has rallied again after finding renewed buying interest at 1.2515, signaling recent upmove is still in progress and bullishness remains for recent rise from 1.2109 to extend further gain to previous chart resistance at 1.2775 , however, reckon upside would be limited to 1.2800 and 1.2825-30 (100% projection of 1.1986-1.2706 measuring from 1.2109) would hold from here, risk from there is seen for a retreat to take place later.
In view of this, would not chase this rise here and would be prudent to buy cable on subsequent pullback as 1.2650-55 should limit downside and bring another rise later. Below previous resistance at 1.2616 (now support) would defer and risk correction to 1.2570-75 and possibly 1.2545-50 but price should stay well above support at 1.2515 and bring another upmove.
Trade Idea Wrap-up: EUR/USD – Buy at 1.0675
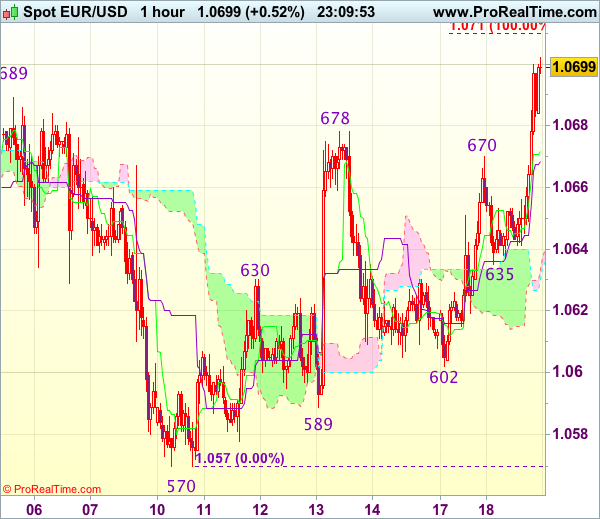
EUR/USD - 1.0700
Most recent candlesticks pattern : N/A
Trend : Near term down
Tenkan-Sen level : 1.0672
Kijun-Sen level : 1.0669
Ichimoku cloud top : 1.0633
Ichimoku cloud bottom : 1.0630
New strategy :
Buy at 1.0675, Target: 1.0775, Stop: 1.0640
Position : -
Target : -
Stop : -
The single currency has surged again after brief pullback and current break of resistance at 1.0670-78 resistance signals the erratic rise from 1.0570 low is still in progress and upside risk remains for further gain to 1.0710 (100% projection of 1.0570-1.0678 measuring from 1.0602), however, near term overbought condition should prevent sharp move beyond 1.0735-38 (1.236 times projection and 50% Fibonacci retracement of 1.0906-1.0570), price should falter well below 1.0775-80 (61.8% Fibonacci retracement, bring retreat later.
In view of this, would not chase this rise here and would be prudent to buy euro on pullback as the Tenkan-Sen (now at 1.0674) should limit downside. Only below support at 1.0635 would abort and signal an intra-day top is formed instead, risk weakness towards 1.0602 support.
Trade Idea Wrap-up: USD/JPY – Sell at 109.90 or buy at 108.45
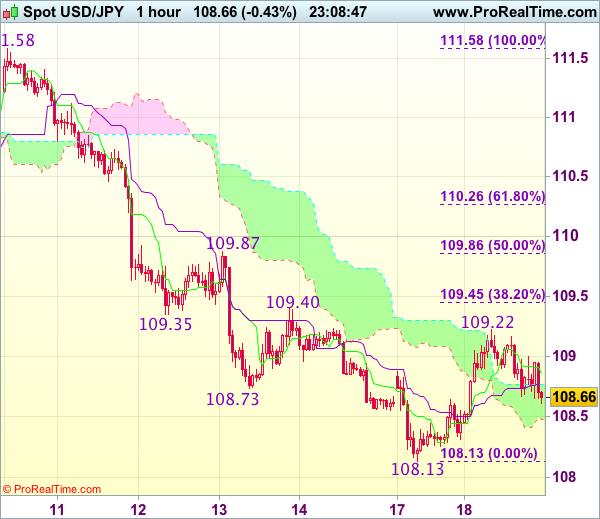
USD/JPY - 108.73
Most recent candlesticks pattern : N/A
Trend : Near term down
Tenkan-Sen level : 108.86
Kijun-Sen level : 108.77
Ichimoku cloud top : 108.77
Ichimoku cloud bottom : 108.47
Original strategy :
Sell at 109.90, Target: 108.90, Stop: 110.25
O.C.O.
Buy at 108.60, Target: 109.60, Stop: 108.25
Position : -
Target : -
Stop : -
New strategy :
Sell at 109.90, Target: 108.90, Stop: 110.25
O.C.O.
Buy at 108.45, Target: 109.45, Stop: 108.10
Position : -
Target : -
Stop : -
Although the greenback extended recent decline to as low as 108.13 yesterday, the subsequent strong rebound suggests a temporary low has been formed there and consolidation with mild upside bias is seen for retracement of recent decline, hence gain to 109.40-45 (previous resistance and 38.2% Fibonacci retracement of 111.58-108.13) is likely, however, reckon upside would be limited to 109.86-87 (50% Fibonacci retracement and previous resistance) and price should falter below 110.25-30 (61.8% Fibonacci retracement), bring retreat later to 108.50-60 but price should stay above 108.30-35, bring another rebound.
In view of this, whilst we are looking to turn long on dips for such a rebound, we are inclined to sell dollar on subsequent bounce as 109.90-00 should limit upside, bring another decline. Below 108.30-35 would risk retest of 108.13 support (yesterday’s low) but break there is needed to signal recent decline has resumed and extend weakness to 107.75-80 later.
USDCAD Loonie Lower as UK PM Calls for Snap Election
The Canadian dollar is lower on Tuesday trading after the Prime Minister of the UK Theresa May called for a snap election. Oil prices have dropped ahead of tomorrow's release of crude inventories with the consensus that shale production will have caused a buildup putting downward pressure on energy prices. Geopolitical risk continues to rattle markets with the news of the UK snap election and the upcoming French elections to kick off this weekend with the first round of voting.
Canadian resale housing data was published by the Canadian Real Estate Association shows a 1.1 percent rise in March with prices rising 18.6 percent year over year once again putting Toronto in the spotlight as the rest of the country cools down. Ontario officials will meet later in the day as voters are demanding a similar 15 tax increase to foreign buyers like the one imposed in Vancouver.
The USD/CAD gained 0.534 in the last 24 hours. The pair is trading at 1.3358 after the loonie depreciated on the back of falling oil prices. Economic data in the US economy has been mixed with a drop in housing starts that was offset by a rise in the expected number of building permits. Yesterday's US Empire State Manufacturing Index set a pessimistic tone for the week coming well below the forecast at 5.2.
February marked a record high of foreign investment in Canadian securities came as non-resident bought $35.87 billion as part of corporate takeovers and mergers.
Energy prices lost 0.839 percent in the last 24 hours. The price of West Texas is trading at $52.46 ahead of the release of US crude inventories by the Energy Information Administration (EIA). The US is expected to have increased its output of shale oil as production ramped up as the Organization of the Petroleum Exporting Countries (OPEC) agreement to cut member production got under way in 2017.
This weekend the OPEC membership will meet with the extension of the production cut agreement sure to be included in the agenda. Members and non-members for the most part have complied with the reduction. Russia is singled out as falling behind in the expected levels, while Saudi Arabia has gone the extra mile and cut above the agreed levels to bring the overall production down.
Market events to watch this week:
Wednesday, April 19
- 10:30am USD Crude Oil Inventories
Thursday, April 20
- 8:30am USD Philly Fed Manufacturing Index
- 8:30am USD Unemployment Claims
- 11:30am GBP BOE Gov Carney Speaks
- 12:30pm GBP BOE Gov Carney Speaks
- 1:15pm USD Treasury Sec Mnuchin Speaks
Friday, April 21
- 4:30am GBP Retail Sales m/m
- 8:30am CAD CPI m/m
Saturday, April 22
- All Day OPEC Meeting
Sunday, April 23
- All Day French Elections
*All times EDT
Yen Steady as US and Japan Discuss Trade and North Korea
USD/JPY has dropped in the Thursday session, as the dollar is trading below 109 yen in the North American session. In economic news, there are no Japanese events on the schedule. In the US, construction numbers were mixed. Building Permits improved to 1.26 million, edging above the forecast of 1.25 million. Housing Starts dropped to 1.22 million, shy of the forecast of 1.25 million.
North Korea has been a flash-point in recent weeks causing volatility in the markets as the war of words between the US and North Korea has escalated, with North Korea warning it will respond with a nuclear strike if attacked by the US. The crisis has been bullish for the safe-haven Japanese currency, which has climbed 2.2% in April. US vice-president Pence is in Tokyo to discuss bilateral trade relations as well as North Korea. President Trump has said that he wants the US to have greater access to Japanese markets and is looking for Japanese investment to help fund his infrastructure program.
US March consumer indicators, released on Friday, were softer than expected. CPI declined 0.3%, and Core CPI dropped 0.1%, as both indicators missed their estimates. Consumer spending followed suit, as Retail Sales and Core Retail Sales also missed estimates with readings of 0.2% and 0.0%, respectively. Earlier in the week, UoM Consumer Sentiment improved to 98.0, beating expectations and hitting a 3-month high.What is unusual is this data is that consumer confidence levels improved in March, yet consumer spending declined. The US consumer behavior continues to be marked by a "hard/soft discrepancy", as confidence levels ("soft data"), has not translated into actual spending numbers ("hard data"). The odds of a June rate hike from the Fed has fallen to 46%, down from 64% earlier in April. Janet Yellen & C0. will likely want to see stronger inflation numbers before pressing the rate trigger.
UK Prime Minister Theresa May Changes Stance and Calls for Snap Election
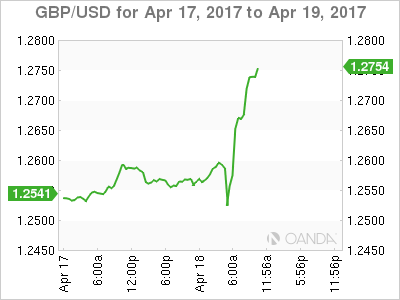
Are world leaders nowadays keen on breaking their own promises? Just days after Donald Trump's reversal of campaign pledge to label China as "currency manipulator", UK PM Theresa May announced that she would seek MPs' support for an early general election to be held on June 8. The news came in less than a month after her affirmation that "the next election will be in 2020". GBPUSD erased earlier losses and jumped to a 4.5-month high of 1.2755 after the announcement, on expectations that a landslide victory of the Conservative Party would strengthen May's mandate in the 2-year Brexit negotiations. FTSE100 has remained under pressure after slumping to the lowest level in 2 months, amidst heightened political uncertainty and a rally in sterling. While we do not rule out the possibility of near-term sterling strength, as traders priced in a Conservative victory in the snap election, we remain bearish on the currency's longer term outlook as the tough Brexit negotiations return to the spotlight.
The next UK general election was initially scheduled to be held on May 7, 2020. Yet, a snap election can be called if two thirds of MPs vote to hold it or if there is a no confidence vote in the government. Supports from Labor and LibDem signal that the motion should be passed in the parliament. May's rationale of such move is to consolidate her power after Brexit was formally triggered in late March. As she noted, "at this moment of enormous national significance, there should be unity in Westminster, but instead there is division". She added that "Labour have threatened to vote against the final agreement we reached with the European Union" in recent weeks.
Both May and the market appear confident that the election outcome would serve its purpose. Opinion polls have been suggesting that support for Conservatives almost doubles that of Labor. Survey by Yougov/Times on April 12-13 on voting intention shows 44% support for Conservatives, up +2 percentage points from the prior week on 44%, while that for Labor slipped +2 percentage points to 23%,the lowest for the party since June 2009. Support for LibDem stayed at low teen.
Meanwhile, 50% of interviewees indicated that Theresa May would make the best PM Minister, compared with 14% for Labor's Jeremy Corbyn.
Sterling's volatility would remain elevated from now until the election. Yet, short-term rebound does not change our bearish view over the currency as the tough Brexit negotiations return to the spotlight. For the impacts of Brexit on GBP, please refer to: https://www.actionforex.com/action-insight/special-topics/98-fx-2017-gbp-brexit-uncertainty-haunting
U.K Snap Election Pound Positive, More to Follow
The Pound is on the rise in volatile trading this Tuesday morning after U.K's PM Theresa May called a snap general election for June 8 ahead of the U.S open.
Sterling is currently trading up +1.5% at £1.2755 outright, after falling as much as -0.3% (£1.2527) ahead of the 06:15 EST announcement.
Up until now, political uncertainty has weighed heavily on the pound since the Brexit referendum, losing as much as -15% against a basket of currencies.
In 2017, sterling has managed to stabilize for the best part as the U.K economy defies the worst of post-Brexit predictions.
For investors, the currency in now entering into the zone of last December high territory (£1.2775-1.2800), which many consider the defying "line in the sand."
There are a number of reasons why GBP bulls believe that a 'big' double bottom or even triple may have been recorded.
Mandate for May
Winning a snap general election will give PM Theresa May both a wider and stronger mandate to shape Britain's E.U divorce.
The PM was an originally in the "remain" camp and if need be, having more control would allow her to pursue a 'softer' Brexit agenda, something closer to her beliefs.
Boris Johnson
On entering Downing Street, the PM had to be rather agile. She manoeuvred out a number of 'hard' Brexit supporters (Osborne, Grove), but appointed Boris to appease her critics of a possible 'soft' Brexit. With a clear mandate she would have the opportunity to dispense of his services.
UKIP No Show
It was Nigel Farage and company who pressured former PM Cameron to hold the E.U Referendum. With the UKIP party currently in such disarray, a snap election offers little threat for a 'hard' Brexit.
Labor to be Defeated
Current polls shows the Conservatives having a +19 point lead over Labour and PM May obviously deems this the best time to defeat Jeremy Corbyn. Net result should be market-friendly regardless of Brexit.
Pound Soars as Theresa May Calls Surprise Election
GBP/USD has jumped on Tuesday, gaining close to 200 points. In North American trade, GBP/USD is trading at 1.2740. The pound has climbed after Prime Minister Theresa May surprised the markets by calling an election for June 8. On the economic front, US construction numbers were mixed. Building Permits improved to 1.26 million, edging above the forecast of 1.25 million. Housing Starts dropped to 1.22 million, shy of the forecast of 1.25 million.
The pound started the week quietly, as British markets were closed for Easter Monday. However, the currency has jumped to an 18-week high after Prime Minister May announced that the country would go to the polls. Why did May decide to seek a fresh mandate now? One reason is that she is enjoying a huge lead in the polls, and could improve on her thin majority in parliament. As well, her government has run into difficulties with the opposition and the House of Lords over Brexit, and hopes that the election results will strengthen her hand as she prepares for the unenviable task of negotiating Britain's departure from the European Union. In announcing the snap election, May said she was reluctant to call an election (some three years ahead of schedule), but that the country needed stability and certainty ahead of the difficult negotiations with Europe.
In the US, consumer indicators wrapped up last week on a sour note. CPI declined 0.3%, and Core CPI dropped 0.1%, as both indicators missed their estimates. Consumer spending was no better, as Retail Sales and Core Retail Sales also missed estimates with readings of 0.2% and 0.0%, respectively. Earlier in the week, UoM Consumer Sentiment improved to 98.0, beating expectations and hitting a 3-month high.What is unusual is this data is that consumer confidence levels improved in March, yet consumer spending declined. The US consumer behavior continues to be marked by a "hard/soft discrepancy", as confidence levels ("soft data"), has not translated into actual spending numbers ("hard data"). The odds of a June rate hike from the Fed has fallen to 46%, down from 64% earlier in April. Janet Yellen & C0. will likely want to see stronger inflation numbers before pressing the rate trigger.
Elliott Wave Analysis: EURUSD May Be In For A Turning Point Around 1.0690/1.0700
EURUSD is making a nice move up to 1.0690/1.0700 area where upside can be limited as we see pair in wave c now, final stages of a complex corrective price action. However a turn down should be seen back below 1.0650 to confirm bearish price moves ahead.
EURUSD, 1H
Brexit Monitor: Snap Election Increases Number of Uncertainty Factors
PM May wants to hold snap election on 8 June
Very surprisingly, PM Theresa May has announced she wants a snap election on 8 June, as the other political parties (and 'unelected members of the House of Lords') oppose the government's Brexit plan. Holding an election now exploits the fact that the serious part of the Brexit negotiations will not start until after the German election in September and it means that the new term will cover both the Brexit negotiations and probably also the transitional phase after April 2019+. Due to the fixed-term elections system, PM May needs a two-thirds majority of the Commons to call for a snap election, see also Wikipedia. Tomorrow PM May will move a motion in the House of Commons calling for a general election. We think it is likely that most parties will support the motion. In her statement, PM Theresa May repeated that Brexit is going to happen and 'there can be no turning back'.
Based on the most recent opinion poll, the Conservative lead is +21pp over Labour, see chart below. Due to the UK's 'first past the post' system, this means that the Conservatives will likely increase their majority lead in the Commons. If the opinion polls are right, this means that PM Theresa May will be less vulnerable in the Brexit negotiations, as the result would consolidate her power within the Conservative party (both against 'hard Brexiters' and 'Bremainers'). That said, one should be cautious relying too heavily on the opinion polls, as they have been quiet, which may also change through the election campaign.

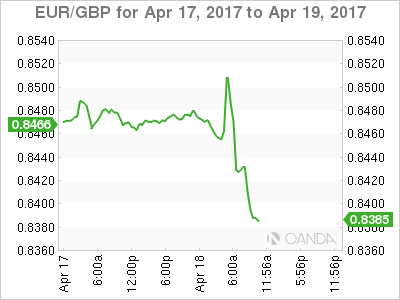
EUR/GBP traded lower on the election announcement and given that very short non-commercial GBP positioning, EUR/GBP could decline further in the very near term driven by short covering caused by higher uncertainty. As such, a new test, and potentially a break of the post Brexit lows around 0.83 should not be ruled out. Short-term, the general election means there is one more uncertainty factor for GBP, as the sample space for UK-EU relations have suddenly widened again with notably a chance now that Brexit may be softened (or cancelled altogether should the May government be ousted). Given May's lead in the polls the most likely outcome is that she will receive the more broad-based backing she is seeking heading into the negotiations on Brexit, due to start for real post the German election in the autumn. Our base case remains that May will stay in power and negotiate a 'decent Brexit' (neither too hard nor too soft), but the probability of other outcomes has clearly risen with today's election call. Hence, in our main scenario that May resumes negotiations EUR/GBP should be in for a level shift higher post a June election.
