Sample Category Title
European Open Briefing: Asian Stock Markets Came Under Pressure Again
Global Markets:
- Asian stock markets: Nikkei down 0.15 %, Shanghai Composite lost 1.05 %, Hang Seng declined 0.80 %, ASX 200 fell 0.75 %
- Commodities: Gold at $1288 (-0.45 %), Silver at $18.23 (-0.25 %), WTI Oil at $52.30 (-0.20 %), Brent Oil at $54.80 (-0.20 %)
- Rates: US 10-year yield at 2.18, UK 10-year yield at 1.01, German 10-year yield at 0.16
News & Data:
- Australia Westpac Leading Index (MoM) (Mar): 0.08 (prev -0.07)
- New Zealand Performance of Services (Mar): 59.0 (prev rev to 58.7 from 58.8)
- Sterling gets market's vote, stocks cold shouldered
- Asia Stocks Slide After Brief Show of Resistance – BBG
- Japan 10-Year Yield Drops to Zero for First Time in Five Months – RTRS
Markets Update:
Asian stock markets came under pressure again, with most major indices down on the day. The Shanghai Composite lost more than 1 %. Meanwhile, Gold remained steady around $1290. The metal regained some strength after the Dollar weakened broadly yesterday.
After heavy losses yesterday, the Dollar managed to recover slightly in Asia. The British Pound remained bid nevertheless. The market was caught by surprise after UK PM May announced an election in June. GBP/USD jumped from 1.25 to 1.27, and later extended gains above 1.29. Short positioning has been at a record high last week according to the CFTC, so it is clearly a short squeeze.
Despite the Dollar weakness, the commodity currencies failed to benefit from it. The Australian Dollar consolidated around 0.7550 and overnight it fell back towards 0.7525 support. Given the low risk appetite, the outlook for the AUD remains negative.
Upcoming Events:
- 10:00 GMT – Euro Zone CPI
- 10:00 GMT – Euro Zone Trade Balance
- 15:30 GMT – US Crude Oil Inventories
- 23:45 GMT – New Zealand CPI
Elliott Wave View: Gold Pullback Ending
>
Short term Elliott Wave view in Gold (XAUUSD) suggests that cycle from 4/10 low (1246.92) is unfolded as an impulse Elliott wave structure where Minutte wave ((i)) ended at 1257.2, Minutte wave (ii) ended at 1250.8, Minutte wave (iii) ended at 1279.75, Minutte wave (iv) ended at 1271.69 and Minutte wave (v) of (a) ended at 1295.6 peak. Below from there metal could have finished correcting the 4/10 cycle (1246) in Minutte wave (b) pullback as 11 swings Triple three structure within the blue box area at yesterday’s low 1278.68, while above from there and as far as pivot from 1246 low remains intact metal has scope to resume the rally in Minutte wave (c). However metal still needs to see a clear break of 1295.6 peak first for final confirmation for next leg higher, above from 1278.68 low Minutte wave (i) ended at 1292.12 peak and Minutte wave (ii) is remains in progress & expected to end above 1278.68 low for continuation higher. If it manages to break 1278.68 low from here then metal could see 1275.38-1271.33 area next as double correction before resuming higher again. We don’t like selling the metal and favors keep buying dips in 3, 7 or 11 swings as far as pivot from 4/10 low remains intact.
Gold 1 Hour Elliott Wave Chart
Market Morning Briefing: A Shock Election Call By The UK PM Has Not Only Strengthened
STOCKS
US-North Korea tensions, nearing of the French elections and the news of the UK SNAP elections on June 8th are adding on to the news list keeping the global indices low. European stocks have seen a sharp fall yesterday and may not rise back immediately. Dax (12000.44, -0.90%) may test initial support at 11930 which if fails to produce a bounce could take it to lower levels of 11800 in the near term.
Dow (20523.28, -0.55%) is holding above support of 20410 and while that holds, we could see some movement in the 20780-20410 region in the coming sessions. Only on a break below 20410 (if seen in the near term) can shift our focus to further downside levels.
Shanghai (3161.85, -1.09%) fell sharply breaking below the 3175 support mentioned yesterday. Either the index could bounce back from current levels or test lower supports near 3100.
Nikkei (18417.54, -0.01%) may trade within 18650-18230 zone for the next couple of sessions and if a break below 18230 is seen we may see a test of 18000 before a sharp recovery on the upside.
Nifty (9105.15, -0.37%) fell sharply from an intra-day high of 9217 yesterday. Note important support zone of 9000-8900 on the downside on a break below 9100. We could allow for a possible fall towards 8900 as an extension to the current corrective fall.
COMMODITIES
Notinh new to add. Gold (1288) has closed at slightly higher from its yedtreday’s close and hovering around its crucial resistance of 1305. We continue to look for a bounce beyond 1305 levels in the near term. But before that gold may spend a few sessions within the 1265-1305 regions to overcome its near term overbought condition.
Silver (18.23) closed below its support at 18.30. We might see 17.70 within few days of time and we will remain bearish while it is trading below 18.30 levels.
Copper (2.55), as per our expectations, has moved lower near 2.51 yesterday,inspite of Dollar weakness and as long it stays below 2.62, the chances of another dip to 2.48 or even 2.42 within next week can’t be ruled out.
Brent (54.76) and WTI (52.30) have fallen from their resistance levels of 55.20 and 53 and trading within the range of 53.60-55.20 for Brent and 51.70-53 for WTI respectively. The trend is still bullish in the near to medium term time frame and any corrective fall may face buying pressure at the lower levels. We have EIA Crude oil weekly inventory data today at 8.00 p.m with an expectation of a decrese of -1.0M barrels. Only a surprise rise / lower than expected decrese in U.S. drilling activity could keep a lid on the bullish momentum and could open up 52.50 levels for brent and 50 levels for WTI as well.
FOREX
A shock election call by the UK PM has not only strengthened Pound but boosted almost all the majors against Dollar.
Inability to rise above 100.70-85 pushed down Dollar Index (99.62) below the support of 99.80 and now it may test the next major support near 99.20-10 from where a recovery to 100.20-50 levels can be expected.
Euro (1.0720) has broken the near term range of 1.0550-1.0700 to the higher side and now may rise further to 1.0780-1.0830 if the rise sustains after the release of the Euro CPI data today.
Dollar Yen (108.49) is stuck between the support of 108.25-00 and the resistance of 109.25-40 discussed yesterday. The chances of a bounce back can’t be ruled out as long as the pair remains above 107.85. in case 107.85 fails to hold, much deeper downside may open but that is not the preferred view.
The larger timeframe bullishness in Pound (1.2565) discussed for the last two days has taken hold now and our initial target of 1.28 is achieved in a single session. If it manages to sustain above 1.29 in the next few sessions, then much higher target of 1.33 may open up but that may take time.
Aussie (0.7529) is testing the support of 0.7525 which must hold to keep the upside chances for 0.7640-75 open. A failure of 0.7525 may extend the decline to lower support near 0.7470-50 but for now, the upside chances still survive.
Dollar-Rupee (64.63) is trading flat in the NDF despite the major moves in the global markets. For an extension of the rise to 65.00-20, a break above 64.70 is required as a confirmation. Otherwise, it may keep oscillating in the range of 64.20-70.
INTEREST RATES
The US yields are falling. The 5yr (1.71%), 10yr (2.18%) and the 30Yr (2.85%) are down from 1.20%, 1.76% and 2.23% respectively but are testing decent support near current levels. We will have to see the price action here to see if there is scope of a bounce in the coming sessions.
The German yields are falling and headed towards near term support levels from where a bounce is expected in the near term.
The German-US 2Yr (-2.04%) and the 10Yr (-2.01%) are trading just below immediate resistances and could come off in the next couple of sessions. The Euro CPI data release today is to be watched. Upside for Euro seems limited for the near term.
The UK yields have bounced slightly but look bearish for the coming sessions. The 5Yr (0.489%), 10yr (1.004%) and the 20Yr (1.553%) are up from 0.477%, 1.003% and 1.5490% respectively.
The UK 10-5 Yr (0.5150%) is headed towards 0.40% in the medium term.
GBP/USD Rockets Higher as British PM Theresa May Calls Election
GBP/USD rocketed higher after British Prime Minister Theresa May shocked markets by first making an unscheduled announcement and then calling a June 8 election.
Prime Minister May alerted the people that she has recently and reluctantly come to the decision that it is in the national interest that an election must be called at this time. This of course follows what can only be described as a bitter 12 months of political bickering between the left and right following the Brexit referendum vote.
"Division in Westminster will risk our ability to make a success of Brexit. …so we need a general election and we need one now."
"Our opponents believe because the government's majority is so small, that our resolve will weaken and that they can force us to change course."
As you can see from some of these key Theresa May quotes as she called for the election, in her eyes this is about trying to gain political stability.
But what about market stability?
Well, we've been watching a higher time frame, 800 or so pip range and an internal GBP/USD wedge. The post-Brexit drop range is pretty straightforward and as such is a lot more important than a short term wedge that I've re-drawn to match actual market movements since.
GBP/USD Daily:
The GBP/USD range is clear as day on the daily chart and for me, the breakout and close above is the most important technical aspect of last night's election announcement.
GBP/USD 4 Hourly:
Zooming into an intraday chart, you can really see the move higher that the news caused.
Price is no doubt going to pullback from here because when you actually stop and think about it fundamentally, this isn't a GBP positive no brainer like that sort of move higher might suggest.
How price reacts when it retests the top of the previous range resistance as possible support is going to be the key battleground and a great spot for us day traders to manage our risk around.
Cable Soars on UK Snap Election
The UK vote was only just announced but the market already cast a definitive vote for Theresa May in a huge GBP rally Tuesday. The pound was the top performer while the Canadian dollar lagged. A light Asia-Pacific calendar will give markets an opportunity to digest the big moves. The previous GBP short was stopped out. 7 out of the 9 existing trades are in profit, alongside the short FTSE-100. 1 trade missed the fill by 8 pips, awaits.
Cable soared to 1.29 from as low as 1.2520 in a perfect storm of news, positioning and technicals on Tuesday. The news was a June 8 snap UK election. With polls showing May's party +20 points ahead and the opposition in disarray, she seized the opportunity to cement her position with a strong mandate. The market is already seeing a May win as a sure thing and is implying it will improve her negotiating position.
In terms of positioning, we have warned for weeks that GBP shorts are dangerously overcrowded. Last week's CFTC data showed cable net shorts were near a record with almost have of the position already underwater. The rally Tuesday was no doubt helped by a squeeze but we're confident there are many more GBP positions to be picked off.
Technically, the rally cascaded through multiple levels. The March high and 200-dma were the first to go, followed by the February high and finally the December high of 1.2775. Shortly after it broke, the pair went into overdrive in a flash trade up to the highs of the day.
Ashraf looks ahead to what's next with his latest Premium trade.
Not to be lost in all the focus on the UK, the Treasury market continues to rally. US 10-year yields fell another 8 bps to 2.17%. While the election story is domestic, we believe the failure of the reflation trade is a global theme with broader consequences. It also raises the stakes for incoming inflation data.
Risk Abound
In the UK, Prime Minister Theresa May announced she would seek an early election on June 8. Either a bold move, or well disguised or ruthless, call it what you "May", but from the brink of resignation to calling a snap election, it has the market voting with two thumbs up.
With a 20 point lead over the Labour Party, which is currently in a shambles, in a cunning gambler move, Theresa May is looking to cement her party's leadership and all but eliminate any opposition to Brexit in the Commons by securing the conservatives more seats, if recent polls hold. Apparently, the markets take on this gutsy move is that this will lessen the likelihood of an unruly Brexit, as the Tory house of cards will be better aligned. At the same time, it could become less dependent on the periphery elements within her party, or even the opposition.
On the Geopolitical front, rumours have been circulating that the US military is considering shooting down North Korean missile tests as a show of strength to Pyongyang. I discount these types of reports as little more than militaristic hyperbole and are likely no more than a what if scenario. While I suspect the worst of the Geo risk is behind us, we are still ways away from closing the chapter on Korean Peninsula risk.
On the US data front, the Greenback took on the chin as a combination of tepid earnings and faltering US manufacturing output weighed on investor confidence as the US economic growth scenario wobbles. The USD dollar bulls are being held at bay due to geopolitical risk, so short term traders are seizing the moment in opportunistic fashion on any US economic data miss.
If one is looking for any positivity in this sea of negativity, the IMF has nudged it, by upping its forecast for global growth in 2017 by one tenth to 3.5%.
Australian Dollar
The AUD traded off its back foot most of the overnight session after the RBA fleshed out a more dispirited economic outlook than the market was expecting. While domestic macro concerns percolate, the biggest driver for the Australian dollar will be US interest rates, commodity prices and global risk.
The Aussie dollar overnight slide was buffeted by the weaker US economic data overnight, but iron ore prices slipped again, among growing concerns that oversupply in China poses a risk to prices over the next quarter.
Market risk is likely to take another leg lower on the back of geopolitical sentiment, and with both copper and iron ore reeling, we should expect the AUD to remain under pressure in the near term. Perhaps more so if we factor in a downbeat central banker, which was the primary catalyst for a move lower on the AUD yesterday.
Japanese Yen
The JPY remains extremely sensitive to geopolitical headlines, and the USDJPY pair continues to be the go-to pair to express a weaker USD bias. With both a high sensitivity to both risk and US economic data, the current climate suggests the path of least resistance remains lower for USDJPY with any uptick likely to be faded quickly. But this is not clear sailing, as one must be prepared for constant unwinding the unwind, as headline risk should dominate for the foreseeable future.
Euro
The euro has remained remarkably buoyant this week despite the looming round one of the French election. The currency has traded all week constructively with the market showing little sign of clambering for euro hedges this week, which is an indication that the market is either comfortably hedged or have discounted any shocks.
Now that the GBP is soaring on PM May's election gamble, the euro has been towed along by a soaring Cable.
EM FX
Expectedly, emerging markets performances were mixed overnight with TRY the best performer of the lot
Turkish Lira
The Turkish Lira has been relatively stable this year and the Turkish Central Bank will likely to keep interest rates high for the foreseeable future, so as not to rock the Lira's boat. Given the TRY extremely high yield, the carry trade appeal should remain robust for the foreseeable future. Fitch's positivity that, "Turkey's constitutional referendum is part of a political shift that has been negative for the country's sovereign credit profile, but may facilitate a revival of credit-positive economic reforms" has calmed investors nerves post-referendum.
Korean Won
Geopolitical concerns continue to weigh on the Won, but as the worst of the geopolitical storm likely behind us, the KRW is still widely acknowledged as undervalued over other ASEAN currencies, so there will be opportunistic headline buying, as regional risk shows signs of abating. In the meantime expect the USDKRW to remain bid on dips until the geopolitical storms abate.
Oil
Oil prices were choppy overnight as the WTI bounced eccentrically between 52-53 per barrel. A tug of war ensued among dealers, who are evenly divided between climbing US production, rising inventories and forecasts calling for demand to exceed supply by Q4.
Gold Moves Close to $1300 as North Korean Crisis Continues
Gold has posted gains on Tuesday, erasing most of the losses which marked the Monday session. In North American trade, gold is trading at $1289.78 per ounce. On the release front, US construction numbers were a mixed bag. Building Permits improved to 1.26 million, edging above the forecast of 1.25 million. Housing Starts dropped to 1.22 million, shy of the forecast of 1.25 million.
Geopolitical jitters continue to weigh on the markets, which has been good news for safe-haven gold. North Korea has been a flash-point in recent weeks, as the war of words between the US and North Korea has escalated, with North Korea warning it will respond with a nuclear strike if attacked by the US. The crisis has triggered strong movement towards gold, which has jumped 3.4% in April. On Tuesday, US vice-president Mike Pence, who is holding talks with Japanese leaders in Japan, said that the US is committed in its support of Japan and South Korea against aggression from North Korea. If the crisis with North Korea continues, gold prices could push higher and cross the symbolic $1300 level.
US March consumer indicators, released on Friday, were softer than expected. CPI declined 0.3%, and Core CPI dropped 0.1%, as both indicators missed their estimates. Consumer spending followed suit, as Retail Sales and Core Retail Sales also missed estimates with readings of 0.2% and 0.0%, respectively. Earlier in the week, UoM Consumer Sentiment improved to 98.0, beating expectations and hitting a 3-month high.What is unusual is this data is that consumer confidence levels improved in March, yet consumer spending declined. The US consumer behavior continues to be marked by a "hard/soft discrepancy", as confidence levels ("soft data"), has not translated into actual spending numbers ("hard data"). The odds of a June rate hike from the Fed has fallen to 46%, down from 64% earlier in April. Janet Yellen & C0. will likely want to see stronger inflation numbers before pressing the rate trigger.
Elliott Wave Trade Ideas Performance Update
Although aussie did rebound after finding support at 0.7473 (we entered a long position earlier at 0.7525), the pair met resistance at 0.7611 and has retreated, the position was then exited at 0.7555 with small profit.
A short position was entered in USD/CAD at 1.3320, however, as the greenback found decent demand at 1.3262 yesterday and staged a strong rebound, we exited the position at 1.3360.
No position was entered among other currency pairs.
In short, 2 positions were entered with total loss of 10 points and the positions are listed below.
7 Apr : AUD/USD - Long at 0.7525, exited at 0.7555 (+ 30 points)
18 Apr : USD/CAD - Short at 1.3320, exited at 1.3360 (- 40 points)
| AUD EUR/JPY EUR/GBP CAD
Jan - 15 -275 - 35 -120
Feb + 140 -17 - 40 +11
Mar - 20 +115 +132 - 19
Apr + 30 - 40
May
Jun
Jul
Aug
Sep
Oct
Nov
Dec
Y-T-D + 135 - 177 + 57 - 2
Candlesticks and Ichimoku Trade Ideas Performance Update
We ventured long in USD/JPY at 110.60 early last week, however, active cross-buying in yen continue putting pressure on the greenback, dollar has continued heading south, the position was stopped at 110.25, price then fell to as low as 108.13 yesterday before recovering.
A short position was entered in cable at 1.2475 but in view of the strong rebound from 1.2365, we quickly exited the position at 1.2480 and sterling then surged to 1.2575 last week and later above 1.2700 level today.
Another short position was entered in euro at 1.0665, although the pair met resistance at 1.0678 and retreated, renewed buying interest emerged just above 1.0600 level and the pair has rebounded again on back of the rally in sterling, the position was stopped at 1.0675 and price rose to 1.0700.
In short, 3 positions were entered among all 4 currency pairs with total loss of 50 points and the positions are listed below:
11 Apr : USD/JPY - Long at 110.60, exited at 110.25 (- 35 points)
11 Apr : GBP/USD - Short at 1.2475, exited at 1.2480 (- 5 points)
13 Apr : EUR/USD - Short at 1.0665, exited at 1.0675 (- 10 points)
| JPY EUR CHF GBP
Jan + 167 - 85 - 10 + 50
Feb + 200 +150 +93 - 59
Mar -23 -70 -23 - 35
Apr - 35 -10 - 40
May
Jun
Jul
Aug
Sep
Oct
Nov
Dec
Y-T-D + 308 - 20 +60 -84
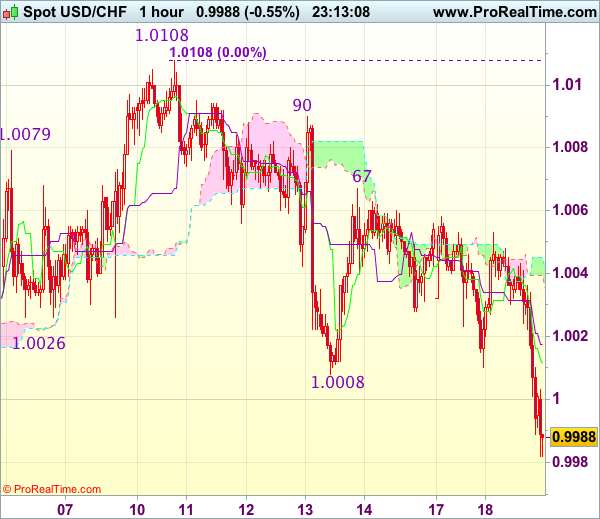
Trade Idea Wrap-up: USD/CHF – Hold short entered at 1.0000
USD/CHF - 0.9985
Most recent candlesticks pattern : N/A
Trend : Near term down
Tenkan-Sen level : 1.0012
Kijun-Sen level : 1.0018
Ichimoku cloud top : 1.0045
Ichimoku cloud bottom : 1.0039
Original strategy :
Sold at 1.0000, Target: 0.9900, Stop: 1.0035
Position : - Short at 1.0000
Target : - 0.9900
Stop : - 1.0035
New strategy :
Hold short entered at 1.0000, Target: 0.9900, Stop: 1.0035
Position : - Short at 1.0000
Target : - 0.9900
Stop : - 1.0035
Current breach of support at 1.0008 signals top has been formed at 1.0108 last week and consolidation with downside bias is seen for further fall to 0.9960-67 (50% Fibonacci retracement of 0.9813-1.0108 and 100% projection of 1.0108-1.0008 measuring from 1.0067), however, reckon downside would be limited to 0.9943-48 (1.236 times projection and previous support) and 0.9926 (61.8% Fibonacci retracement) would hold, bring rebound later.
In view of this, we are holding on to our short position entered at 1.0000. Above the Kijun-Sen (now at 1.0017) would defer and risk rebound to 1.0040-45 but break of resistance at 1.0067 is needed to signal low is formed, bring test of key resistance at 1.0090 first.