
Sample Category Title
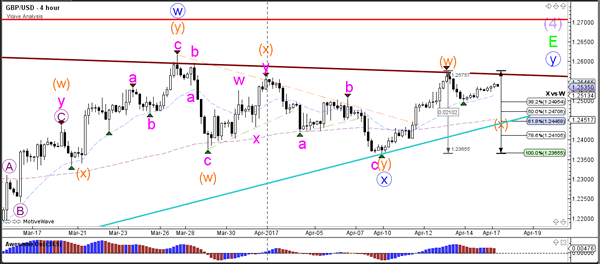
GBP/USD Final Pieces of Contracting Triangle Built around 1.25
GBP/USD
4 hour
The GBP/USD bearish bounce at resistance (brown) confirmed wave W (orange) and price has retraced back to the 38.2% Fibonacci support level of wave W vs X (orange). Price is moving between support (blue) and resistance (brown) and could be close to completing a chart triangle indicated by wave E (green).
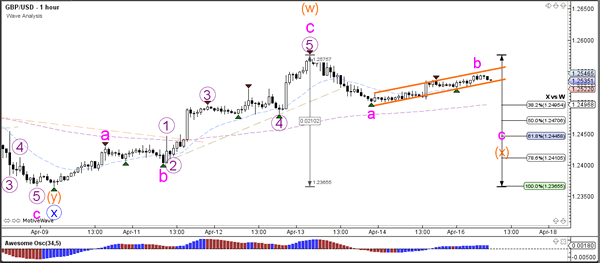
1 hour
The GBP/USD could extend the wave X (orange) with a new ABC (pink) zigzag that could take price back down to the support trend line (blue). Price would need to break below the bear flag to confirm the correction (orange lines).
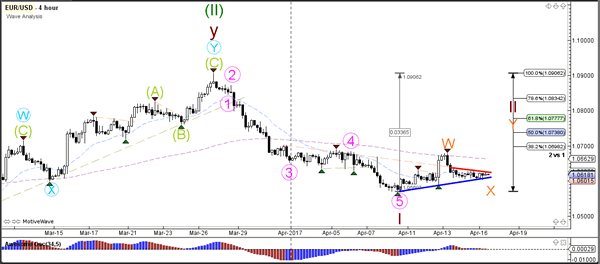
EUR/USD
4 hour
The EUR/USD is challenging the bullish support trend line (blue). A bounce at this level plus break above the smaller resistance line (red) could see a larger retracement within wave 2 vs 1 (green).
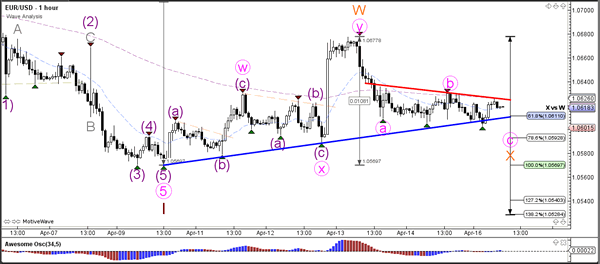
1 hour
The EUR/USD completed a wave Y (pink) correction, which in turn could lead to a larger WXY (orange) within wave 2 (green). The wave X (orange) stays valid as long as price stays above the 138.2% Fibonacci level of wave X vs W.
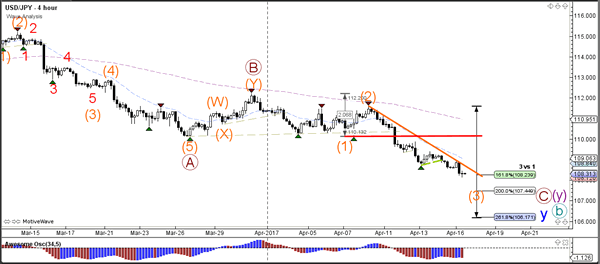
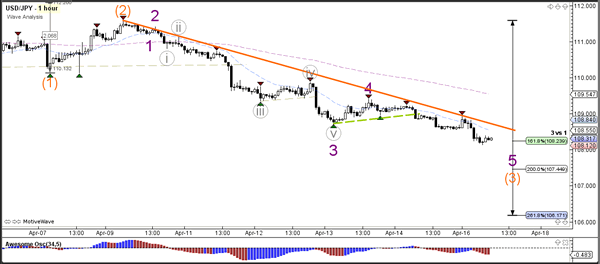
USD/JPY
4 hour
The USD/JPY made a bearish breakout below 108.50 which makes it more likely that price is in a wave B (green). A wave 3 (orange) bearish momentum seems to be taking place as price reaches the 161.8% Fibonacci target. Once the wave 3 has been completed and the potential wave 4 starts, price cannot retrace above the bottom of wave 1 (red line) without invalidating it.
1 hour
The USD/JPY broke the bear flag (dotted green) chart pattern and seems to be building a wave 5 (purple) within wave 3 (orange).
EUR/JPY Bearish Zig Zag Within Equidistant Channel
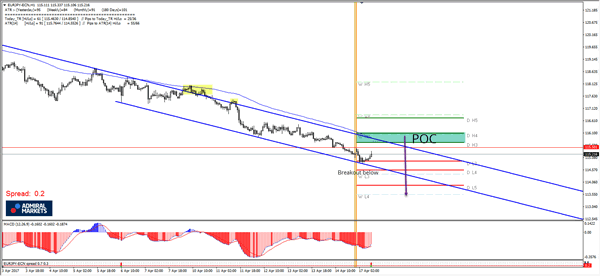
Bank holidays are usually days when low volatility is expected. Yen pairs tend to move with equities, especially Nikkei, so we have seen some volatility in the Yen during the Asia session. The POC for EUR/JPY comes within 115.75-95 (EQ channel top, ATR high, W H3, EMA89) and should reject the price. Targets are 114.55 and 113.90. If we don't see any retracement in the pair, a breakout below W L3 114.35 should also aim for 113.90, which is D L5 - the strongest intraday support.
North Korea Still in Focus after Failed Missile Launch; USD Extending Decline on Low US CPI
Friday US Session Highlights
- (US) MAR CPI M/M: -0.3% V 0.0%E; CPI EX FOOD AND ENERGY M/M: -0.1% V +0.2%E; MAR CPI INDEX NSA: 243.801 V 244.237E
- (US) FEB BUSINESS INVENTORIES: 0.3% V 0.3%E
- (US) MAR ADVANCE RETAIL SALES M/M: -0.2% V -0.2%E (2nd straight decline); RETAIL SALES EX AUTO M/M:0.0 % V 0.1%E
- Friday US markets were closed
Politics
- (TR) Turkey Passes referendum on changing the constitution to replace its parliamentary system with the executive presidency with 51.5% v 48.7%; opposition to challenge result
- (FR) France presidential candidate Mélenchon (far left, communist) is rapidly rising in the polls - press
- (US) Pres Trump expected to name Randy Quarles as Federal Reserve's top bank regulator - Politico
- (JP) Japan PM Abe's cabinet approval rating rises 4pts to 60% - Yomiuri
Weekend US/EU Corporate Headlines
- MGI: Ant Financial raises offer price ~36% to $18.00/shr from $13.25/shr to acquire MoneyGram
- AMZN: Said to be interested in BJ's Wholesale, who is putting itself up for sale - NY Post
Key economic data:
- (CN) CHINA Q1 GDP Q/Q: 1.3% (1-year low) V 1.5%E; Y/Y: 6.9% (6-quarter high) V 6.8%E
- (CN) CHINA MAR RETAIL SALES Y/Y: 10.9% (3-month high) V 9.7%E; YTD Y/Y: 10.0% V 9.6%E
- (CN) CHINA MAR INDUSTRIAL PRODUCTION Y/Y: 7.6% (highest since Dec 2014) V 6.3%E; YTD 6.8% V 6.3%E
- (CN) CHINA MAR FIXED ASSETS EX RURAL YTD Y/Y: 9.2% (10-month high) V 8.8%E
- (CN) CHINA MAR M2 MONEY SUPPY Y/Y: 10.6% V 11.1%E; 8-month low
- (CN) CHINA MAR NEW YUAN LOANS (CNY): 1.02T V 1.20TE; 4-month low
- (CN) CHINA MAR AGGREGATE FINANCING (CNY): 2.120T V 1.50TE
Asia Session Notable Observations, Speakers and Press
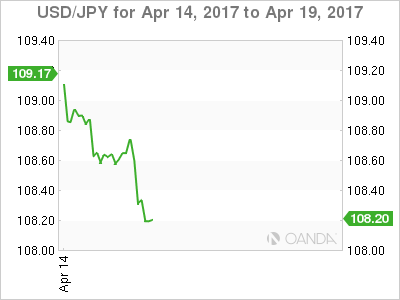
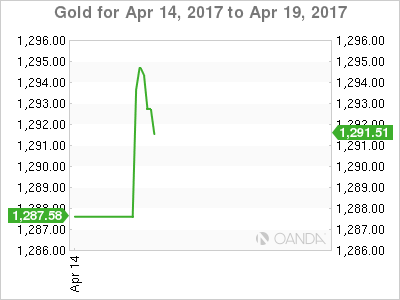
- Asian equity markets are mixed in light trade, with Australia and Hong Kong remaining closed for Easter holidays. Nikkei225 is little changed despite continued strength in JPY, as USD/JPY fell to fresh 5-month lows below 108.20 following softer than expected US CPI on Friday. USD weakness was also more pronounced against NZD, as New Zealand fundamentals justify expectations of RBNZ tracking the Fed tightening pace down the line. Gold prices rose some $7 above $1,295, tracking weaker USD, while US Treasury yield was seen testing 2.20% level.
- China economic data offered some positive surprises, as Q1 GDP, industrial output, and retail sales all topped consensus to hit multi-month rates of growth. Q1 GDP y/y rose to a 6-quarter high of 6.9%, and Stats Bureau noted Consumption accounting for 77.2% of Q1 growth, up from 64.6% in 2016. Fixed asset investment rose over 10% as property investment value rose 9%, sales value rose 25%, construction up 11%, and home sales aresa rose 17%. Industrial output growth was similarly impressive, rising at the fastest pace since late 2014 - power generation was up 7%, while coal and steel output were both up 2% despite the recent production curbs. NBS further noted that employment was stable, but also warned that structural problems remain an issue and property sales growth could start to slow as govt curbs impact is felt.
- Situation on the Korean peninsula remains tense even though there was no activity at the nuclear test site over the weekend. Instead, Pyongyang held a military parade commemorating 105th birthday of North Korea founder and also attempted to launch another missile test which reportedly failed. In the mean time, National Security Advisor McMaster remarked that US is working with China and other partners on a range of responses that will not include a military action at this, though VP Pence travelling in the region said all options are still on the table. US carrier USS Vinson is also reportedly about a week away from arriving to South Korea's east coast.
- Turkish Lira rallied over 2% in the wake of this weekends referendum to expand the executive powers of Pres Erdogan; While the "Yes" vote was deemed victorious, the margin of victory at 51.3% v 48.7% opposed was well below the 55% mandate predicted by Erdogan and will likely be challenged by the opposition. Under upcoming constitutional changes, the winner of 2019 elections will in effect assume full control of the government, ending the current parliamentary system which treated office of the president as a role without full executive authority.
China
- (CN) China Stats Bureau: Domestic structural problems remain relatively striking
- (CN) PBoC adviser Fan Gang: China FX reserves may decline further - Chinese press
- (CN) China to take steps to boost domestic demand this year - Chinese press
- (CN) China Securities Regulatory Commission (CSRC) approves IPO applications for 10 companies; Will be allowed to raise up to CNY5.1B - Chinese press
- (HK) Trade between mainland China and Hong Kong in Jan-Feb was down 1.5% y/y - Chinese press
Japan
- (JP) Japan Chief Cabinet Sec Suga: No comment on details of US FX report; not intervening into the FX market, committed to G20 agreement on FX policy
- (JP) Japan to seeking to revive Trans-Pacific Partnership (TPP) without the US - Singapore press
- (JP) Japan PM Abe: Need to pressure North Korea for a sincere dialogue; Working for China to play a larger role in North Korea - speaking in parliament
Australia / New Zealand
- (AU) RBA's Harper: Australia economic strength has been the result of good luck and good management; Govt does not make decisions based on rating agency implications - press
Korea
- (KR) North Korea said to have failed in a ballistic missile launch early on Sunday - press
- (KR) US National Security Advisor McMaster: US, China, and allies working on a range of responses to North Korea's latest ballistic missile test; Trump is not considering military action for now - press
- (KR) US carrier USS Vinson to reach South Korea east coast on Apr 25th - Korean press
- (KR) US State Sec Tillerson and China top diplomat Yang Jiechi discussed situation in North Korea in a phonecall on Sunday - Chinese press
- (US) VP Pence: Reiterates all options remain on the table on North Korea
Asian Equity Indices/Futures (00:00ET)
- Nikkei +0.1%, Hang Seng closed, Shanghai Composite -1.3%, ASX200 closed, Kospi +0.4%
- Equity Futures: S&P500 -0.1%; Nasdaq -0.1%, Dax -0.6%, FTSE100 -0.3%
FX ranges/Commodities/Fixed Income (00:00ET)
- EUR 1.0600-1.0630; JPY 108.15-108.80; AUD 0.7570-0.7595; NZD 0.6990-0.7030; GBP 1.2525-1.2545
- June Gold +0.3% at 1,293/oz; May Crude Oil -0.8% at $52.75/brl; May Copper +0.6% at $2.58/lb
- (CN) PBOC SETS YUAN MID POINT AT 6.8785 V 6.8740 PRIOR; 2nd straight weaker setting
- (CN) PBoC conducts CNY495.5B in combined 6-month and 1-yr Medium Term Lending Facility (MLF) operations today
- (CN) PBoC skips reverse repo operations v CNY90B prior in combined 7-day, 14-day, and 28-day reverse repos
- (KR) South Korea MoF sells 10-yr bonds at 2.165% v 2.215% prior
Asia equities / Notables / movers
Japan
- 4587 Peptidream +7.0%; Seen as likely to co-develop drug with major US pharmaceutical
- 6502 Toshiba -0.3%; Broadcom does not want an alliance w/ Japan govt or company if it bids for chip unit
- 6753 Sharp +1.4%; Said to consider returning into IT equipment business in partnership with Hon Hai; Smartphones said to be not part of the plan - Nikkei
China
- 601139 Shenzhen Gas Corporation +1.3%; Guides Q1 Net +5.5% y/y
- 600886 SDIC Power Holdings Co -3.1%; Reports FY16 Net CNY3.9B, -27.8% y/y
- 000036 China Union Holdings +2.3%; Guides Q1 Net higher y/y
Technical Outlook: EURUSD Ticked Higher in Early Monday
The Euro ticked higher in early Monday, supported by the latest polls that tip centrist candidate Macron as likely winner of the first round of French presidential election which are scheduled for the next Sunday, after holding within narrow range in Asia, capped by daily Tenkan-sen (1.0628).
Near-term studies improved on the latest rally which dented next pivot at 1.0647 (double- Fibonacci barrier - Fibo 61.8% of 1.0676/1.0601 and Fibo 23.6% of 1.0905/1.0568), firm break of which is needed to signal reversal and mark higher base at 1.0600 zone, for renewed attempt towards next triggers at 1.0676/1.0700.
However, daily studies remain weak and would keep the downside vulnerable if the price fails to clear 1.0647 pivot.
Tenkan-sen line now reverted to initial support at 1.0628, reinforced by daily cloud top at 1.0620 and session low at 1.0600, break of which would weaken near-term structure and risk test of key supports at 1.0583/68 (daily cloud base / 10 Apr low).
Res: 1.0650; 1.0676; 1.0700; 1.0736
Sup: 1.0628; 1.0620; 1.0601; 1.0583
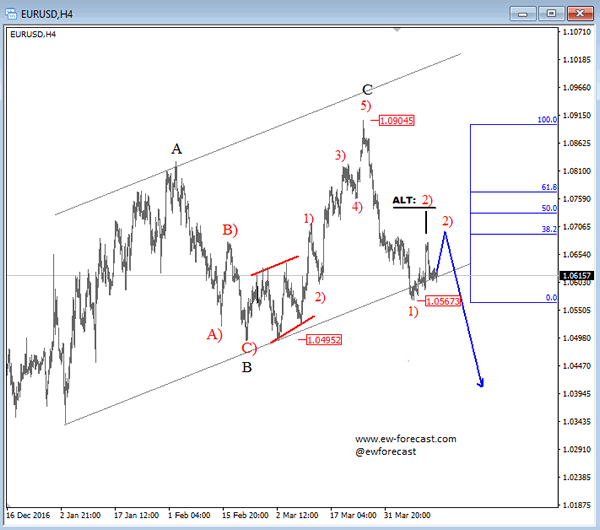
Elliott Wave Analysis: EURUSD Trading In A Bearish Impulse
On the 4h count of EURUSD we see price trading south following a completed zig-zag correction that was in progress since the start of the year. Reversal down is strong and clearly impulsive, thus an important sign of a top in place, meaning a minimum three wave drop is expected to unfold, which should resume after current rally is complete. This rally we see as wave 2) that touched first resistance near 1.0690 but there is room for 1.0740 before bears may step in. Daily close price below 1.0567 will indicate that wave two is finished.
EURUSD, 4H
European Open Briefing: Tensions Between the US and North Korea Keep Traders Worried
Global Markets:
- Asian stock markets: Nikkei down 0.05 %, Shanghai Composite fell 1.30 %, Hang Seng and ASX 200 closed for holiday
- Commodities: Gold at $1292 (+0.30 %), Silver at $18.59 (+0.45 %), WTI Oil at $52.75 (-0.80 %), Brent Oil at $55.45 (-0.80 %)
- Rates: US 10 year yield at 2.21, UK 10 year yield at 1.05, German 10 year yield at 0.19
News & Data:
- China GDP QoQ 1.3 % (exp 1.6 % prev 1.7 %)
- China GDP YoY 6.9 % (exp 6.8 % prev 6.8 %)
- China Industrial Production 7.6 % (exp 6.3 % prev 6.3 %)
- China Retail Sales 10.9 % (exp 9.6 % prev 9.5 %)
- China first-quarter GDP grows faster than expected 6.9 percent, steel output hits record - RTRS
- Japan says it's committed to G20 agreement on forex policy - RTRS
- Dollar hits five-month low vs. yen as North Korea tensions mount - RTRS
CFTC Positioning Data:
- EUR short 19K vs 11K short last week. Shorts increase by 8K
- GBP short 106K vs 100K short last week. Shorts increase by 6K
- JPY short 35K vs 46K short last week. Shorts trimmed by 11K
- CHF short 10K vs 14K short last week. Shorts trimmed by 4K
- CAD short 32K vs 30K short. Shorts increased by 2K
- AUD long 45K vs 50K long. Longs trimmed by 5K
- NZD short 15K vs 15K short last week. No change
Markets Update:
It was another risk-off session overnight, as tensions between the US and North Korea keep traders worried. The Yen appreciated overnight, while the Dollar declined against most other major currencies. Gold rallied to $1295, a fresh 6-month high. Strong resistance is seen at $1300-10 however, and the commodity is looking slightly overbought in the short-term.
Even stronger than expected Chinese data did not help to improve market sentiment. The Shanghai Composite index fell more than one percent overnight. Japan's Nikkei 225 finished the trading day with a loss as well.
Volatility should remain rather low in the upcoming session, as most markets in Europe remain closed for a public holiday. However, US markets will reopen today, so it might pick up again in the afternoon.
Upcoming Events:
- 13:30 GMT - US NY Empire State Manufacturing Index
- 15:00 GMT - US NAHB Housing Market Index
The Week Ahead:
Tuesday, April 18th
- 01:30 GMT - RBA Meeting Minutes
- 13:30 GMT - US Building Permits
- 13:30 GMT - US Housing Starts
- 14:15 GMT - US Industrial Production
- 14:15 GMT - US Manufacturing Production
Wednesday, April 19th
- 10:00 GMT - Euro Zone CPI
- 10:00 GMT - Euro Zone Trade Balance
- 15:30 GMT - US Crude Oil Inventories
- 23:45 GMT - New Zealand CPI
Thursday, April 20th
- 00:50 GMT - Japanese Trade Balance
- 07:00 GMT - German PPI
- 13:30 GMT - US Initial Jobless Claims
- 13:30 GMT - US Philadelphia Fed Manufacturing Index
Friday, April 21st
- 08:00 GMT - French Manufacturing PMI
- 08:00 GMT - French Services PMI
- 08:30 GMT - German Manufacturing PMI
- 08:30 GMT - German Services PMI
- 09:00 GMT - Euro Zone Manufacturing PMI
- 09:00 GMT - Euro Zone Services PMI
- 09:30 GMT - UK Retail Sales
- 13:30 GMT - Canadian CPI
- 14:45 GMT - US Manufacturing PMI
- 14:45 GMT - US Services PMI
- 15:00 GMT - US Existing Home Sales
Weekly Technical Review: EUR/USD, GBP/USD, AUD/USD, USD/JPY, USD/CAD, USD/CHF, DOW 30, GOLD
Waiting for lower timeframe confirmation is our main tool to confirm strength within higher timeframe zones, and has really been the key to our trading success. It takes a little time to understand the subtle nuances, however, as each trade is never the same, but once you master the rhythm so to speak, you will be saved from countless unnecessary losing trades. The following is a list of what we look for:
- A break/retest of supply or demand dependent on which way you're trading.
- A trendline break/retest.
- Buying/selling tails/wicks - essentially we look for a cluster of very obvious spikes off of lower timeframe support and resistance levels within the higher timeframe zone.
- Candlestick patterns. We tend to stick with pin bars and engulfing bars as these have proven to be the most effective.
We typically search for lower-timeframe confirmation between the M15 and H1 timeframes, since most of our higher-timeframe areas begin with the H4. Stops are usually placed 3-5 pips beyond confirming structures.
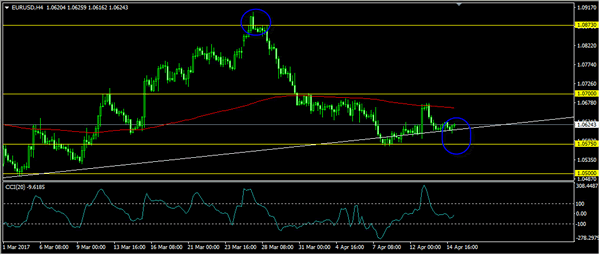
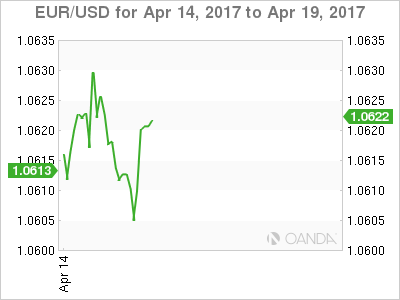
EUR/USD:
Weekly gain/loss: - 13 pips
Weekly closing price: 1.0602
The shared currency is effectively unchanged this week, despite ranging over 100 pips. From the weekly timeframe, the sellers still appear to have the upper hand, which could eventually force price to shake hands with the 2017 yearly opening level at 1.0515/support area at 1.0333-1.0502 sometime this week. With this area having been a considerable support and resistance zone in this market since late 1997, selling pressure is expected to diminish here.
Moving down to the daily timeframe, we can see that the candles are somewhat capped between a resistance area 1.0714-1.0683 and a demand base coming in at 1.0525-1.0576 (positioned ten pips above the aforementioned 2017 yearly opening level).
A quick recap of Friday's trading on the H4 chart shows that the unit was essentially moving sideways, as the majority of the market were enjoying some vacation time. Going into the later hours of the US segment, however, price sold off and closed the day just ahead of the 1.06 handle.
Our suggestions: Our desk, as well as the majority of the market participants, will, once again, refrain from taking any heavy positions today due to Easter Monday. As such, we do not expect to see much movement. For those still wishing to try their hand, levels of interest this morning remain the same as Friday's report:
The 1.06 handle given how well it held after Trump's comments regarding the US dollar.
1.0569: March's opening level, which happens to be located within daily demand at 1.0525-1.0576.
Data points to consider: No high-impacting news events scheduled on the docket today.
Levels to watch/live orders:
Buys: Flat (stop loss: N/A).
Sells: Flat (stop loss: N/A).
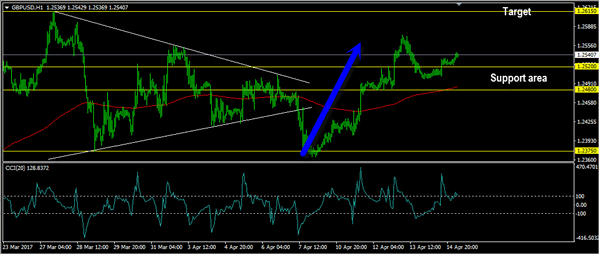
GBP/USD:
Weekly gain/loss: + 152 pips
Weekly closing price: 1.2521
Over the last week, the GBP changed tracks and reversed the majority of the prior week's losses. From the weekly timeframe, there sits the 2017 yearly opening level below at 1.2329, and to the upside we have a trendline resistance extended from the high 1.2774. Also noteworthy on the weekly timeframe is the potential bearish pennant currently in motion (1.2774/1.1986).
Daily demand at 1.2323-1.2379 (houses the said 2017 yearly opening level), as you can see, held firm last week and lifted price up to within an inch of resistance coming in at 1.2582. To our way of seeing things, this has formed a nice-looking range, which is certainly worth keeping an eye on.
Although Friday's action on the H4 chart was thin due to Good Friday, the 1.25 handle managed to remain firm during the day. As you can see, the major rallied and put in a top ahead of April's opening level at 1.2541.
Our suggestions: Similar to Friday's report, we are not anticipating much movement today given the majority of banks being closed in observance of Easter Monday. For those wishing to participate, we really like the look of February's opening level at 1.2586 for a bounce. Not only is it submerged within H4 supply at 1.2596-1.2568, it is also positioned within striking distance of the daily resistance mentioned above at 1.2582 and located nearby the aforementioned weekly trendline resistance.
Data points to consider: No high-impacting news events scheduled on the docket today.
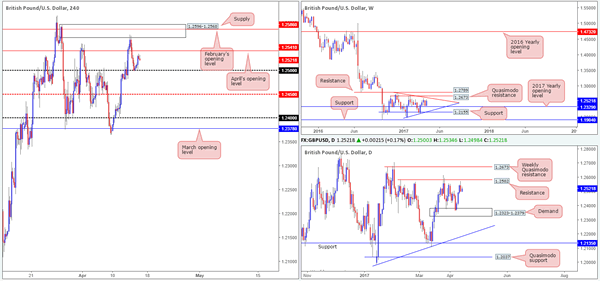
Levels to watch/live orders:
Buys: Flat (stop loss: N/A).
Sells: 1.2586 region ([waiting for additional lower-timeframe confirming price action is advised [see the top of this report] stop loss: dependent on where one confirms this area).
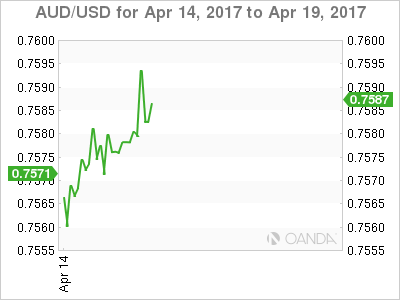
AUD/USD:
Weekly gain/loss: + 73 pips
Weekly closing price: 0.7574
During the course of last week's segment, weekly bulls staged a modest rebound from the support area at 0.7524-0.7446. This zone can be seen offering support and resistance as far back as mid-2016. Should the commodity currency extend last week's bullish rotation, the next upside hurdle can be seen at a trendline resistance taken from the high 0.7835, followed closely by supply at 0.7849-0.7752.
Zooming in and looking at the daily picture reveals that last week ended with price marginally closing above a resistance area penciled in at 0.7540-0.7570. Although the close is minor, it does somewhat help confirm the bullish tone on the weekly chart, and could also have opened up the path north for the candles to challenge supply at 0.7679-0.7640.
Good Friday, as expected, saw little movement in the markets. H4 price ended the day slipping back below February's opening line at 0.7577. Should the bears remain in the driving seat, the unit may attempt to test Friday's low at 0.7555, shadowed closely by the mid-level support barrier at 0.7550.
Our suggestions: The H4 mid-level support at 0.7550 is a particularly interesting level for potential longs. Not only does the line fuse closely with a possible H4 AB=CD (see black arrows) 127.2% Fibonacci extension at 0.7542 (green zone), let's not forget that we also have higher-timeframe structure suggesting further buying could be on the cards (see above).
We would consider a long from 0.7542/0.7550, but only on the condition that a bounce from this region is bolstered by a lower-timeframe confirming signal (see the top of this report).
Data points to consider: Chinese GDP figures along with Industrial production data scheduled for release at 3am GMT+1.
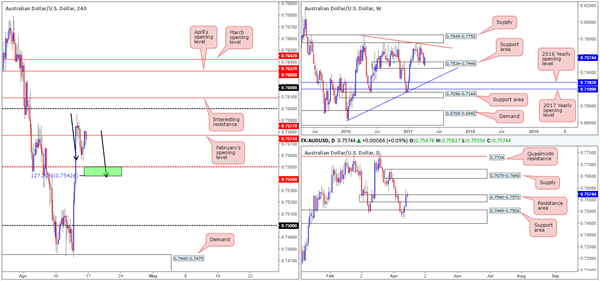
Levels to watch/live orders:
Buys: 0.7542/0.7550 ([waiting for additional lower-timeframe confirming price action is advised] stop loss: dependent on where one confirms this area).
Sells: Flat (stop loss: N/A).
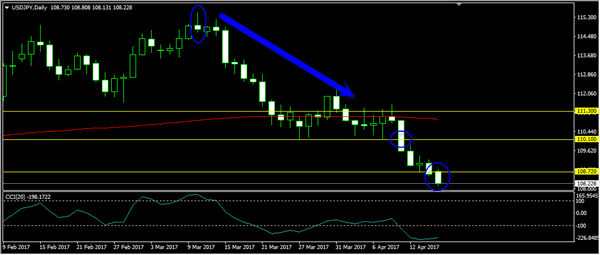
USD/JPY:
Weekly gain/loss: - 250 pips
Weekly closing price: 108.56
Following two weeks of struggle within the weekly support area seen at 111.44-110.10, the bears recently took control and forced price below this zone. The move could, in our humble opinion, force the piece to cross swords with the weekly support area coming in at 105.19-107.54.
Turning our attention to the daily chart, demand at 108.55-109.17 appears to be under pressure at the moment. In the event of this area giving way, the next downside target is seen at 107.15-107.90: a support area that's glued to the top edge of the noted weekly support zone.
Despite the majority of the market enjoying some vacation time on Friday, both the 1.09 handle and Thursday's low at 108.72 was taken out. This has, in our estimation, done two things. Firstly, the path south is relatively clear down to H4 demand at 107.77-108.21. Secondly, a potential H4 AB=CD pattern is forming, taken from the high 109.86. Also of interest here is the fact that the AB=CD (black arrows) 161.8% Fib ext. at 108.01, as well as the 108 handle, sits within the walls of the said H4 demand.
Our suggestions: The aforementioned H4 demand is certainly a place we'll be considering longs from. Not only because of its H4 confluence, but also due to it being bolstered by the daily support area mentioned above at 107.15-107.90.
Of course, be prepared for the possibility that price may not strike this area today given that the majority of banks remain closed in observance of Easter Monday.
Data points to consider: BoJ Gov. Kuroda speaks at 7.15am GMT+1.
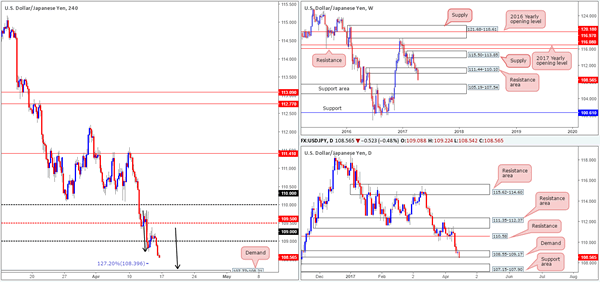
Levels to watch/live orders:
Buys: H4 demand 107.77-108.21 ([dependent on the time of day, a long from here at market is an option] stop loss: beyond the zone at 107.75).
Sells: Flat (stop loss: N/A).
USD/CAD:
Weekly gain/loss: - 82 pips
Weekly closing price: 1.3324
Weekly price has spent the best part of a month and a half teasing the underside of the 2017 yearly opening level at 1.3434. Reinforcing this line is a well-defined double-top formation seen around the 1.3588 neighborhood (green circle). To the downside the next area of interest is a demand coming in at 1.3006-1.3115. A decisive push above the yearly level, however, could spark a round of buying up to the 2016 yearly opening level at 1.3814.
Turning over a page to the daily chart, the candles recently printed a strong-looking two-day whipsaw through a support area fixed at 1.3263-1.3301. Assuming that the bulls continue to bolster this market, the next upside hurdle in view is supply printed at 1.3494-1.3439.
Although H4 price managed to remain firm above March/April's opening levels at 1.3310/1.3312 on Friday, there's still a possibility that the market may want to test the 1.33 handle given it represents the top edge of a daily support area at 1.3263-1.3301.
Our suggestions: While a long from 1.33 is something we would consider, it'd only be possible if H4 price formed a reasonably sized H4 bullish candle off this number and closed back above the said monthly levels. Not that this would guarantee a winning trade, what it would do though is help in showing buyer interest off a psychological handle that's reinforced by a daily support area!
Data points to consider: No high-impacting news events scheduled on the docket today.
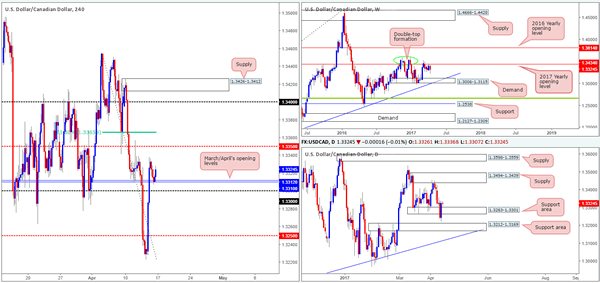
Levels to watch/live orders:
Buys: 1.33 region ([waiting for a reasonably sized H4 bull candle to form before pulling the trigger is advised] stop loss: ideally beyond the candle's tail).
Sells: Flat (stop loss: N/A).
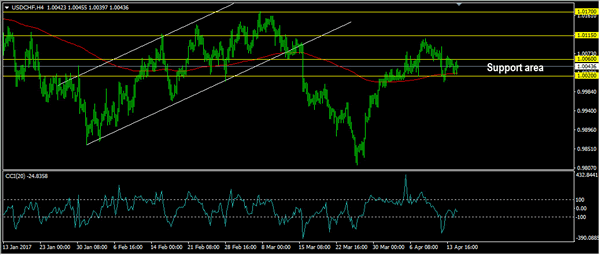
USD/CHF:
Weekly gain/loss: - 44 pips
Weekly closing price: 1.0046
Weekly supply at 1.0170-1.0095, as you can see, managed to hold firm last week consequently forcing price to retest the 2016 yearly opening level at 1.0029 as support. A weekly close below this level could see the unit attempt to approach the 27th March low at 0.9813.
On the daily chart, we can see that price is also seen capped between a supply base drawn from 1.0107-1.0072 and a support area logged at 1.0001-0.9957. Before any shorts are considered, we'd ideally want to see this support area consumed.
Swinging ourselves over to the H4 chart, the Swissy remained beneath March's opening level at 1.0066 on Good Friday. Of interest on this chart this morning is the 1.01/1.0081 area for possible shorting opportunities. Formed by the 161.8/127.2% AB=CD (black arrows) Fib extensions taken from the low 1.0007, and bolstered by both the said daily supply zone and weekly supply, this green sell zone has a good chance of bouncing price.
Our suggestions: Seeing as today is also a vacation for most of the market, the H4 candles may not reach 1.01/1.0081 today. However, it is certainly an area we would advise placing on your watchlists for use this week.
Data points to consider: No high-impacting news events scheduled on the docket today.
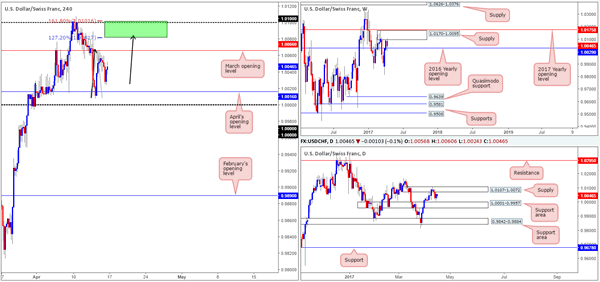
Levels to watch/live orders:
Buys: Flat (stop loss: N/A).
Sells: 1.01/1.0081 (stop loss: 1.0011).
DOW 30:
Weekly gain/loss: - 187 points
Weekly closing price: 20470
US equities sank last week, consequently bringing the weekly candles closer to testing the demand base at 19675-19964, which happens to hold the 2017 yearly opening level within at 19769.
Since the 22nd March, the daily candles have experienced a significant amount of choppy action between demand plugged at 20527-20626 and the resistance area at 20714-20821. On Thursday, however, the bears decided enough was enough and forced price out of this tight range. According to the daily structure, Thursday's action could set the stage for a continuation move south down to demand pegged at 20003-20091 (located just above the aforementioned weekly demand and daily support at 19964).
However, before we begin looking to sell this index, H4 price has to contend with a nearby demand area logged at 20381-20425. A H4 close below here would, in our opinion, 'seal the deal' for lower prices, and this is exactly when our desk plans to jump aboard!
Our suggestions: We do not anticipate much movement being seen today given Easter Monday, so it's doubtful we'll get our break below the said H4 demand. Unless this happens, we see very little to hang our hat on at the moment.
Data points to consider: No high-impacting news events scheduled on the docket today.
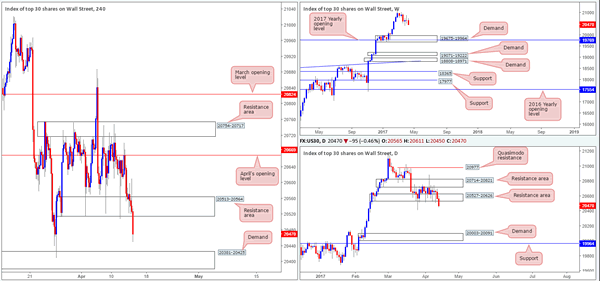
Levels to watch/live orders:
Buys: Flat (stop loss: N/A).
Sells: Flat (stop loss: N/A).
GOLD:
Weekly gain/loss: + $32.3
Weekly closing price: 1287.2
The yellow metal aggressively marched north last week, registering its fifth consecutive weekly gain. While weekly price shows room to rally this week up to resistance at 1306.0, it might be worth noting that surrounding this level are Fibonacci extensions 161.8/127.2% at 1313.7/1285.2 taken from the low 1188.1. Therefore, we may see the bears make an appearance before reaching 1306.0.
In conjunction with weekly flow, daily price looks poised to extend north up to the Quasimodo resistance level at 1307.8. This - coupled with weekly structure makes for an awesome sell zone!
Little movement was registered on Thursday last week. In fact, the H4 candles remained trading within a tight range inside supply drawn from 1292.2-1283.5. This supply, as far as we can see, is the only thing stopping bullion from reaching the noted weekly resistance level.
Our suggestions: Ideally, we'd like to see the bulls close above the aforementioned H4 supply, and attack the weekly resistance line. It would be here that our desk begins watching for a reasonably sized H4 bearish candle to form for entry.
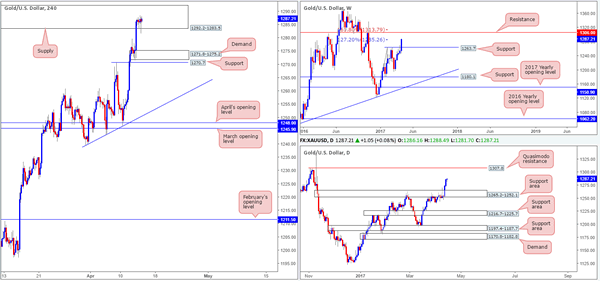
Levels to watch/live orders:
Buys: Flat (stop loss: N/A).
Sells: 1306.0 region ([waiting for a reasonably sized H4 bear candle to form before pulling the trigger is advised] stop loss: ideally beyond the candle's wick).
Daily Technical Analysis: EURUSD, GBPUSD, USDJPY, USDCHF
EURUSD Forecast:
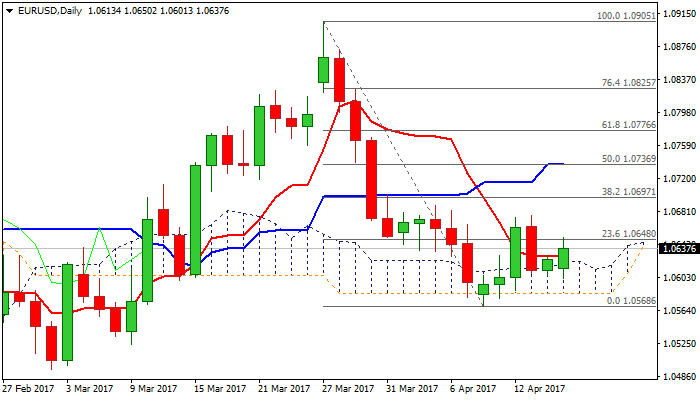
The EURUSD was indecisive last week. Price traded in narrow range, topped at 1.0677 but closed lower at 1.0610. The bias is neutral in nearest term. Price is still in a bearish phase since the false break above 1.0873 but the trend line support still holds so far, as you can see on my H4 chart above. Immediate resistance is seen around 1.0650. A clear break above that area could trigger further bullish pressure testing 1.0700 region. On the downside, a clear break and daily close below the trend line support and 1.0575 would expose 1.0500 region. Overall I remain neutral.
GBPUSD Forecast:
The GBPUSD had a bullish momentum last week topped at 1.2573. The bias is neutral in nearest term but as long as stay above 1.2480 I still prefer a bullish scenario at this phase retesting 1.2615 region. Immediate resistance is seen around 1.2575 followed by 1.2615. On the downside, a clear break and daily close below 1.2480 would end the bullish phase which started after bounced off 1.2375 key support. Overall I remain neutral.
USDJPY Forecast:
The USDJPY continued its bearish momentum last week after broke below 110.10 key support, bottomed at 108.53 and hit 108.13 earlier today in Asian session. The bias is bearish in nearest term testing 107.50 area. Immediate resistance is seen around 108.70. A clear break above that area could lead price to neutral zone in nearest term but overall I remain bearish and any upside pullback should be seen as a good opportunity to sell.
USDCHF Forecast
The USDCHF was indecisive last week. The bias is neutral in nearest term but as long as stay above 1.0020 support area, price is still in a bullish phase testing 1.0115 and 1.0170 resistance levels. Immediate resistance is seen around 1.0060. On the downside, a clear break and daily close back below 1.0020 would end the bullish phase testing 0.9970 or lower. Overall I remain neutral.
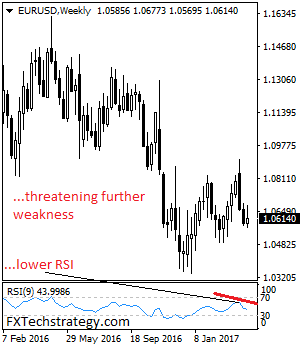
EURUSD: Bearish, Retains Its Downside Pressure
EURUSD: With the pair continuing to retain its downside pressure, more weakness is expected in the days ahead. Resistance comes in at 1.0650 level with a cut through here opening the door for more upside towards the 1.0700 level. Further up, resistance lies at the 1.0750 level where a break will expose the 1.0800 level. Conversely, support lies at the 1.0550 level where a violation will aim at the 1.0500 level. A break of here will aim at the 1.0450 level. Its daily RSI is bearish and pointing lower supporting this view. All in all, EURUSD faces further bear threats in the new week.
Dr Strangelove Redux
Geopolitical risk will continue to be closely monitored today as a strapping US Navy Armada moves within striking distance of North Korea. On cue, Dictator Kim Jong-un rolled out the big guns during a state parade and in defiance conducted a missile test launch; a failed one mind you.
With all the Military adventurism in play, those insidious wartime market correlations take force as the risk off theme grips markets. To what extent the markets need to price in geopolitical risk more actively into their psyche will likely drive nearer term sentiment. It feels like we are in the midst of Dr Strangelove Redux, as this game of chicken unfolds. But all kidding aside, there's no question the world has become a more sensitive and scarier place in the last fortnight.
Japanese Yen
The market has tapered most of its long USD positioning over the past few months, so the big question is whether or not the short term trader views it a necessity to more actively price in Geopolitical risk. With the US Navy Armada positioned off the coast of North Korea, I suspect this will be well outside the USD bulls comfort zone, and there will be little significant opposition to a move lower. USDJPY has slipped to a five-month low in the Asian morning.
Gold
Gold has been one of the major safe-haven plays during the geopolitical storm. COMEX gold opened by printing a new 2017 high with the front end option bias showing the path higher. Despite all the cacophony, there has been tepid investor demand on the physical side as dealers are reporting that the traditional buying of one-ounce bars and gold coins have been tepid. But the longer this geopolitical uncertainty plays out, the more likely the gold game becomes a "self-fulfilling prophecy", meaning higher prices, as traders and investors alike pile in and won't want to miss the party if gold marches higher.
Australian Dollar
The Australian dollar is feeding off of last week's jobs print and Trump's comments regarding the USD 'getting too strong'. The real question remains if there is sufficient synergy to move another leg higher. I suspect with global macro drivers on the back burner, the AUD's fortune and misfortunes will be driven by commodity prices and global equity sentiment.
Euro
The narrowing in the French election polling is contributing to a high degree of anxiety for European investors, however, with the USD dollar wobbling on President Trump's "USD getting too strong" comments, there has been little eagerness to drive EURUSD below the 1.06 level. As election risk simmers, it is likely more a question of when, rather than if?
Malaysian Ringgit
Bank Negara, in a timely fashion, has adjusted the rules for FX hedging provision. Registered non-bank entities will be allowed to hedge up to 100% of their underlying assets as well as to manage an additional 25% of FX exposures. This comes on the heels of the largest monthly offshore drawdown on record in the local debt market. With the bulk of the overseas withdrawals likely in reaction to the stringent FX regulations implemented late last year, and with the previous week's changes to the FX hedging provision, the key question will be just how eager will fund managers be to re-engage and buy into the new proposal?
Turkey
Turkish markets were focused on Sunday's referendum results for a constitutional change, which allows President Erdogan sweeping legal power. While the opposition party CHP has announced it would demand a recount, the state-run Anadolu news agency reports 51.3% voted "Yes" to the changes vs. 48.7% saying "No". Voter turnout was reported to be a staggeringly high 86%. The 'Yes' vote will have a positive effect on investor sentiment and the Turkish economy as a whole. Turkish assets offer some of the highest yields, and a 'Yes' vote will remove any level of political uncertainty and should be supportive of the Turkish Lira, as carry trade appeal should follow in tow.
US Treasury Report
In a much anticipated US Treasury FX report, the US has not named any major trading partner as a currency manipulator. And when questioning about his pivot on whether to call China a currency manipulator, US President Donald Trump, on Sunday, was saying on Twitter that China was helping with the North Korean problem. "Why would I call China a currency manipulator when they are working with us on the North Korean problem? We will see what happens!" All in all, the report made little waves however the US Treasury has adopted a more hawkish tone to FX intervention.