Sample Category Title
USD/JPY Candlesticks and Ichimoku Analysis
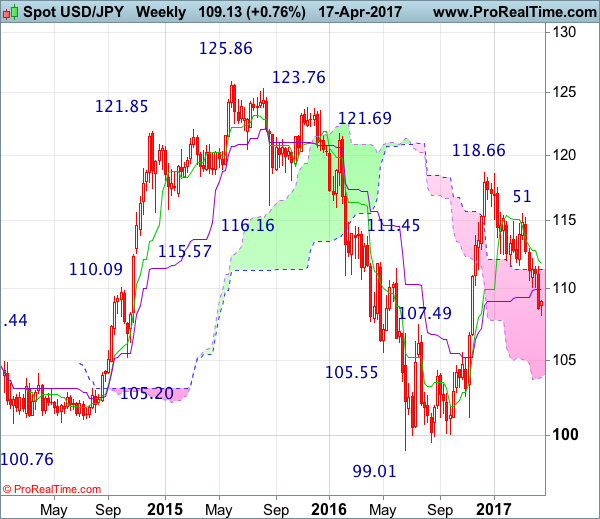
Weekly
• Last Candlesticks pattern: Marubozu
• Time of formation: 14 Nov 2016
• Trend bias: Down
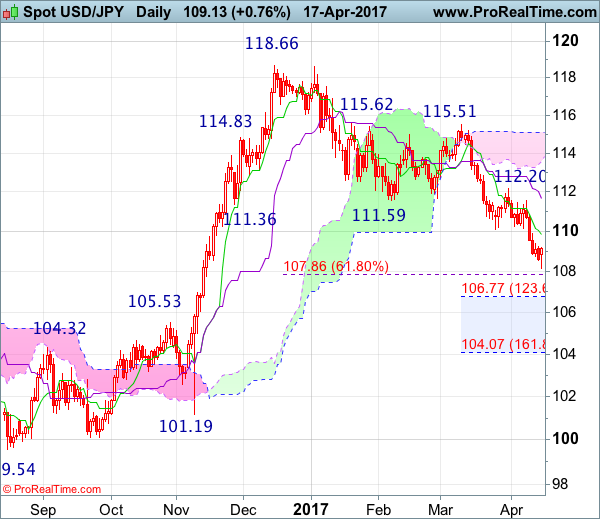
Daily
• Last Candlesticks pattern: Shooting star
• Time of formation: 15 Feb 2017
• Trend bias: Down
USD/JPY – 109.05
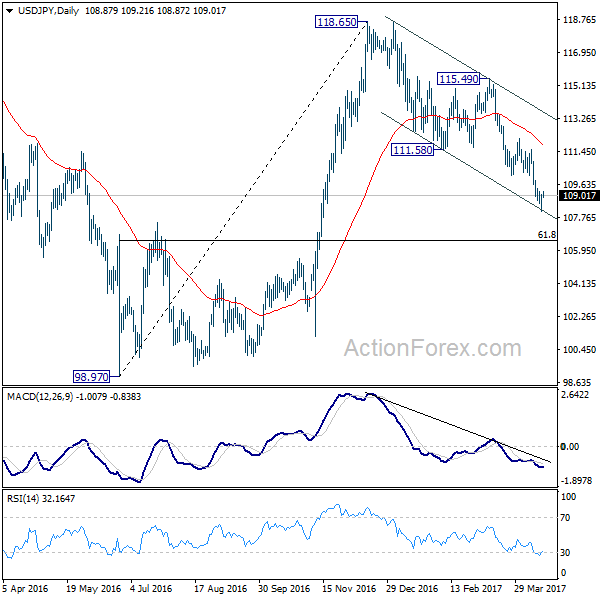
The greenback did meet renewed selling interest at 111.58 (a short position was met at 111.50) and dollar has fallen again in line with our bearish expectations, the indicated downside target at 109.50 was met (with 200 points profit) as price fell to as low as 108.13 yesterday before rebounding. Although this anticipated has justified our bearishness and adds credence to our view that the decline from 118.66 top is still in progress, yesterday’s rebound from 108.13 formed a hammer bullish reversal pattern on the daily chart, suggesting consolidation above this level wold be seen and corrective bounce to the Tenkan-Sen (now at 109.86) is likely, however, reckon 110.40-50 would limit upside and bring another decline later. A break of said support at 108.13 would extend recent decline to 107.85-90 (61.8% Fibonacci retracement of 101.19-118.66) and possibly 107.40-50 but oversold condition should prevent sharp fall below 106.75-80 (1.236 time projection of 118.66-111.59 measuring from 115.51) and 105.90-00 should hold, bring rebound later.
On the upside, whilst initial recovery to the Tenkan-Sen (now at 109.86) is likely, reckon upside would be limited to 110.40-50 and bring another decline later. Above said resistance at 111.58 would defer but only a daily close above the Kijun-Sen (now at 111.67) would suggest a temporary low is possibly formed, risk test of resistance at 112.20 but only a sustained breach above this level would provide confirmation, bring correction of recent selloff to 112.90 (previous resistance) and possibly towards other resistance at 113.54.
Recommendation : Our short position entered at 111.50 met target at 109.50 with 200 points profit and would sell again at 110.40 for 108.40 with stop above 111.40.
On the weekly chart, as the greenback has fallen again in line with our bearish expectation, adding credence to our view that top has been formed at 118.66 earlier and mild downside bias remains for the retreat from there to bring retracement of recent upmove, hence further weakness to 107.85-90 (61.8% Fibonacci retracement of 101.19-118.66), then towards 107.00, however, near term oversold condition should prevent sharp fall below 106.50-55 (61.8% Fibonacci retracement of 99.01-119.52) and reckon previous resistance at 105.53 (now support) would remain intact.
On the upside, although initial recovery to the Kijun-Sen (now at 109.93) cannot be ruled out, reckon upside would be limited to 110.40-50 and bring another decline. Above resistance at 111.58 would defer and risk test of the Tenkan-Sen (now at 111.82) but a weekly close above 112.20-26 resistance level is needed to signal a temporary low is formed instead, bring a stronger rebound to 113.00, then test of 113.54 resistance and possibly 114.00-10, however, price should falter well below resistance at 115.51.
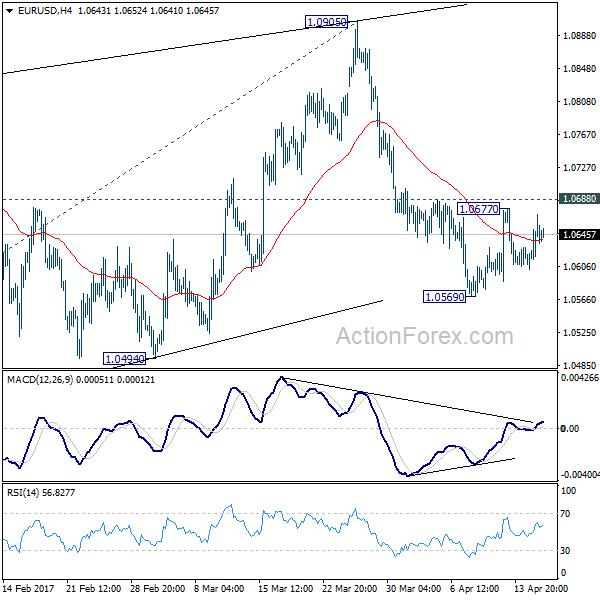
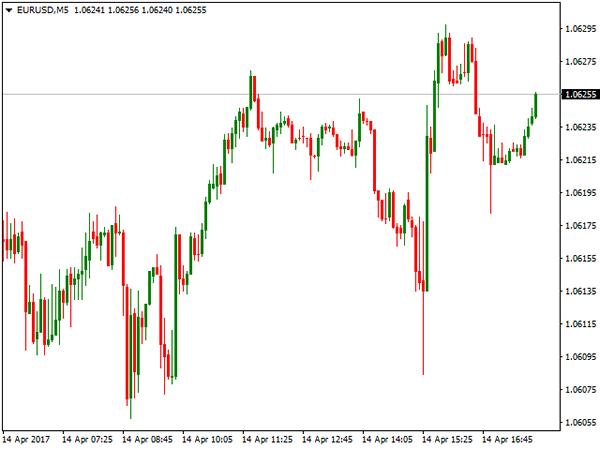
EUR/USD Daily Outlook
Daily Pivots: (S1) 1.0605; (P) 1.0638 (R1) 1.0674; More....
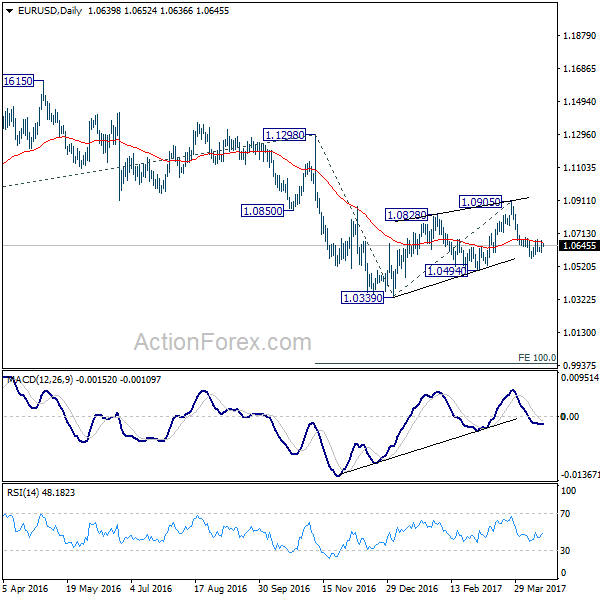
Intraday bias in EUR/USD remains neutral for the moment. Near term bearish outlook is unchanged. That is, correction from 1.0339 has completed with three waves up to 1.0905. Fall from there is resuming larger down trend. On the downside, break of 1.0569 minor will turn bias to the downside for 1.0494 support first. Decisive break there should confirm our bearish view. In that case, EUR/USD should drop through 1.0339 to 100% projection of 1.1298 to 1.0339 from 1.0905 at 0.9946. On the upside, however, break of 1.0688 resistance will delay the bearish case and turn focus back to 1.0905 resistance instead.
In the bigger picture, as long as 1.1298 key resistance holds, whole down trend from 1.6039 (2008 high) is still expected to continue. Break of 1.0339 low will send EUR/USD through parity to 61.8% projection of 1.3993 to 1.0461 from 1.1298 at 0.9115. However, considering bullish convergence condition in weekly MACD, break of 1.1298 will indicate term reversal. this would also be supported by sustained trading above 55 week EMA.
USD/CHF Daily Outlook
Daily Pivots: (S1) 1.0015; (P) 1.0035; (R1) 1.0060; More.....
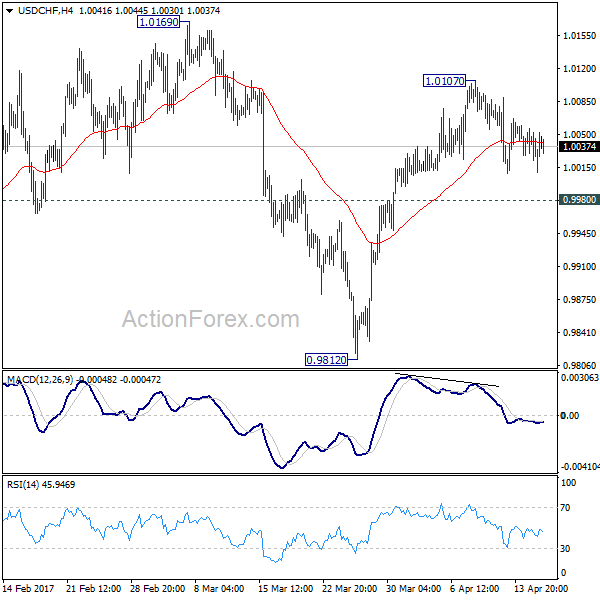
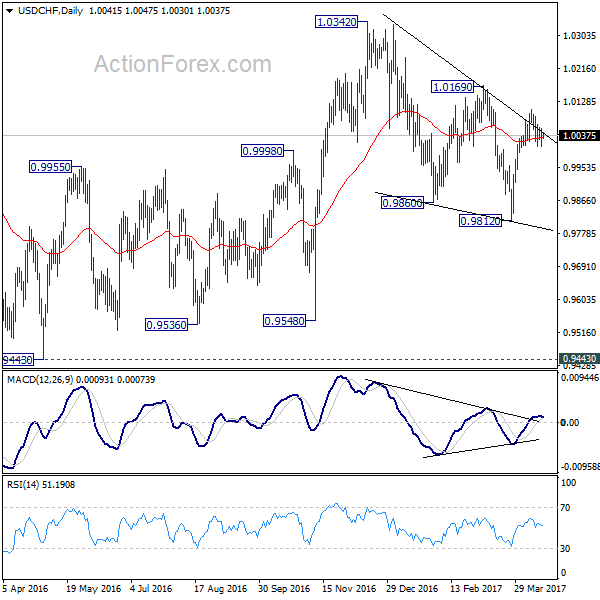
Intraday bias in USD/CHF remains neutral for the moment. Near term bullish outlook is unchanged. That is, corrective from 1.0342 has completed with three waves down to 0.9812. And, rise from 0.9548 is resuming. On the upside, break of 1.0107 will turn bias to the upside for 1.0169 resistance. Break there should confirm our bullish view and should target a test on 1.0342 key resistance next. However, below 0.9980 will dampen this bullish case and turn bias back to the downside for 0.9812 low.
In the bigger picture, we're still maintaining that firm break of 1.0342 key resistance is needed to confirm underlying bullish momentum in the cross. However, the corrective nature of the fall from 1.0342 to 0.9812 is starting to give the medium term outlook a bullish favor. Hence, in stead of looking for topping signal around 1.0342, we'd now pay closer attention to upside acceleration as USD/CHF approaches this level again.
USD/JPY Daily Outlook
Daily Pivots: (S1) 108.33; (P) 108.69; (R1) 109.26; More....
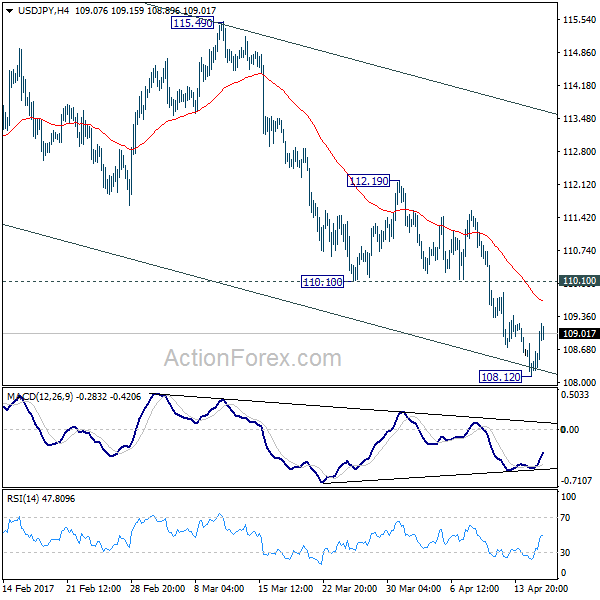
USD/JPY formed a temporary low at 108.12 after hitting near term channel support. Intraday bias is turned neutral first. Current development argues that rise from 98.97 is already completed at 118.65. Hence, we'd expect upside of recovery to limited by 110.10 minor resistance to bring another decline. Below 108.12 will target 61.8% retracement of 98.97 to 118.65 at 106.48. Sustained break there will pave the way back to 98.97 low. Nonetheless, break of 110.10 will be the first sign of near term bottoming and turn bias back to the upside for 112.19 resistance instead.
In the bigger picture, price actions from 125.85 high are seen as a corrective pattern. Current development suggests that it's not completed yet and is extending. In case of deeper decline, downside should be contained by 61.8% retracement of 75.56 to 125.85 at 94.77 to bring rebound. Rise from 75.56 is still expected to resume later after the correction from 125.85 completes.
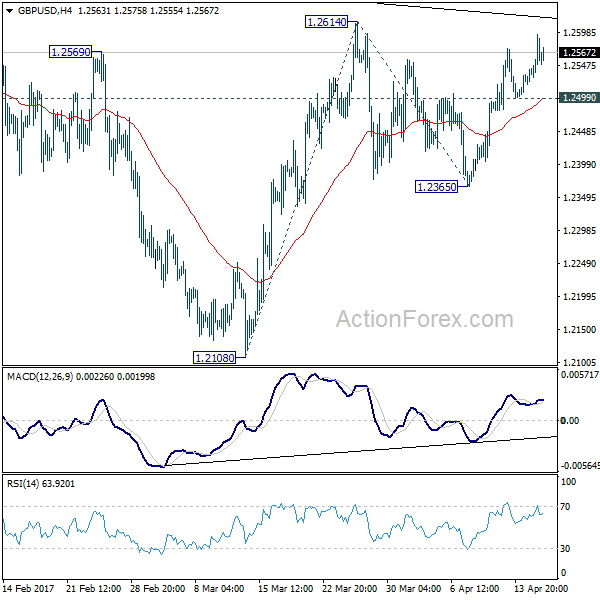
GBP/USD Daily Outlook
Daily Pivots: (S1) 1.2522; (P) 1.2558; (R1) 1.2599; More...
Intraday bias in GBP/USD remains mildly on the upside for 1.2614 resistance. Break there will resume the rise from 1.2108 and target 100% projection of 1.2108 to 1.2614 from 1.2365 at 1.2871. However, such rally is seen as part of the consolidation from 1.1946 low. Hence, we'd expect strong resistance around 55 week EMA (now at 1.3016) to limit upside and bring down trend resumption. On the downside, break of 1.2499 minor support will turn bias back to the downside for 1.2365 support first.
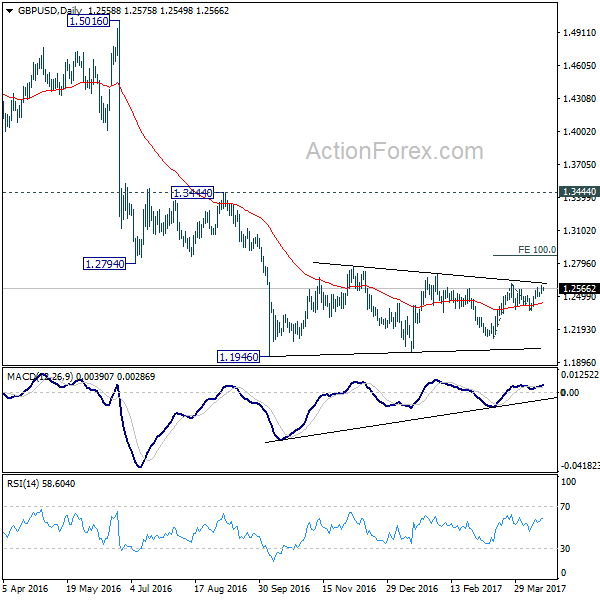
In the bigger picture, fall from 1.7190 is seen as part of the down trend from 2.1161. There is no sign of medium term reversal yet. Sustained trading below 61.8% projection of 2.1161 to 1.3503 from 1.7190 at 1.2457 will target 100% projection at 0.9532. Overall, break of 1.3444 resistance is needed to confirm medium term bottoming. Otherwise, outlook will remain bearish.
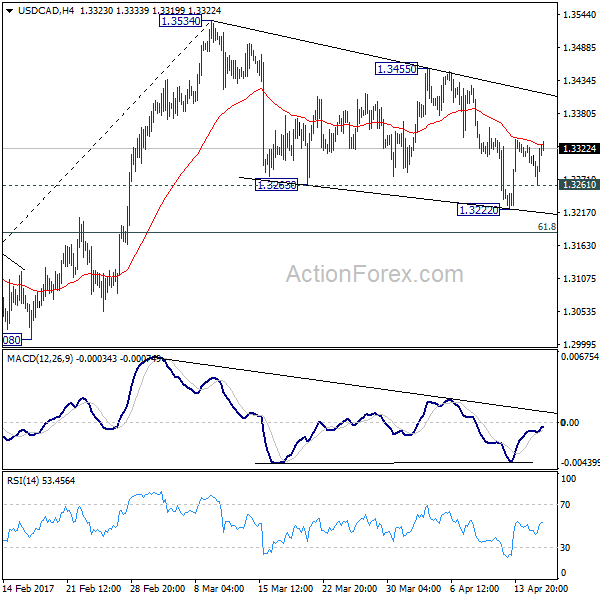
USD/CAD Daily Outlook
Daily Pivots: (S1) 1.3277; (P) 1.3299; (R1) 1.3337; More....
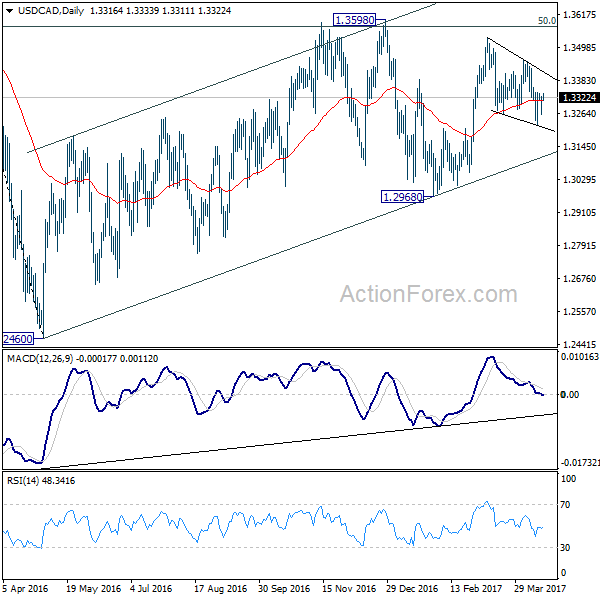
Intraday bias in USD/CAD remains mildly on the upside for the moment. As noted before, correction from 1.3534 is likely finished with three waves down to 1.3222. Further rise should be seen to 1.3455 next. Break there will confirm this bullish case and send USD/CAD to 1.3598 resistance. In that case, whole rise from 1.2460 is likely resuming too. On the downside, below 1.3261 minor support will bring another fall. But we'd expect strong support from 61.8% retracement of 1.2968 to 1.3534 at 1.3184 to contain downside and bring rebound.
In the bigger picture, price actions from 1.4689 medium term top are seen as a correction pattern. The first leg has completed at 1.2460. The second leg from 1.2460 is likely still in progress and could target 61.8% retracement of 1.4689 to 1.2460 at 1.3838. We'd look for reversal signal there to start the third leg. However, break of 1.2968 will argue that the third leg has already started and should at least bring a retest of 1.2460 low. Meanwhile, sustained trading above 1.3838 would pave the way to retest 1.4689 high.
European Open Briefing: Risk Appetite Remained Low In Asia
Global Markets:
- Asian stock markets: Nikkei up 0.20 %, Shanghai Composite fell 0.05 %, Hang Seng declined 1.00 %, ASX 200 fell 1.10 %
- Commodities: Gold at $1285 (-0.50 %), Silver at $18.38 (-0.70 %), WTI Oil at $52.60 (-0.15 %), Brent Oil at $55.30 (-0.15 %)
- Rates: US 10-year yield at 2.25, UK 10-year yield at 1.05, German 10-year yield at 0.19
News & Data:
- China House Prices YoY (Mar): 11.30% (prev 11.80%)
- RBA Minutes: Judged Steady Rates Consistent with Growth and Inflation Targets
- Asia stocks slip amid North Korea concerns, dollar up on Mnuchin comments – RTRS
- Oil prices mixed after U.S. production seen rising – RTRS
- Dollar/yen off five-month low but U.S.-Japan trade issues limit rise – RTRS
Markets Update:
Risk appetite remained low in Asia. Hong Kong and Australian markets reopened after a long weekend and declined more than 1 % on the day. The other major stock markets posted a small loss as well.
Increasing tensions between the US and North Korea are keeping traders cautious. Nevertheless, Gold fell slightly in the past few trading sessions, as the Dollar regained some strength. The metal is looking a bit overbought in the short-term, and a retracement towards $1270 seems likely.
The Australian Dollar came under pressure overnight. The RBA minutes did not deliver any new information, it was rather the risk-off sentiment that weighed on the currency. AUD/USD fell from 0.76 to 0.7560. Support is seen at 0.7550 and then again at 0.75.
USD/JPY managed to recover slightly, but the rally was capped ahead of 109.20. Strong resistance is seen in the area between 109.20 and 109.30. Support now lies at 108.50 and ahead of 108.00.
Upcoming Events:
- 13:30 GMT – US Building Permits
- 13:30 GMT – US Housing Starts
- 14:15 GMT – US Industrial Production
- 14:15 GMT – US Manufacturing Production
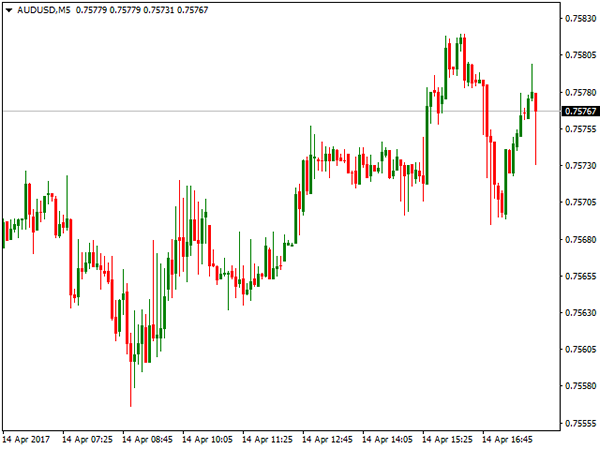
AUD/USD Daily Outlook
Daily Pivots: (S1) 0.7565; (P) 0.7588; (R1) 0.7611; More...
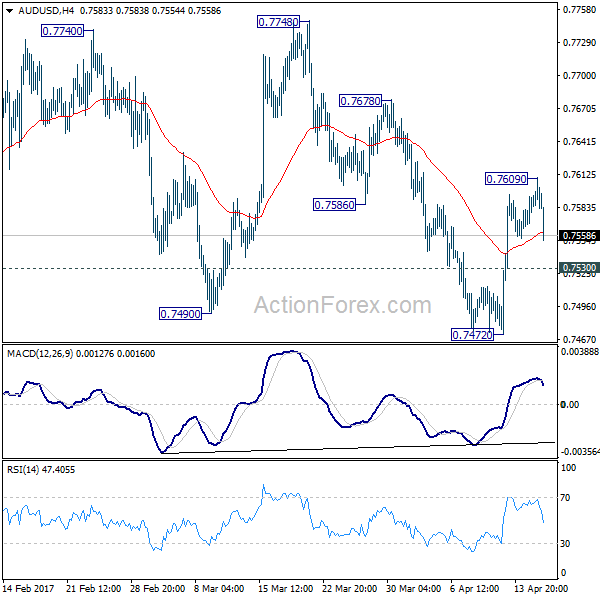
AUD/USD retreats today as rebound from 0.7472 lost momentum after hitting 0.7609. Intraday bias is turned neutral first. At this point, we're still slightly favoring the case that pull back from 0.7748 is completed at 0.7472. And rise fro 0.7158 is possibly resuming. Above 0.7609 will target 0.7678 resistance first. Break there will confirm this case and send AUD/USD through 0.7748 towards long term fibonacci level at 0.7849. On the downside, though, below 0.7530 minor support will turn bias back to the downside for 0.7472 instead.
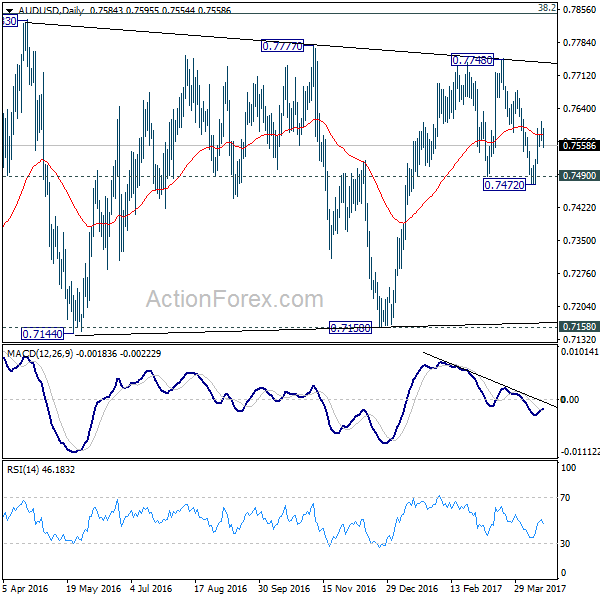
In the bigger picture, we're still treating price actions from 0.6826 low as a correction. And, as long as 38.2% retracement of 0.9504 to 0.6826 at 0.7849 holds, long term down trend from 1.1079 is expected to resume sooner or later. Break of 0.6826 low will target 0.6008 key support level. However, firm break of 0.7849 will indicate that rise from 0.6826 is developing into a medium term rebound, rather than a sideway pattern. In such case, stronger rise should be seen to 55 month EMA (now at 0.8144) and above.
Dollar Looked Past Geopolitical Tensions, Listened to US Treasury Mnuchin
Dollar and US equities came back from holiday stronger. The markets are looking through the geopolitical uncertainties in North Korea. Instead, they listened to comments from US Treasury Secretary Steven Mnuchin. Mnuchin conceded that completing tax reforms through Congress before August deadline was "highly aggressive to not realistic at this point". However, he noted that it would "probably delayed a bit" because of the healthcare. Meanwhile, he noted that the border-adjustment tax, seen as a sticking point among Republicans, could be excluded in the tax reform.
Treasury Mnuchin: Dollar strength is a good thing
Regarding the strength of US Dollar, Mnuchin noted that "as the world's currency, the primary reserve currency, I think that over long periods of time the strength of the dollar is a good thing." And, "it's a function of the confidence and the strength of the US economy." Nonetheless, he still agreed with President Donald Trump's comments regarding strength of the greenback in short term. Mnuchin said that "The president's comment - which again I agree with - is that over short periods of time the strength of the dollar creates certain issues that hurt our exports. I think that is what he has referred to, which is again factually correct."
Fed Vice Fsicher: Won't repeat taper tantrum
Fed Vice Chair Stanley Fischer said yesterday that when unwinding of asset purchase starts, it's unlikely to repeat the so called "taper tantrum". He referred to the development that 10 year yield jumped nearly 1% back in 2013 after the first discussion of tapering. Fischer noted that his " tentative conclusion from market responses to the limited amount of discussion of the process of reducing the size of our balance sheet that has taken place so far is that we appear less likely to face major market disturbances now than we did in the case of the taper tantrum." Fischer pointed to survey data which suggested that markets participants are now unsure how soon Fed will start shrinking the balance sheet. And they had more expectations of an early announcement date of the operations.
French election in focus
Focuses will also be on French presidential election now. Recent surge in support for far-left Jean-Luc Melenchon is seen as making the election a four way match with far right Marine Le Pen, centrist Emmanuel Macron and conservative François Fillon. Some see increasing risk of having two euro-sceptic candidates, Le Pen and Melenchon, heading to the run-off in May. The markets responded by dumping French bonds and stocks. The five year French-German yield spread has indeed jumped to the highest level since 2013. However, it's believed that support for Melenchon mainly came within the left-wing and is approaching limit. Thus, a run-off of Le Pen and Macron is still the base case. More in French Presidential Election: Macron and Le Pen Still Favorite as Melenchon Closing to Limit
RBA concerned with employment and housing
The minutes of April RBA meeting showed that the central bank is concerned on both the employment and housing markets. And, "the board judged that developments in the labor and housing markets warranted careful monitoring over coming months. "The minutes noted that labor market conditions were "somewhat weaker than had been expected" and underemployment "remained high". And, "although forward-looking indicators of labor demand continued to suggest an increase in employment growth over the period ahead, this has been true for some time without leading to an improvement in labor market conditions." Regarding housing market, the minutes warned that "growth in housing credit continued to outpace growth in household incomes, suggesting the risks associated with the housing market and household balance sheets has been rising." At the meeting, official interest rate was left unchanged at record low at 1.50%.
BoJ Kuroda: Consumer spending picking up
BoJ Governor Haruhiko Kuroda said yesterday that consumer spending is picking up. And this is supported by steady improvements in employment and wages. And he noted that firms are likely to offer base-salary raise for staff during the current financial year. Separately, Deputy Governor Hiroshi Nakaso said that the central bank has been discussing the "means and how" of monetary stimulus exit" that could affect its revenues. But for now, BoJ's priority is still on maintaining sustainable inflation through the massive stimulus program.
On the data front...
The economic data is empty in European session today. Canada will release international securities transactions. US will release new residential contribution and industrial production.
AUD/USD Daily Outlook
Daily Pivots: (S1) 0.7565; (P) 0.7588; (R1) 0.7611; More...
AUD/USD retreats today as rebound from 0.7472 lost momentum after hitting 0.7609. Intraday bias is turned neutral first. At this point, we're still slightly favoring the case that pull back from 0.7748 is completed at 0.7472. And rise fro 0.7158 is possibly resuming. Above 0.7609 will target 0.7678 resistance first. Break there will confirm this case and send AUD/USD through 0.7748 towards long term fibonacci level at 0.7849. On the downside, though, below 0.7530 minor support will turn bias back to the downside for 0.7472 instead.
In the bigger picture, we're still treating price actions from 0.6826 low as a correction. And, as long as 38.2% retracement of 0.9504 to 0.6826 at 0.7849 holds, long term down trend from 1.1079 is expected to resume sooner or later. Break of 0.6826 low will target 0.6008 key support level. However, firm break of 0.7849 will indicate that rise from 0.6826 is developing into a medium term rebound, rather than a sideway pattern. In such case, stronger rise should be seen to 55 month EMA (now at 0.8144) and above.
Economic Indicators Update
| GMT | Ccy | Events | Actual | Forecast | Previous | Revised |
|---|---|---|---|---|---|---|
| 01:30 | AUD | RBA Minutes Apr | ||||
| 12:30 | CAD | International Securities Transactions (CAD) Feb | 6.20b | |||
| 12:30 | USD | Housing Starts Mar | 1.28M | 1.29M | ||
| 12:30 | USD | Building Permits Mar | 1260k | 1213k | ||
| 13:15 | USD | Industrial Production Mar | 0.50% | 0.00% | ||
| 13:15 | USD | Capacity Utilization Mar | 76.00% | 75.40% |
Weekly Report: Energy, Commodities, Indices, Forex
ENERGY
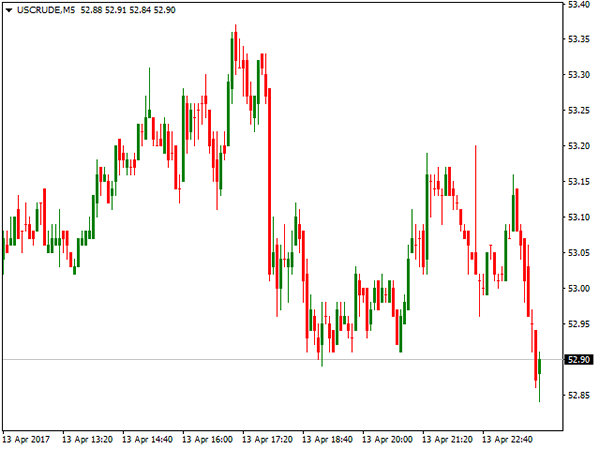
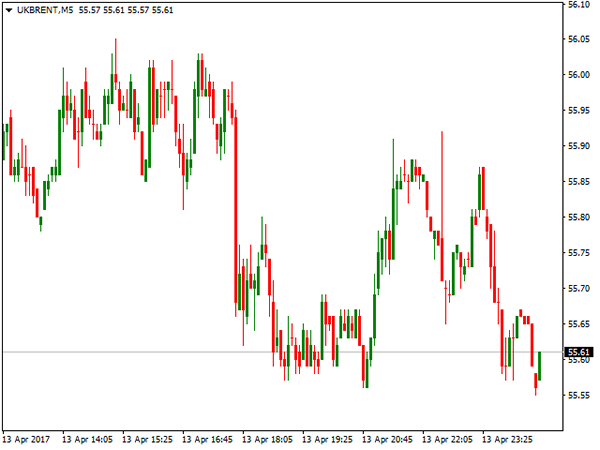
WTI Oil rallied for the third consecutive week and hit fresh five-week high at $53.74, gaining 1.15% for the week. Oil price was supported by heightened geopolitical tensions in the Middle East, the region that provides more than a quarter of world's oil output. Crude oil price accelerated higher last week after United States fired missiles on Syrian air base that raised tensions with Russia and threatened of further escalation. Another hot point was North Korea which made several missile tests that prompted the US to send their warships in the region. Tensions were further heated after North Korea threatened of launching their nuclear weapons if being attacked. Additional support to the oil prices were hopes that agreement between OPEC and non-OPEC oil producers for production cut by 1.8 million barrels per day would extend for additional six months. Reactions in oil markets on initial decision to cut oil output until June were good, as oil price recovered strongly, but extended action is needed to sustain current recovery in oil prices. US Crude oil hit its five-week high on Wednesday but pulled back despite unexpected fall in US weekly crude inventories by 2.2 million barrels against forecasted build of 87.000 barrels. Oil price dipped around $1 on Wednesday, as increase in US shale oil production weighed on support from Crude stocks draw and geopolitical tensions. Oil price remained steady despite closing below $53.00 handle, supported by fundamentals as well as bullish technical studies. However, overbought studies warn of deeper correction before oil price resumes rally, as key short-term barriers at $55.00 zone remain in focus. Oil may extend correction towards $ 52.20 where initial support lies, with strong technical support at $51.70 zone required holding and keeping bullish structure intact. Conversely, loss of the latter support would signal stronger correction of the recent $47.07/$53.74 rally. Brent oil hit five week high at $56.62, meeting its initial target, Mar 7 high, but was dragged down on by overbought technical studies.
Brent price accelerated higher at the beginning of the week, supported by shutdown of Libya's largest oilfield and being supported by rising geopolitical tensions. Again, strong bearish signal is developing in daily technical studies where slow stochastic is emerging from overbought zone and also formed bearish divergence, which may signal stronger correction. Immediate support lies at $55.00, ahead of converged 55/100d Moving Averages at $54.40 and $54.00 Fibonacci 38.2% support, where extended correction should find support.
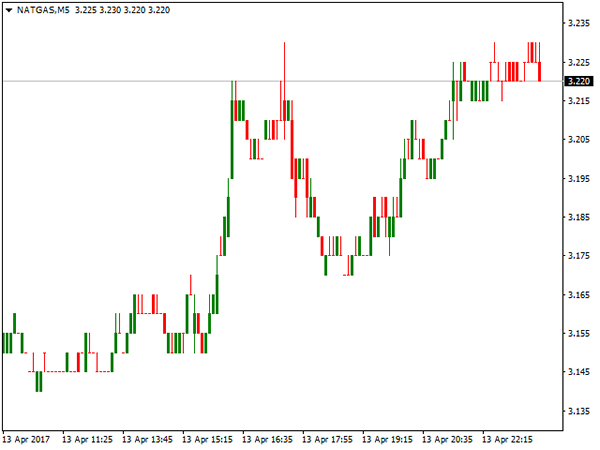
US Natural Gas futures rose over 1% on Thursday after data showed expected built in gas storage. Natural Gas contract for May delivery spiked to $3.230 per million BTU on Thursday, where it closed for the week. Recovery on Thursday was not enough to improve negative picture as gas price fell nearly 3% on Tuesday, ending week in red. Weekly report showed 10 billion cubic feet of natural gas added into storage in the week ended April 7, which was slightly above forecasted 9 billion cubic feet. Solid data prompted short-covering that boosted gas price to emerge above important technical barrier at $3.205, but the price stayed capped by daily Tenkan-sen at 3.228, break of which is needed for fresh bullish signal.
COMMODITIES
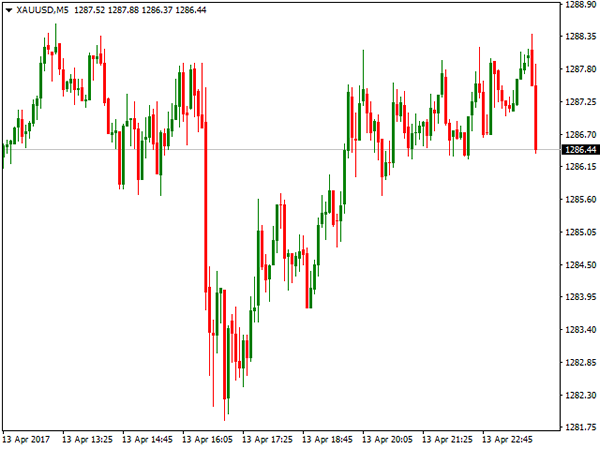
Spot gold was the top performer of the last week, gaining 2.55% for the week, marking the biggest weekly gains since the first week of June 2016. The yellow metal ended week just under fresh five-month peak at $1288, posted after strong bullish acceleration, boosted by rising tensions over US relations with Russia, after US attack at Syrian airbase and North Korean missile tests that both raised tensions in those regions. Adding to geopolitical concerns, the US military dropped its largest non-nuclear device ever-used in combat in Afghanistan on Tursday. Gold price was boosted by strong safe haven buying as investors abandoned riskier assets amid rising geopolitical tensions and moved into traditional safe haven gold. Last week's gold rally was also boosted by sharp fall of the dollar, caused by comments from US President Trump on Thursday, who said that the US currency is too strong, adding that he prefers low interest rates. Gold is very sensitive to the changes in US interest rates and reacted in swift acceleration after Trump's comment which added to existing support from geopolitical tensions. Rally took out Fibonacci 76.4% barrier at $1286 and now eyes next strong obstacle at $1293, top of weekly Ichimoku cloud, break of which would open way towards psychological $1300 barrier. Strong bullish sentiment is supported by firmly bullish technical studies, however, gold price may ease in coming sessions, in corrective action, signalled by overbought technical studies. Initial support lies at $1281, followed by $1279/70 support zone which should contain corrective dips.
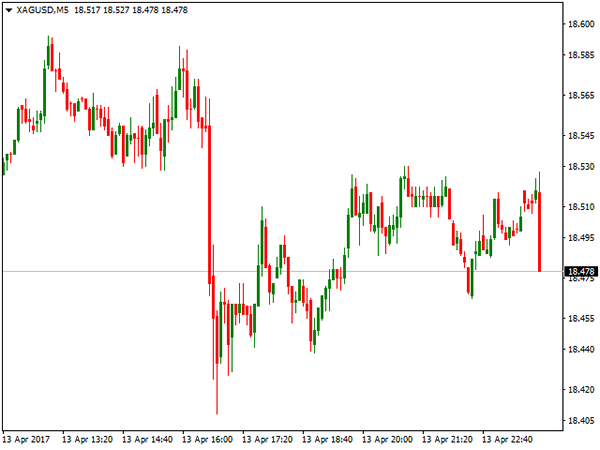
Spot Silver was up over 3% last week and hit fresh five-month high at $18.594 on Thursday, boosted by increase demand for precious metals in rising geopolitical tensions. Along with strong fundamentals Silver is supported by bullish technical studies, as last week's rally exceeded previous peak of Feb 27 at $18.478, on completion of $18478/$16817 corrective phase that signals continuation of bull-leg from $16817, Mar 15 correction low. Last week's rally has dented another strong technical resistance at $18.534 (weekly Ichimoku cloud top), firm break of which would trigger bullish extension towards psychological / Fibonacci barrier at $19.000.
Copper contract for May delivery fell 2.76% last week and hit three-month low at $2.5345 on Wednesday, on steady descend last week, after Peru increased copper output, upstaging top producer Chile. The world's second biggest producer Peru has benefited from lower production costs and untapped reserves. In addition, persistent concerns about weak demand from top metal consumers, such as China, kept copper price under pressure last week, extending broader weakness from mid-February's 2.8215 peak, the highest in nearly two years. Copper managed to recover some losses on Thursday, supported by weaker dollar and upbeat trade data from China that increased hopes for stronger demand. Technical studies remain bearish and see strong risk of further fall in copper price, as last week's fall also dented key technical supports at $2.5580 and $2.5400, firm break of which would trigger fresh bearish acceleration towards round-figure $2.5000 level and another strong technical support at $2.4530. On the flip side, $2.6345 marks strong resistance, regain of which would ease bearish pressure.
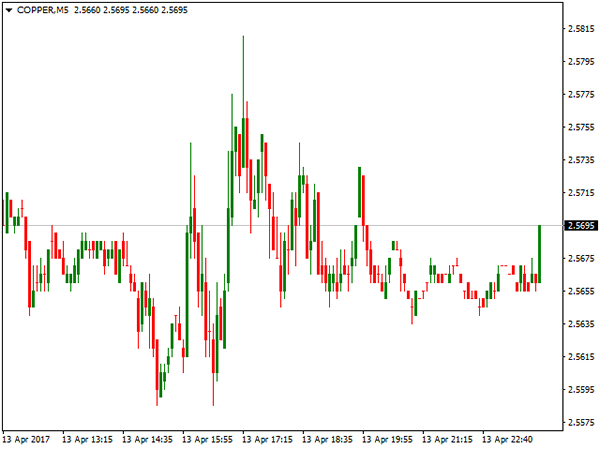
Copper contract for May delivery fell 2.76% last week and hit three-month low at $2.5345 on Wednesday, on steady descend last week, after Peru increased copper output, upstaging top producer Chile. The world's second biggest producer Peru has benefited from lower production costs and untapped reserves. In addition, persistent concerns about weak demand from top metal consumers, such as China, kept copper price under pressure last week, extending broader weakness from mid-February's 2.8215 peak, the highest in nearly two years. Copper managed to recover some losses on Thursday, supported by weaker dollar and upbeat trade data from China that increased hopes for stronger demand. Technical studies remain bearish and see strong risk of further fall in copper price, as last week's fall also dented key technical supports at $2.5580 and $2.5400, firm break of which would trigger fresh bearish acceleration towards round-figure $2.5000 level and another strong technical support at $2.4530. On the flip side, $2.6345 marks strong resistance, regain of which would ease bearish pressure.
INDICES
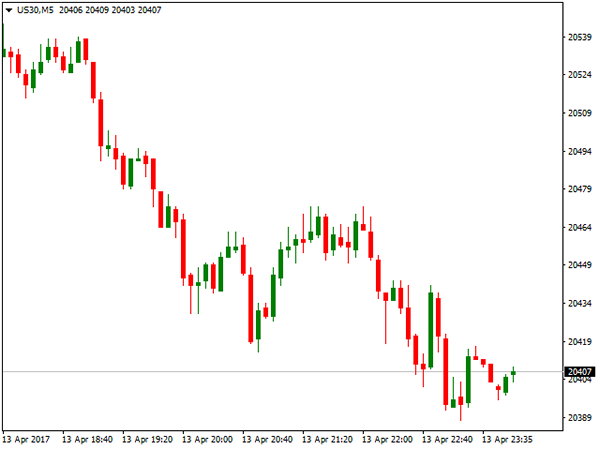
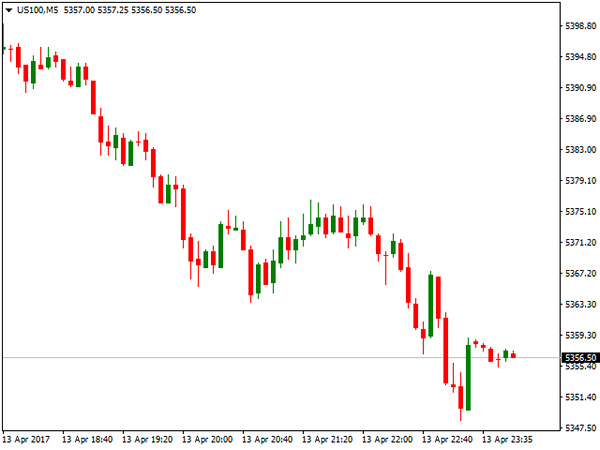
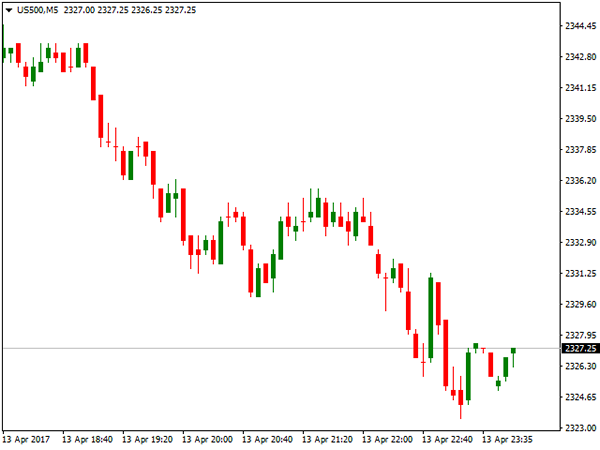
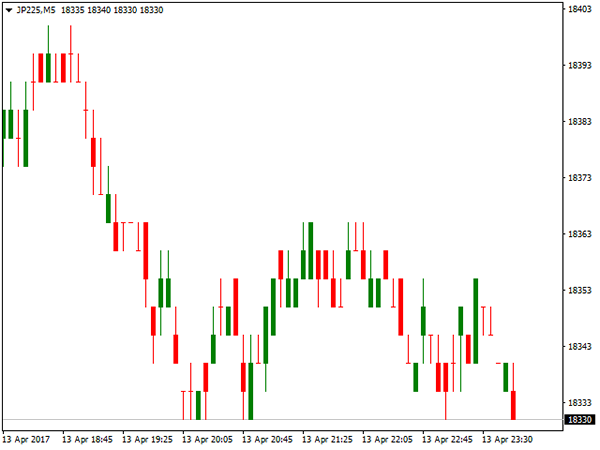
Wall Street ended week in red as US sticks fell on global risks that increased safe haven demand. Uncertainty amid growing crisis over Middle East and North Korea that brought relations between USA and Russia to the lowest levels since cold war, as news of a massive bomb being dropped by the United States in eastern Afghanistan on Thursday added to uncertainty and kept investors away from riskier assets and moving into safe haven. Dow Jones index fell almost 1% last week on return to strong 20400/20350 support zone; S&P 500 index was 1.02% down and Nasdaq100 dropped 1.16% for the week. Banking and tech sectors were among top negative drivers. Wells Fargo shares fell 3.3% and pulled down S&P 500 after the bank reported a drop in mortgage banking revenue. Berkshire Hathaway also reported that it had cut the stake in the bank. JP Morgan fell 1.2%; Citigroup was down 0.8% as banks revealed more evidence of a slowdown in loan growth that offset better-than-expected quarterly profits. The S&P 500 banks index closed at its lowest level since early December. Dow Jones extended its pullback from fresh record high at 21160, posted in March, after strong post US elections rally, signalling deeper correction of 17418/21160 Nov / Mar rally, which may accelerate in case current tensions escalate into conflict. S&P 500 index ended second week in red and approaches key short-term support at 2317, which could spark further weakness on break lower, as fragile geopolitical situation keeps stock indexes under pressure. Japanese stocks continued to move lower and slumped to fresh four-month low at 18295 last week, dragging Nikkei 225 index into fifth consecutive week in red. Nikkei was down 2.29% for the week, marking the biggest weekly loss since early Oct 2016. Firmer yen on strong safe haven buying kept the index under pressure. Strongly bearish technical studies threaten of further weakness, along with fragile geopolitical situation which keeps investors in firm risk-off mode.
FOREX
Another turbulent week for the money market is behind. Highlights of the week were comments from US President Donald Trump who described the dollar as too strong, saying that he prefers low interest rates and hinted he may keep Fed Chair Janet Yellen after her mandate ends in 2018. This sent dollar sharply lower against the basket of major currencies in late Wednesday, early Thursday's trading. Another event that shook markets was rising tensions between USA and Russia over the Middle East, after US army fired missiles on Syrian airbase and threatened of further attacks that triggered strong reaction from Moscow. Also, North Korea made several missile tests that brought US warships into region, with China also being involved, rising threats of escalation of the conflict. Tensions were raised after North Korea announced that they will respond with nuclear weapons on any attack. All these prompted investors to migrate from riskier assets into traditional safe haven instruments, such as Gold and Japanese yen, which were top gainers of last week.
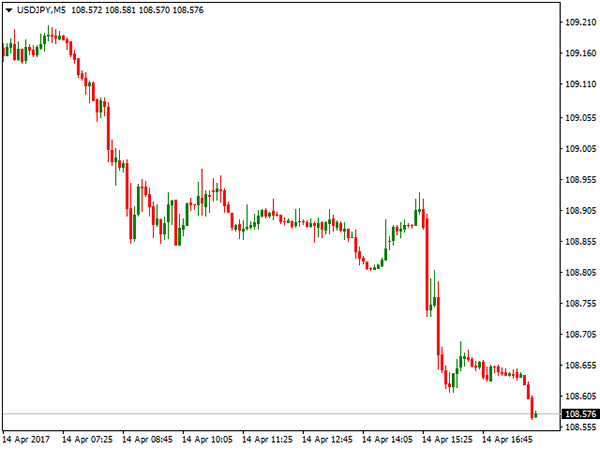
The dollar fell to the lowest levels since mid-November against Japanese yen, on strong bearish acceleration which broke below initial strong support at 110.00 zone and took out next key level at 108.70 (200SMA), below which weekly trading ended. The pair was down 2.6% for the week and seeing scope for further weakness on persisting geopolitical tensions and strong bearish technical studies.
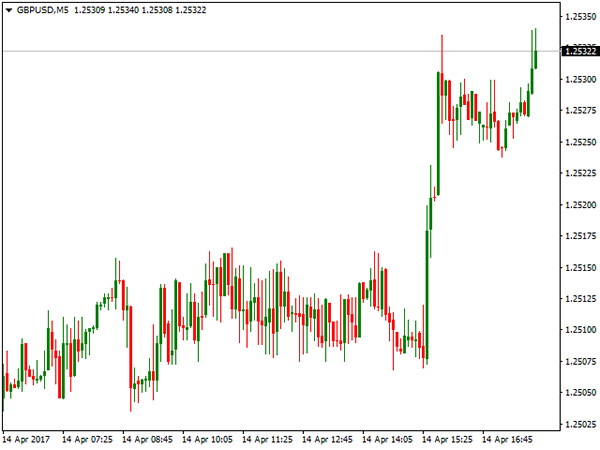
British pound benefited from strong economical data from UK released last week and rallied above 1.2500 against the dollar, gaining around 1.25% for the week. Cable bounced from weekly low at 1.2365 boosted by inflation data on Tuesday. Inflation remained steady in March, coming unchanged from the previous month at 2.3% but above forecasted 2.2%. Inflation is holding above BoE's 2% target which would gives good argument to those advocating for early rate hike. UK labour data, released on Wednesday, also showed good signals of stable growth, as average earnings jumped to 2.3% in March, beating forecast at 2.1% and February's 2.2% release. Although the unemployment rate remained unchanged at 4.7%, strong jump in jobless claims) 25.5K in Mar vs -10.2K forecast and -11.3K in Feb) suggests that UK employment have peaked and labour market may weaken as two-year Brexit process started.
EURUSD ended week around the mid-point of last week's rally from 1.0570 to 1.0677, but maintained positive sentiment, as the week ended positively. The single currency received initial support from release Eurozone's investors confidence that rose to 23.9 in March, beating forecast at 20.1. On Tuesday, ZEW economic sentiment showed that German investor morale brightened in April, hitting its highest level since August 2015, buoyed by a strong Q1 performance of the bloc's largest economy. Economic sentiment surged to 19.5 points in April from 12.8 in March and beating forecast at 13.2 points. In addition, fresh weakness of the dollar triggered by remarks from President Trump, pushed the Euro to the week's high at 1.0677, but the pair was unable to hold gains and rally stalled ahead of pivotal barrier at 1.0700, keeping hopes of stronger advance sidelined for now. Profit-taking on strong dollar shorts dragged the Euro back to 1.0625 zone where it ended weekly trading.
Australian dollar was among top winners, gaining 1.15% for the week, on bullish acceleration from week's low at 0.7472 to the highest traded at 0.7595. The Aussie received strong boost from Australian data that showed strong rise in Australian business condition which jumped in March to highs not seen since before the global financial crisis. Australia's NAB monthly survey showed index of business conditions climbed 6 points to +14 in March, which is well above long-run average at +5. The AUD USD pair broke above strong technical barriers at 0.7517 and 0.7550, generating strong bullish signal and managed to close for the week above 0.7550 (200SMA), after being additionally boosted by remarks of Donald Trump which undermined the US currency.