
Sample Category Title
RBA Released Minutes Of Its Last Meeting
'Although forward-looking indicators of labor demand continued to suggest an increase in employment growth over the period ahead, this has been true for some time without leading to an improvement in labor market conditions.' - Reserve Bank of Australia
Minutes of the Reserve Bank of Australia's meeting released on Tuesday showed that policymakers would mainly focus their attention on the country's labour and housing markets going forward. The Central bank pointed to a significant weakness in the labour market and rising underemployment, with the unemployment rate at a record high of 5.9%. Therefore, the RBA highlighted the need for consistent monitoring of the labour markets. At the end of its latest meeting, the Bank voted to keep cash rate unchanged at a record low pf 1.50%, stating that it would continue to seek ways to ensure stronger investment and hiring in the non-energy-related sectors. The Central bank expressed also concerns over surging housing prices in Sydney and Melbourne. As to inflation, the headline inflation rate is set to rise 2% in 2017 amid higher oil prices, while the return of core inflation to the RBA's 2% inflationary target would probably take much longer. A report released last week showed that growth in the property market offset household income growth, pointing to overheating in the market. However, the Bank said that higher oil prices provided a significant boost to Australia's national income during the first quarter of 2017.
EUR/AUD Daily Outlook
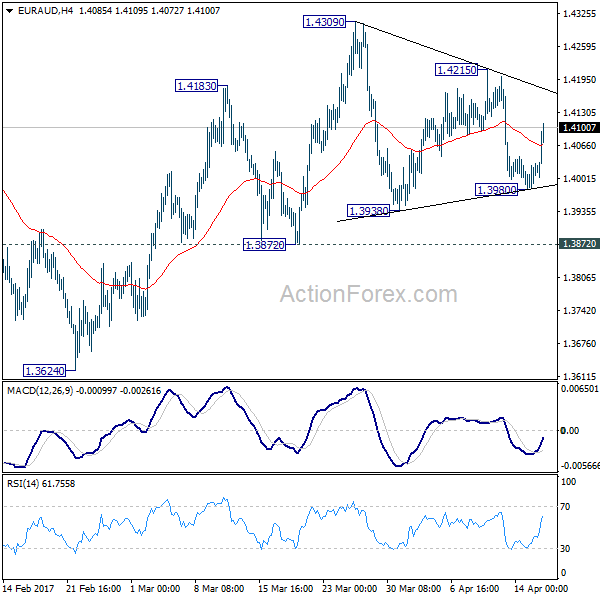
Daily Pivots: (S1) 1.3992; (P) 1.4011; (R1) 1.4041; More...
Intraday bias in EUR/AUD remains neutral as sideway trading continues in range of 1.3872/4309. We continue to favor the case that larger fall from 1.6587 is completed at 1.3624, after defending 1.3671 key support. And the trend is reversing. On the upside, break of 1.4215 minor resistance will turn bias to the upside for 1.4309. Break there will finally resume whole rise from 1.3624 and target 1.4721 key resistance next. On the downside, however, sustained break of 1.3872 will dampen our view of trend reversal. In that case, intraday bias will be turned back to the downside for retesting 1.3624 low, with prospect of extending the larger down trend.
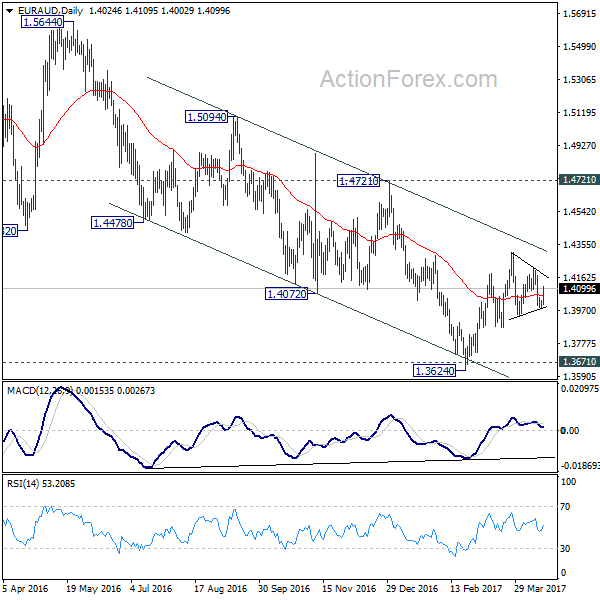
In the bigger picture, price actions from 1.6587 medium term top are viewed as a corrective pattern. Such correction could be completed after testing 1.3671 key support. Break of 1.4721 cluster resistance (38.2% retracement of 1.6587 to 1.3624 at 1.4756) should confirm this case and target 61.8% retracement at 1.5455 and above. Overall, we'd expect the up trend from 1.1602 to resume later. However, sustained break of 1.3671 will invalidate our bullish view and would turn extend the fall from 1.6587 towards 1.1602 long term bottom.
Mood Of New York State Manufacturers Deteriorates Markedly In April
'As this index is very noisy, it is hard to understand what these massive moves up or down mean - however, this regional manufacturing survey is normally one of the more pessimistic.' - Steven Hansen, Econintersect
Manufacturing activity in the New York State fell markedly in April, raising concerns over economic growth in the Q2 of 2017, a survey revealed on Monday. The New York Federal Reserve reported that its Empire State Manufacturing Index came in at 5.2 for April, following the preceding month's reading of 16.4. Meanwhile, market analysts anticipated a slight drop to 15.2 points during the reported month. Data showed that 35% of the survey respondents said that business conditions had improved, while 30% claimed that they has worsened over the reported month. The New Orders Index plunged 14 points to 7.0, while the Unfilled Orders Index rose slightly to 12.4. On the positive side, the Employment Index jumped to its two-year high of 13.9 points in April, confirming the view that the US labour market is at or near full employment. The survey respondents also pointed to modestly rising input prices and increasing working hours. The respondents also expressed optimism of the long-term prospects of the US economy, with the Future Situation Index rising three points to 39.9 and the Future New Orders and Shipments Indexes decreasing slightly. Moreover, both Future Capital Expenditures and Future Technology Spending Indexes surged to 27.7 and 15.3 points, respectively.
EUR/GBP Daily Outlook
Daily Pivots: (S1) 0.8456; (P) 0.8473; (R1) 0.8486; More...
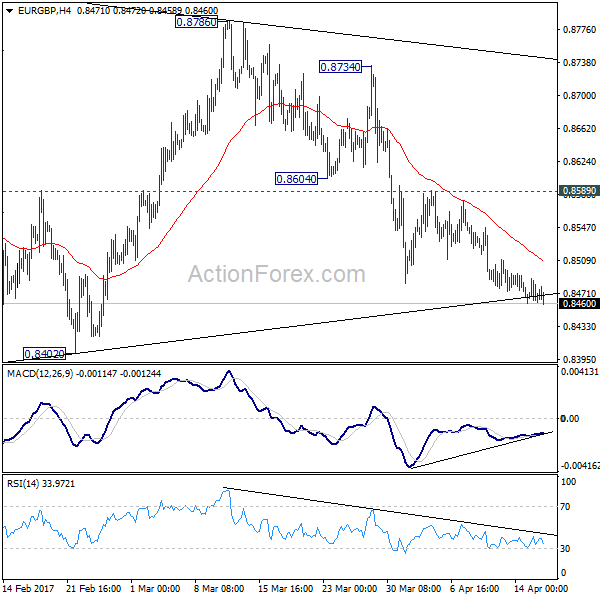
Intraday bias in EUR/GBP remains on the downside for 0.8402 support. As noted before, consolidation from 0.8303 could be completed at 0.8786. Fall from 0.8786 is developing as the third leg of the correction from 0.9304. Decisive break of 0.8402 support will confirm our bearish view and target 0.8303 and below. At this point, we'd expect front support from 0.8116/20 cluster support to contain downside and complete the correction from 0.9304. On the upside, break of 0.8589 resistance is needed to indicate short term bottoming. Otherwise, outlook will stay cautiously bearish in case of recovery.
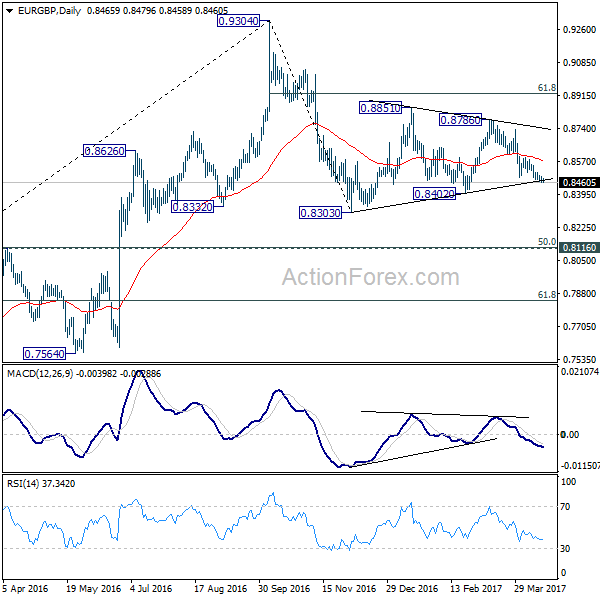
In the bigger picture, price actions from 0.9304 are viewed as a medium term corrective pattern. Such decline is likely ready to resume and should make a new low below 0.8303. At this point, we'd expect strong support from 0.8116 cluster support (50% retracement of 0.6935 to 0.9304 at 0.8120) to contain downside. Rise from 0.6935 (2015 low) will resume at a later stage to 0.9799 (2008 high). However, sustained break of 0.8116 could bring deeper decline to next key support level at 0.7564 before the correction completes.
Currencies: USD Decline To Slow?
Sunrise Market Commentary
- Rates: Consolidation as core bonds entered overbought conditions?
Sunday's first round of the French presidential elections and geopolitical concerns are set to dominate trading this week. It should underpin core bonds via safe haven slows though the rally could lose some steam with the Bund and US Note future in overbought conditions. - Currencies: USD decline to slow?
Yesterday, the dollar (USD/JPY and DXY) rebounded after comments from US Treasury Secretary Mnuchin who said that a strong currency was positive longer term. Today, the eco calendar is thin. A sustained bottoming out process of the dollar probably needs support from higher US yields. The topside of EUR/USD looks well protected ahead of the French elections
The Sunrise Headlines
- US equities ended yesterday on a strong foot, recording gains of nearly 1%. Overnight, most Asian stock markets gain ground as well though risk sentiment is less ebullient.
- US Treasury secretary Mnuchin has conceded that the timetable for ambitious tax reforms is set to slip following setbacks in negotiations with Congress over healthcare. He also downplayed Trump's weak dollar comments.
- International observers said a closely contested vote on Turkey's presidential powers contravened Turkish law by changing rules on ballot-counting at the last minute, one of several alleged voting irregularities prompting criticism.
- Vice Fed chair Fischer said he doesn't see a replay of the so-called taper tantrum of 2013 as the central bank rolls out its plan for reducing its big balance sheet.
- North Korea's UN envoy warned that the US has pushed the Korean peninsula to the "brink of war", as President Trump and his administration kept up their rhetoric against Kim Jong Un's regime.
- Marine Le Pen and Emmanuel Macron's support rose half a point to 23% and 24%, respectively, Elabe's latest poll showed. Francois Fillon and Jean-Luc Mélenchon each slipped half a point to 19.5% and 18%.
- Today's eco calendar contains US housing starts, building permits and industrial production. Kansas city Fed George is scheduled to speak and Bank of America, Goldman Sachs and Yahoo are among the companies who publish Q1 earnings
Currencies: USD Decline To Slow?
Dollar decline to slow?
On Monday, USD equities and by comments from US Treasury Secretary Mnuchin supported the dollar. The FinMin said he agreed with president Trump that the strength of the dollar was negative for exports, but added that the currency's strength was a positive longer term. USD/JPY returned to the 109 area after touching a correction low in the 108.13 area in thin trading early in the session. The picture of the dollar against the euro remained a bit different. The euro rebounded against the dollar even as the decline in US bond yields halted. A short-squeeze in EUR/JPY (due to a better US equities) probably was the driver behind the move. EUR/USD closed the session at 1.0643 (from 1.0618 on Friday evening).
Overnight, Asian equities trade with modest gains. USD/JPY is holding off the recent lows and is changing hands in the 109 area. Markets are keeping an eye at meetings between US Vice President Pence and the Japanese PM Abe and FinMin Aso. There might be some frictions between the two countries on trade issues, but the focus will be on a joined strategy against North Korea. EUR/USD shows no clear trend, holding tight in the mid 1.0650 area.
Today, the US the March housing data are expected mixed. Starts are expected to have dropped 3% M/M to 1250K (annual rate while permits are expected to have risen modestly by 2.8% to 1250K.That would keep starts and permits near the cycle highs. The upward trend isn't broken, but signs of some moderation become gradually visible. Industrial production is expected to have rebounded in March, rising by 0.4% M/M. The more cyclical manufacturing output is expected flat in March after a strong 0.5% M/M in February. All in all, the data won't have too much impact on USD trading.
Yesterday, there were first tentative signs that the recent downward correction of the dollar is losing momentum. USD/JPY and the trade-weighted dollar rebounded off the recent low. For now, we don't draw any firm conclusions yet. A sustained outperformance of the dollar probably needs support from a bottoming/rise of US bond yields. We're not that far yet. So, we look for confirmation that the decline/correction of USD/JPY (and of DXY) has run its course. Of late, EUR/USD was an exception to the overall trend of USD weakness. The pair hovers in a tight range in the 1.06 area
Political uncertainty in Europe (mainly due to the French elections) counterbalances the overall USD decline even as interest rate differentials between the dollar and the euro and narrowed. In a day-to-day perspective, we don't see much upside for EUR/USD as long as uncertainty on the French elections reigns.
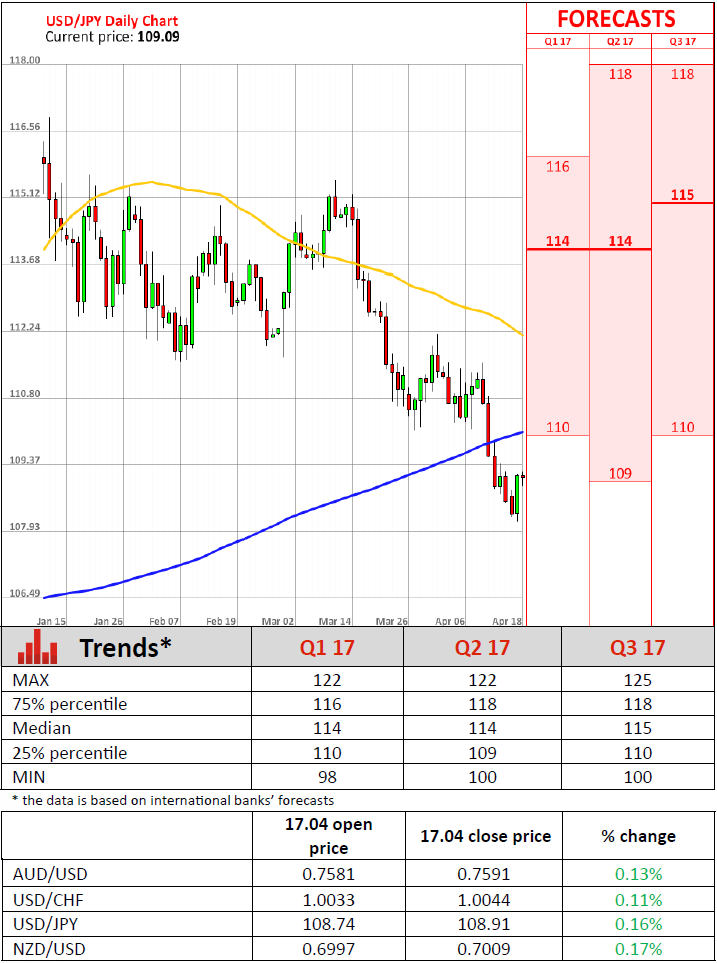
Technicals: USD/JPY decline slows EUR/USD neutral
From a technical point of view, USD/JPY broke through the 110 key support, after having failed to regain the 111.36/60 previous range bottom. We downgraded our USD/JPY assessment to bearish, as long as the pair does not regain and sustains above 112.20 (neckline ST double bottom). Next key support (62% retracement) comes in at 107.18. EUR/USD extensively tested the topside of the MT range (1.0874/1.0906 area) late March, but the test was rejected. EUR/USD returned lower in the 1.0875/1.05 trading range with the odds for a test of the downside of the range. However, real downside break is difficult as the dollar trade rather weakish of late.
EUR/USD: stabilizes in the 1.06 big figure. Political uncertainty weighs, but no strong dollar momentum
EUR/GBP
Sterling holding near the recent highs
Of late, EUR/GBP drifted cautiously lower and this trends remained in place yesterday. Technical considerations in a very thin market dominated trading. EUR/GBP touched a minor correction low in the 0.8461 area and closed the session at 0.8470 (from 0.8478 on Friday). Sterling also held strong against the dollar even as the US currency showed tentative signs of bottoming. Cable closed the session at 1.2565.
There are no important eco data in the UK today. So, sterling trading will be driven by technical considerations. With both the dollar and the euro trading soft of late, sterling recorded some by default gains of late. However, both in EUR/GBP and cable there was no really strong sterling momentum. EUR/GBP drifted cautiously lower, but the magnitude of the decline remained modest, awaiting a clear move in the euro (French elections) or some high profile news from Brexit. For now, we don't see a change of this sterling scenario.
We have a neutral short-term bias on EUR/GBP. The EUR/GBP 0.88/0.84 range should guide trading for now. Early April, the sterling rally/short-squeeze ran slowed, but sterling held near the recent highs. We see no trigger for a real change in sentiment yet. Longer term, Brexit-complications remain a potential negative for sterling. The BoE won't raise rates anytime soon
EUR/GBP: gradual downtrend continues
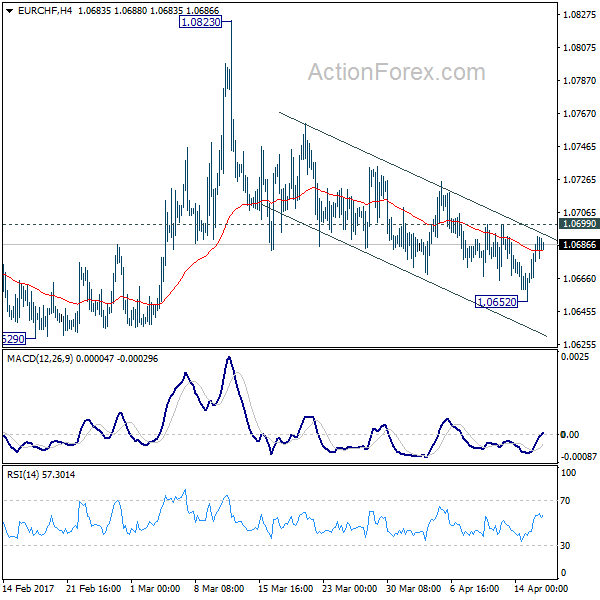
EUR/CHF Daily Outlook
Daily Pivots: (S1) 1.0666; (P) 1.0679; (R1) 1.0700; More...
Intraday bias in EUR/CHF is neutral for the moment for consolidation above 1.0652 temporary low. With 1.0699 minor resistance intact, deeper decline is still expected. below 1.0652 will target 1.0620/0629 support zone. Decisive break there will confirm resumption of whole fall from 1.1198. In that case, EUR/CHF should target next long term fibonacci level at 1.0485. On the upside, break of 1.0699 minor resistance will argue that choppy fall from 1.0823 has completed and turn bias back to the upside.
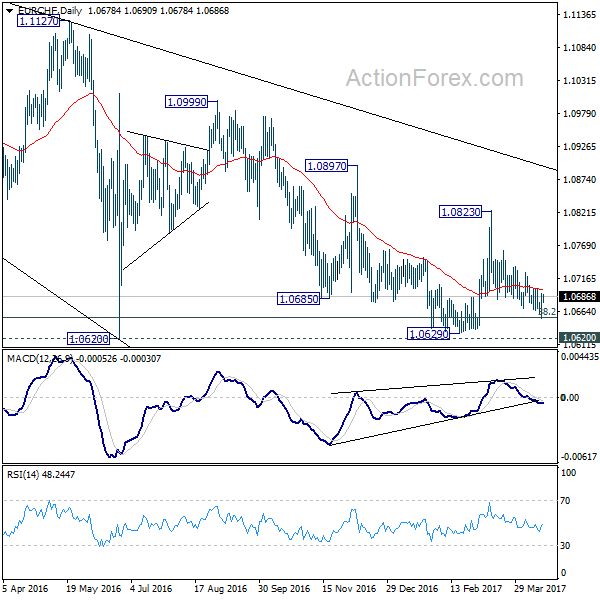
In the bigger picture, the decline from 1.1198 is seen as a corrective move. Current development suggests that it's not completed yet. Sustained trading below 38.2% retracement of 0.9771 to 1.1198 at 1.0653 will target 50% retracement at 1.0485. In any case, break of 1.0823 resistance is needed to be the first indication of reversal. Otherwise, deeper fall is still expected even in case of recovery.
Elliott Wave View: Gold Pullback Completed
Short term Elliott Wave view in Gold (XAUUSD) suggests that cycle from 4/10 low (1246.92) is unfolded as an impulse Elliott wave structure where Minutte wave ((i)) ended at 1257.2, Minutte wave (ii) ended at 1250.8, Minutte wave (iii) ended at 1279.75, Minutte wave (iv) ended at 1271.69 and Minutte wave (v) of (a) ended at yesterday's peak 1295.6. Below from there metal has started the Minutte wave (b) pullback to correct 4/10 (1246.9) cycle and that could be done already in 3 swings at earlier low 1281, where Sub minutte wave a ended at 1285.6 and Sub minutte wave b ended at 1292.6. However metal needs to break 1295.6 peak first for final confirmation of next leg higher started, If it fails to rally from here then Double correction from the peak within the Minutte wave (b) pullback can't be ruled out yet before the rally resume, where we would like to be buyer's again. Now as far as trading above earlier low 1281 and more importantly as far as pivot from 4/10 low remains intact metal has scope to resume the upside. We don't like selling the metal into the pullbacks & favors the upside in metal as far as pivot from 4/10 low remains intact.
Gold 1 Hour Elliott Wave Chart
Market Update – Asian Session: RBA Minutes Cautious Amid Softer Employment And Rising Household Credit
Asia Mid-Session Market Update: China top-tier cities property price growth slows; RBA minutes cautious amid softer employment and rising household credit
US Session Highlights
(BR) Brazil Feb Economic Activity Index (Monthly GDP) M/M: 1.3% v 0.5%e; Y/Y: -0.7% v -2.4%e
(US) APR EMPIRE MANUFACTURING: 5.2 V 15.0E; New Orders: +7.0 v +21.3 prior; Prices Paid: +32.8 v +31.0 prior
(US) APR NAHB HOUSING MARKET INDEX: 68 V 70E
(US) Treasury Sec Mnuchin: timeline to get tax reform by Aug is "highly aggressive to not realistic at this point"; schedule has been slowed by the healthcare bill passage problems - FT
Stocks gained momentum again to start the week off with a rally after last week's negative performance. Investors began to see equity as relatively underpriced at the open, and markets lifted higher into the close. Best performing sectors were Financials and Consumer Discretionary, gaining 1.6% and 1% respectively.
US markets on close: Dow +0.9%, S&P500 +0.9%, Nasdaq +0.9%
Best Sector in S&P500: Financials
Worst Sector in S&P500: Energy
Biggest gainers: NVDA +3.9%; MTB +3.9%; ARNC +3.1%
Biggest losers: INCY -10.5%; DISH -5.8%; LLY -4.1%
At the close: VIX 14.7 (-1.3pts); Treasuries: 2-yr 1.20% (flat), 10-yr 2.25% (+2bps), 30-yr 2.91% (+3bps)
US movers afterhours
CAB: Enters into revised transaction agreements in connection with Bass Pro Shops merger; CAB to get $61.50/shr; +7.5% afterhours
RIGL: Submits New Drug Application to FDA for Fostamatinib in Chronic ITP; +5.0% afterhours
NFLX: Reports Q1 $0.40 v $0.38e, R$2.64B v $2.64Be; Guides Q2 $0.15 v $0.23e; Total streaming net adds 4.95M v 7.05M q/q v 5.2M forecast; +1.4% afterhours
UAL: Reports Q1 $0.41 (adj) v $0.37e, R$8.42B v $8.36Be; +1.0% afterhours
CUDA: Reports Q4 $0.19 v $0.15e, R$89.3M v $88.6Me; Total active subscribers 321K v 309K q/q; +15% y/y; -3.9% afterhours
Politics
(US) President Trump to outline H-1B visa changes tomorrow
(JP) Asahi poll shows Japan Cabinet approval rating at 50%, nearly unchanged from prior
Key economic data
(CN) CHINA MAR PROPERTY PRICES M/M: RISE IN 62 OUT OF 70 CITIES VS 56 PRIOR; Y/Y: RISE IN 68 OUT OF 70 CITIES V 67 PRIOR
Asia Session Notable Observations, Speakers and Press
US equity markets traded higher after 3 consecutive down days, though sentiment in Asia is more subdued. Financials were the best performing sector on Wall St, with rising Treasury rates on the long end widening the yield curve. Technical factors have been attributed in part for the bullish reversal, though commentary from US Treasury Sec Mnuchin late in the day contributed to US markets going out on their highs. Mnuchin said that while the timeline for getting tax reform done by August is "highly aggressive", he did expect tax system changes some time this year, also adding that the border adjustment tax is just one of many elements considered in raising $1T for the tax program. Mnuchin also talked up USD after Trump's remarks last week that the greenback has gotten too strong, noting that strength of USD over the long term is a positive. USD/JPY rose over 50pips on the comments above ¥109 level and then extended those gains above ¥109.20. NZD/USD found support at 0.70, while AUD/USD fell about 40pips below 0.7550.
Australia's ASX200 is among the worst performing indices in Asia, falling over 1% to a 2-week low below 5,830. Mining shares are weighed down by more selling in iron ore, with Dalian gauge falling over 3% early in the day. RBA April policy meeting minutes echoed the cautious stance displayed in the original statement, indicating policymakers had to balance some recent deteriorating in employment conditions with rising household debt in calibrating their policy stance. Board plans to continue monitoring labor and housing conditions over the coming months, particularly the overheating Melbourne and Sydney markets.
In China, property names are modestly lower, while declines in financials, gaming, and energy stocks weighed on returning from holiday Hang Seng index. Mar property prices were up in 62 out of 70 cities m/m and 68 y/y - up from 56 and 67 respectively in the prior month. Across the top 70 cities, prices were up 0.6% m/m v 0.3% prior, though y/y rate of growth slowed to 11.3% v 11.8% prior. Beijing y/y price growth slowed to 20.6% v 22.1% prior and that of Shanghai slowed to 19.8% v 21.1% prior, with Stats Bureau noting the impact of property curbs for tier-1 cities unveild in recent weeks.
China
(CN) China Insurance Regulatory Commission (CIRC) to start checking credit, guarantee businesses of insurers that help offer financing to sell bonds as well as trust and fund products
(CN) China regulators hopes listed companies to cool financing actions - Chinese press
(CN) JPMorgan raised its China 2017 GDP target to 6.7% from 6.6% following stronger than expected Q1 - Chinese press
Japan
(JP) US Commerce Sec Ross: Too soon to talk about FTA with Japan; made good progress in establishing dialogue and reaching mutual understanding
(JP) Moody's: Japan economic momentum is building due to rising exports and expected fiscal support
Australia/New Zealand
(AU) Australia govt has investigated the possibility of putting a limit on the number of properties an investor can buy - AFR
Korea
(KR) South Korea govt think tank (KDI) raises 2017 GDP target to 2.6% from 2.4%; Sees 2018 GDP at 2.5%
(KR) South Korea Ministry of Trade, Industry, and Energy: March auto exports value rose 4.1% y/y to $4.12B, 2nd straight month of increase
(KR) China reiterates opposition to South Korea's THAAD anti-missile system - press
Asian Equity Indices/Futures (00:00ET)
Nikkei +0.2%, Hang Seng -0.9%, Shanghai Composite -0.1%, ASX200 -1.2%, Kospi -0.2%
Equity Futures: S&P500 -0.1%; Nasdaq +0.1%, Dax +0.2%, FTSE100 -0.1%
FX ranges/Commodities/Fixed Income (00:00ET)
EUR 1.0635-1.0655; JPY 108.90-109.25; AUD 0.7555-0.7595; NZD 0.7000-0.7015
June Gold -0.5% at 1,285/oz; May Crude Oil -0.1% at $52.58/brl; May Copper -0.5% at $2.58/lb
(CN) PBOC SETS YUAN MID POINT AT 6.8849 V 6.8785 PRIOR (3rd consecutive weaker setting)
(CN) PBOC to inject combined CNY80B v zero prior
(JP) Japan MoF sells ¥2.00T in 0.1% 5-year JGB bonds; avg yield -0.160% v -0.118% prior; bid-to-cover 3.28x v 2.86x prior
Asia equities/Notables/movers
Australia
TPM.AU TPG Telecom -17.6% (share sales)
NCM.AU Newcrest Mining -4.4% (Cadia cannot meet guidance, gold price lower)
FMG.AU Fortescue -5.5%, BHP.AU -2.0%, RIO.AU -1.7% (iron ore falls over 3%)
FBU.AU Fletcher Building +1.4% (potential sale of building co)
HUB.AU Hub24 +5.8% (Q3 result)
TAH.AU Tabcorp Holdings -0.9% (divestment)
TPG.AU TPG Telecom -17.5% (institutional offering)
PLS.AU Pilbara Minerals -12.0% (project update)
AGO.AU Atlas Iron -16.7% (Q3 result)
AZJ.AU AUrizon -4.0% (Cuts guidance on cyclone impact)
Japan
4569.JP Kyorin Co -0.8% (annual result speculation)
Taiwan
2324.TW Compal Electronics +1.5% (speculated to assemble Apple watch)
China
000503.CN Searainbow Holding -1.6% (guidance)
600048.CN Poly Real Estate Group Co -1.5% (annual result)
Hong Kong
347.HK Angang Steel -3.7% (profit warning)
2338.HK Weichai Power +2.9% (profit alert)
124.HK Kingway Brewery Holding -2.7% (profit warning)
1898.HK China Coal Energy -2.2% (Mar result)
1889.HK Wuyi International Pharmaceutical Co -3.6% (annual result)
921.HK Hisense Kelon Electrical Holdings +8.8% (quarterly result)
390.HK China Railway Group -0.4% (Q1 result)
210.HK Daphne International -1.3% (Q1 result)
1816.HK CGN Power Co -2.9% (Q1 result)
Stock Markets Have Been A Bit On Retreat Over The Past Week
Market movers today
Focus this week continues to be on political risks. The situation regarding North Korea (see below) as well as the first round of the French presidential elections on Sunday will be key drivers. It looks to be a close race among the leading candidates in the first round, while the probability of t he National Front 's Marine Le Pen winning a second round is st ill put at only around 25% by betting companies, see Reuters.
There are no big movers on the agenda today but US housing starts and US manufacturing product ion are due out . The main releases for the rest of the week will be Euro Flash PMI on Friday and the US Philadelphia Fed index on Thursday.
Selected market news
Geopolitical risks have moved to the fore recently with especially tensions around North Korea heating up. The US has stepped up its pressure on the regime in Pyongyang and sent a clear signal it wants the missile tests by North Korea to stop. The US has urged China to act to put more pressure on the North Korean leader Kim Jong-un in order to end the missile programme, while being clear that the US will act alone if China refrains from this. The US military strike in Syria has been highlighted by leading members of the US administ ration as a sign t hat US President Trump does not st and back from taking difficult decisions. China's response so far has been mainly that only diplomacy can solve North Korea tensions – a message t hat was repeat ed by China's foreign minister WangYi last night . At the same time, it is not clear how much influence China has on North Korea. According to Chinese sources, North Korea did not respond to a request from China to meet earlier this month, see Bloomberg.
It is not uncommon for risk factors to move to the top of the financial market's agenda when the reflation theme loses some tailwind. See Strategy: Risk factors move to the fore as business cycle peaks, 7 April 2017. As we have argued recently, the global reflat ion theme is set to lose steam as we see signs of the business cycle slowing and global inflation peaking in Q1. More evidence of a cyclical peak in the US was seen in the Empire business confidence index yesterday, which fell for the second month in a row to the lowest level since November.
Stock markets have been a bit on retreat over the past week but saw a decent rebound yesterday. We expect the bull market in stocks to take a pause in coming months. Bond yields have continued to move lower on a flight -to-safety bid and loss of steam in the reflat ion theme.
China data released yesterday surprised on the upside: Q1 GDP rose 6.9% y/y and indust rial product ion increased to 7.6% y/y in March from 6.0% y/y in February. However, leading indicators as well as global metal prices point to a slowdown in momentum. Iron ore prices have cont inued to decline recent ly, now touching the lowest level since November 2016.
Labour Market Somewhat Weaker Than Expected: RBA Minutes
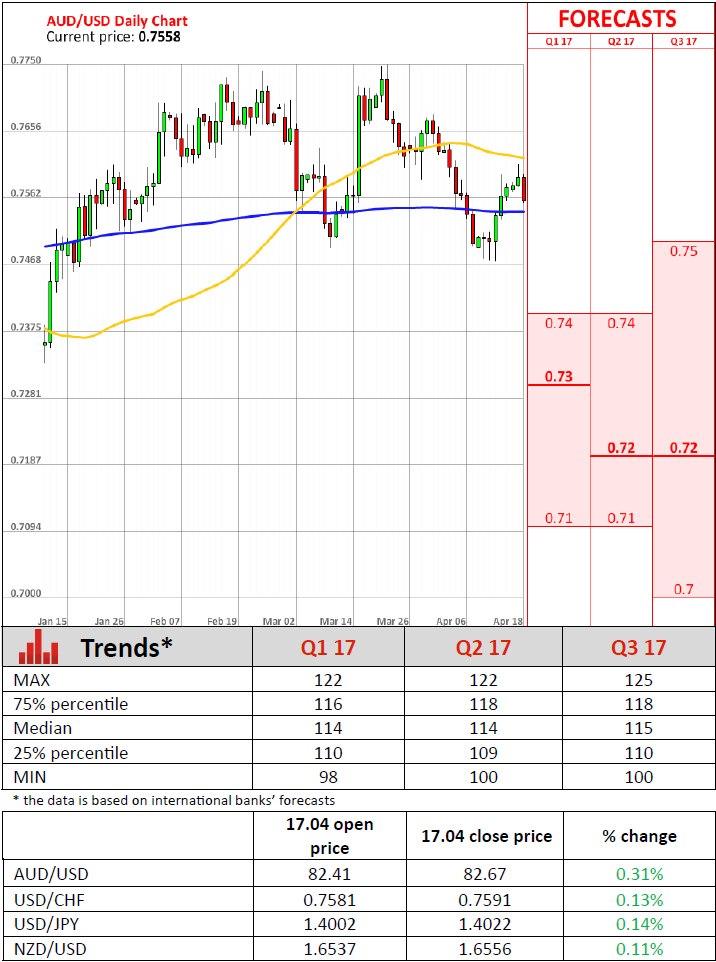
For the 24 hours to 23:00 GMT, the AUD rose 0.08% against the USD and closed at 0.7586.
Yesterday, in China, Australia's largest trading partner, gross domestic product (GDP) surprisingly expanded 6.9% on an annual basis in 1Q 2017, driven by higher government spending, thus indicating that world's second largest economy ended the first quarter on a stronger footing. The nation's economy expanded 6.8% in the prior quarter, while markets anticipated for the GDP to climb 6.8%. Moreover, the nation's industrial production jumped 7.6% on an annual basis in March, notching its highest level since December 2014. Market anticipation was for industrial production to gain 6.3%, compared to a rise of 6.0% in the previous month. Further, the nation's retail sales surged 10.9% on an annual basis in March, compared to a similar rise in the prior month, while investors had envisaged for an advance of 9.7%.
LME Copper prices declined 0.5% or $30.0/MT to $5655.0/MT. Aluminium prices declined 0.9% or $17.0/MT to $1890.0/MT.
In the Asian session, at GMT0300, the pair is trading at 0.7557, with the AUD trading 0.38% lower against the USD from yesterday's close, after minutes of the Reserve Bank of Australia's (RBA) recent meeting revealed growing concern about Australia's jobs and housing market.
According to minutes, policymakers stated that Australia's labour market is somewhat weaker than expected and warned that the domestic labour and housing markets warranted “careful monitoring” over coming months. However, board members also noted that the Australian economy likely made steady progress in the first quarter of 2017.
The pair is expected to find support at 0.7536, and a fall through could take it to the next support level of 0.7515. The pair is expected to find its first resistance at 0.7594, and a rise through could take it to the next resistance level of 0.7631.
Going ahead, investors will focus on Australia's Westpac leading index for March, slated to release overnight.
The currency pair is trading below its 20 Hr and 50 Hr moving averages.
