Sample Category Title
Trade Idea: GBP/JPY – Buy at 136.00
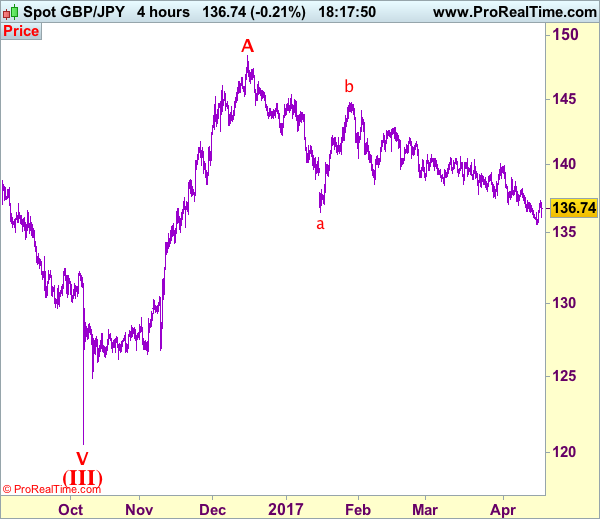
GBP/JPY - 136.75
Recent wave: Medium term low formed at 120.50 and (A)-(B)-(C) major correction has commenced with (A) leg ended at 148.45, hence wave (B) is unfolding for retreat to 131.00-10.
Trend: Near term down
New strategy :
Buy at 136.00, Target: 138.00, Stop: 135.40
Position: -
Target: -
Stop:-
Sterling found good support at 135.60 early last week and staged a strong rebound from there, suggesting a temporary low has been formed there and consolidation with mild upside bias is seen for this move to bring retracement of recent decline, above resistance at 137.30-35 would add credence to this view, then further subsequent gain to 138.00 and possibly test of resistance at 138.25 would be seen, however, near term overbought condition should limit upside to resistance at 138.70 and price should falter well below resistance at 139.00.
Our preferred count is that larger degree wave V with circle is unfolding from 251.12 with wave (I) 219.34, (II): 241.38 and wave (III) is subdivided into 1: 192.60, 2: 215.89 (23 Jul 2008) and wave 3 ended at 118.87 earlier in 2009. The correction from there to 162.60 is wave 4 which itself is a double three and is labeled as first a-b-c ended at 151.53, followed by wave x at 139.03, 2nd a ended at 162.60, 2nd b at 146.75 and 2nd c leg of wave 4 ended at 163.00. Therefore, the decline from 163.00 to 116.85 is now treated as wave 5 which also marked the end of larger degree wave (III), hence wave (IV) major correction has commenced for retracement of the wave (III) from 241.38 and upside target at 183.95-00 (50% Fibonacci retracement of the wave (II) from 241.38) had been met, a drop below 160.00 would suggest wave (IV) has ended at 195.85, bring decline in wave (V) for initial weakness to 130 (already met) and 120.
On the downside, although initial pullback to 136.00-10 cannot be ruled out, reckon 135.70-75 would contain downside and bring another rise later. Only below said support at 135.60 would abort and signal recent decline has resumed, then further fall to 135.00, then 134.40-50 would follow.
Asia’s Equity Mixed Bag As GBP Stay’s Away From May
The Nikkei bucks the trend Australian and China indices wilt.
Another game of two halves in Asia today albeit in still subdued post-Easter trading. Treasury Secretary Mnuchin's strong dollar comments overnight saw U.S. equities rally along with the greenback. A perceived lightning in regional tensions in Asia should have been the green light for a sea of green today, but only Japan and South Korea's Kospi, in particular, managed to benefit from the good news.
As we roll into a returning Europe, the signals don't look so rosy. Europe continues to be weighed down by French election anxiety and the U.K Prime Minister, Theresa May, has announced she will make a statement outside Number 10 at 1015 GMT this morning. There is no visibility on what it will be about, but the FTSE doesn't like it, down 1 % to February lows in early trading.
Nikkei 225
The Japan 225 had a good day as a stronger USD/JPY, and lower regional tensions boosted exporter stocks on the Nikkei. It has given part of this back late in the afternoon as Europe opens in the red.
Support lies at 18,280, the year's lows with the 200-day moving average behind that at 18,020.
Resistance rests at 18,6250 and then 18,955.
ASX 200
The Australia market returned to work today, but there was no Easter cheer as the index proceeded directly South. The RBA minutes highlighted worries about an overheated housing market and a weak labour market. Iron ore and rebar futures fell again in China marking a miserable week for commodities. Unsurprisingly, resource companies and banks were the hardest hit in Australia today.
The ASX is testing support at 5825 with a break opening up a move to the 5675/5700 region on the charts. This marks the March lows and the 100-day moving average.
Resistance lies at 5890 and then the month's highs at 5950.
HONG KONG
The Hang Seng also returned to work today, but again sentiment locally overrode, and geopolitical feel good factor, falling over 1.4%. Although yesterday's China data was good, the feeling persists in the local market that yesterday may be the best of it for a while and that growth will slow over the remainder of the year as Government stimulus runs its course.
Worries also persist around property cooling measures on the mainland and PBOC tightening going forward. Transport and property companies fell today.
The Hang Seng finishes on its lows in an ominous technical picture. Support is here at 23,820 initially with a break implying a move to the 23,400 area.
Resistance is well defined on the daily charts at 24470 followed by the years high at 24,580.
FRANCE 40
France has also been 'an vacance,' and its return has not been pretty, down 1.1 % in early trade. Saturday's first round voting gets murkier the closer it gets. Investors are saying 'zut alor' and running for the door. With four candidates from all extremes of the political spectrum running neck and neck now, the old adage that France changes by revolution, not evolution, has gained more poignancy.
The CAC-40 is testing trendline support as I write at 5000. This line goes all the way back to December last year. The next support being 4930, the March lows.
Resistance intra-day sits at 5100 and then the year's highs at 5150.
UK 100
The FTSE 100 is down 1% in early trading along with a sell-off in GBP/USD which has fallen from 1.2600 to 1.2535. PM May is due to make an unexpected statement on the steps of Downing Street at 1015 GMT. There is no official word about what it is about, but the rumour mill is suggesting SHE MAY CALL A SNAP ELECTION. Machiavelli couldn't have written this. Traders should stay tuned to their news feeds for developments.
The FTSE is testing support at 7250 as I write with the next support at 7195. This is the February low and the 100-day moving average.
Resistance above sits at 7350 and 7410.
GBP/USD
Not an index but worth a mention in dispatches as the situation develops. GBP/USD has sold off 70 points from 1.2600 to around 1.2530 on speculation about the May announcement.
GBP/USD has support at 1.2500 and then 1.2430 the 100-day moving average. Resistance lies at 1.2610 the overnight high and the 200-day moving average. Technicals may not mean a lot if an election is indeed announced.
Summary
There are a lot of moving parts this morning as Europe (and Britain) return from Easter holidays. The UK announcement at 1015 GMT could be particularly significant with stocks and currencies moving on headlines rather than data this morning.
Trade Idea: GBP/USD – Buy at 1.2400
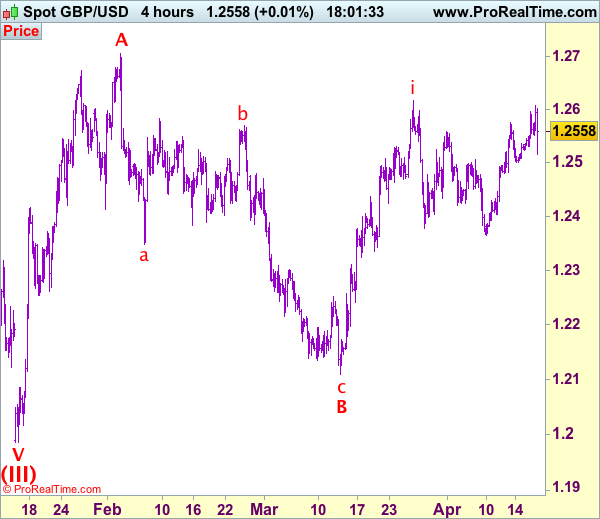
AUD/USD – 1.2554
Recent wave: Wave 5 ended at 1.1081 and major correction has commenced for fall to 0.7000 and then towards 0.6500-10
Trend: Near term up
New strategy :
Buy at 1.2400, Target: 1.2600, Stop: 1.2340
Position: -
Target: -
Stop:-
Cable found decent demand at 1.2109 earlier last month and staged a strong rebound from there since, suggesting the wave c as well as larger degree wave B has ended there, hence impulsive wave C has commenced from there with wave i of C ended at 1.2616, follow by a corruption back to 1.2365 (either end of wave ii or first a-b-c of ii). Although sterling staged a strong rebound from there, break of 1.2616 is needed to confirm upmove has resumed and extend gain to 1.2660-70, then 1.2706 (wave A top) but reckon upside would be limited to 1.2770-80.
Our preferred count on the daily chart is that cable's rebound from 1.3500 (wave (A) trough) is unfolding as a wave (B) with A ended at 1.7043, followed by triangle wave B and wave C as well as wave (B) has ended at 1.7192, the subsequent selloff is the larger degree wave (C) which is still unfolding with minor wave (III) of larger degree wave 3 ended at 1.1986, hence wave (IV) correction is in progress which could either be a triangle wave (IV) of a complex formation but upside should be limited to 1.3500 and price should falter well below 1.4000, bring another decline in wave (V) of 3 for weakness to 1.1500, then 1.1200.
On the downside, whilst initial pullback to 1.2495-00 is likely, reckon downside would be limited to 1.2440-50 and 1.2395-00 should attract renewed buying interest and bring another rally later. Only a break of said support at 1.2365 would abort and shift risk to downside for a deeper wave ii correction later.
Daily Technical Analysis: USD/JPY In Downtrend But Possible Inverted Head And Shoulders At 118.70
The USD/JPY has been dropping substantially but at this point it seems that a dip might have found the support around L4/ATR low confluence at 108.36. At this point the pair is still in downtrend but watch for any signs of possible rejection around 108.70 as the rejection might form inverted head and shoulders where the bottom of the right shoulder could form a rally towards POC. The POC for short trades is 109.30-40 (D H4, W H3, Bearish order block) and rejection should target 108.70. H1 momentum below 108.60 aims for 108.35.
GOLD Bullish Pause, SILVER Bullish Pause, Crude Oil Breaks Rising Trendline.
GOLD Bullish Pause.
Gold has broken the key resistance area 1263. This validates a bullish reversal pattern with an upside potential at 1337. The hourly support at 1263 (previous resistance) has induced some buying interest. Another hourly support lies at 1260 (rising trendline). An hourly resistance can now be found at 1280 (intraday high).
In the long-term, the technical structure suggests that there is a growing upside momentum. A break of 1392 (17/03/2014) is necessary ton confirm it, A major support can be found at 1045 (05/02/2010 low).
SILVER Bullish pause.
Silver is rising sharply above 18.49, validating the recent technical improvements. Strong resistance is given at a distance at 19.00 (09/11/2017 high). Key support is given at 17.74 (10/04/2017 low) then 16.82 (15/03/2017 low).
In the long-term, the death cross indicates that further downsides are very likely. Resistance is located at 25.11 (28/08/2013 high). Strong support can be found at 11.75 (20/04/2009).
Crude Oil Breaks rising trendline.
Crude oil has pulled-back after its recent sharp rise. Support can be located at 50.71 (08/02/2017 low). Hourly resistance can be located at 54 (07/04/2017 high then strong resistance stands at 55.24 03/01/2017 high).
In the long-term, crude oil has recovered after its sharp decline last year. However, we consider that further weakness are very likely. Strong support lies at 24.82 (13/11/2002) while resistance can now be found at 55.24 (03/01/2017 high).
EUR/CHF Moving Sideways, EUR/CHF Moving Sideways, EUR/GBP Declining Toward The Support At 0.8450.
EUR/CHF Moving sideways.
EUR/CHF remains weak as can be seen by the succession of lower highs and lower lows. Hourly resistances can be found at 1.0691 (07/04/2017 high). The medium-term pattern suggests us to see continued bearish pressures towards key support that can be found at 1.0623 (24/06/2016 low). Expected to see further decline.
In the longer term, the technical structure is mixed. Resistance can be found at 1.1200 (04/02/2015 high). Yet,the ECB's QE programme is likely to cause persistent selling pressures on the euro, which should weigh on EUR/CHF. Supports can be found at 1.0184 (28/01/2015 low) and 1.0082 (27/01/2015 low).
EUR/GBP Declining toward the support at 0.8450.
EUR/GBP has broken the key supports area between 0.8787 (13/03/2017) high and 0.8484 (31/03/2017 low). The short-term technical structure is negative as long as the hourly resistance at 0.8596 holds. Another resistance can be found at 0.8645. An hourly support lies at 0.8450 (03/01/2017 low). Expected to show continued weakness.
In the long-term, the pair has largely recovered from recent lows in 2015. The technical structure suggests a growing upside momentum. The pair is trading above from its 200 DMA. Strong resistance can be found at 0.9500 psychological level.
Technical Outlook: Aussie Fell Sharply After Recovery Rally Failed To Break Above Daily Cloud
The Aussie dollar accelerated sharply lower on Tuesday after strong four-day recovery rally was capped by daily Kijun-sen at 0.7608 after brief probe above daily cloud on Monday.
Fresh weakness was triggered by release of minutes for Australian central bank's April meeting that suggested caution on rate views.
Strong pullback that so far retraced 50% of 0.7471/0.7608 rally also broke below 200SMA at 0.7550 that may further weaken near-term structure on daily close below.
Daily Tenkan-sen at 0.7540 has been dented and bears are pressuring next pivot at 0.7523 (Fibo 61.8% of 0.7471/0.7608), loss of which will confirm reversal.
Slow stochastic emerged from oversold territory and shows plenty of space at the downside, as daily MA's are returning into full bearish setup and daily indicators are in negative territory, supporting for further easing.
However, strongly oversold near-term studies suggest a pause in current fall. Corrective attempts should be capped by hourly cloud (spanned between 0.7554/77) which now reverted to resistance.
Res: 0.7550, 0.7577, 0.7583, 0.7594
Sup: 0.7536, 0.7523, 0.7503, 0.7471
EUR/USD Elliott Wave Analysis
EUR/USD – 1.0660
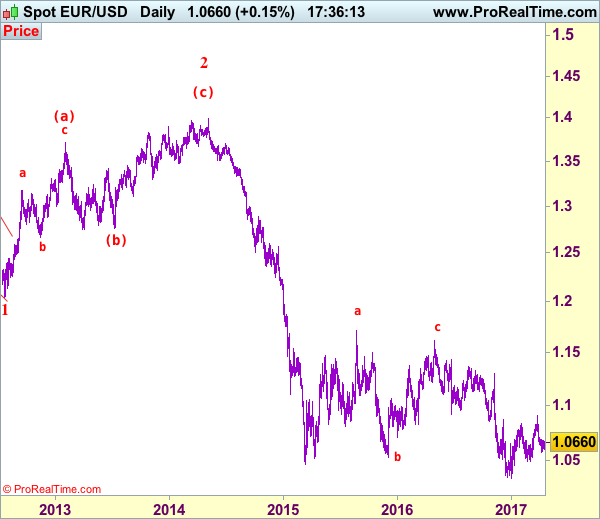
EUR/USD: Wave (c) of 2 ended at 1.3993 and wave 3 of III has commenced for weakness to 1.0411 (1.236 of wave 1), then 1.0000.
As the single currency has recovered after finding support at 1.0570, suggesting consolidation above this level would be seen and initial upside risk is for corrective bounce to 1.0700, however, reckon upside would be limited to 1.0740-50 and bring another decline later, below said support at 1.0570 would extend the fall from 1.0906 to 1.0525 but a daily close below support at 1.0493 is needed to confirm correction from 1.0340 low has ended at 1.0906, bring further fall to 1.0450-55. Looking ahead, below there would signal early downtrend has resumed and extend fall to 1.0400 and later towards this year’s low at 1.0340 later.
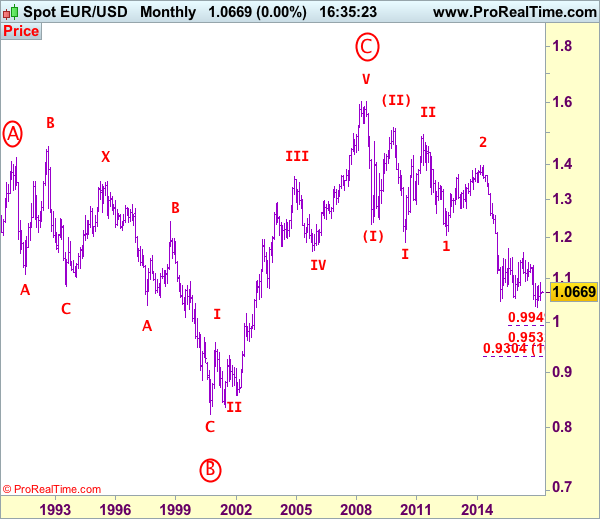
Our preferred count on the daily chart remains that a wave (II) from 1.2329 ended at 1.5145 with A-leg ended at 1.4720, followed by wave B at 1.2457, the wave C from there was also a 3 legged move and is labeled as (a): 1.3739, (b): 1.2885, the wave iii of the 5-waver (c) from 1.2885 has ended at 1.4339 and wave iv is a triangle ended at 1.3878 and wave v formed a top at 1.5145. The decline from there is a 5-waver (C) with minor wave (i) of I of (C) ended at 1.4218 with wave (ii) ended at 1.4580, wave (iii) ended at 1.3267 and wave (iv) ended at 1.3692 and wave (v) ended at 1.1876, this is also the low of wave I of (C) and wave II ended at 1.4940, hence wave III is now in progress with a diagonal wave 1 ended at 1.2042, the breach of previous support at 1.1876 (wave I trough) adds credence to our view that the wave 2 has ended at 1.3993, wave 3 has commenced for further weakness to 1.0411, then towards 1.0000.
On the upside, whilst initial recovery to 1.0700 cannot be ruled out, reckon upside would be limited to 1.0730-40 and bring another decline. Above 1.0765-70 would defer and suggest first leg of decline from 1.0906 has ended, bring a stronger rebound to 1.0800-10 but price should falter well below 1.0870-75 and bring another decline. In the unlikely event euro breaks above resistance at 1.0906, this would shift risk back the upside for the erratic rise from 1.0340 low to bring retracement of early downtrend to 1.0930-35 (61.8% Fibonacci retracement of 1.1300-1.0340), then 1.1000.
Recommendation: Sell at 1.0735 for 1.0535 with stop above 1.0835.
Euro's long-term uptrend started from 0.8228 (26 Oct 2000) with an impulsive structure. The rise from 0.8228 to 0.9593 (5 Jan 2001) is labeled as wave I, the retreat to 0.8352 (6 Jul 2001) is wave II and the rally to 1.3670 (31 Dec 2004) is wave III. Wave IV from there ended at 1.1640 (15 Nov 2005), the subsequent upmove to 1.6040 (July 15, 2008) is treated as wave V, the major selloff from the record high of 1.6040 to 1.2329 (October 27, 2008) signals a reversal has taken place with (I) leg ended at 1.2329 and once (II) ended at 1.5145, wave (III) itself is an extended move with I: 1.1876 and complex wave II ended at 1.4902, wave III has commenced with wave 1 and 2 ended at 1.2042 and 1.3993 respectively, wave 3 of III is now unfolding for weakness towards parity.
USD/JPY Elliott Wave Analysis
USD/JPY - 108.86
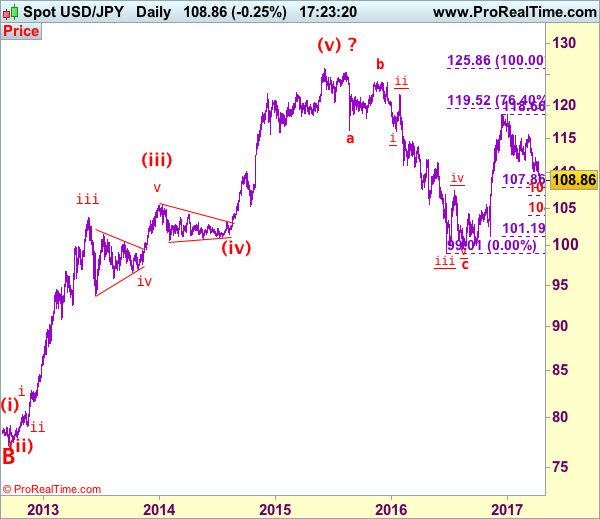
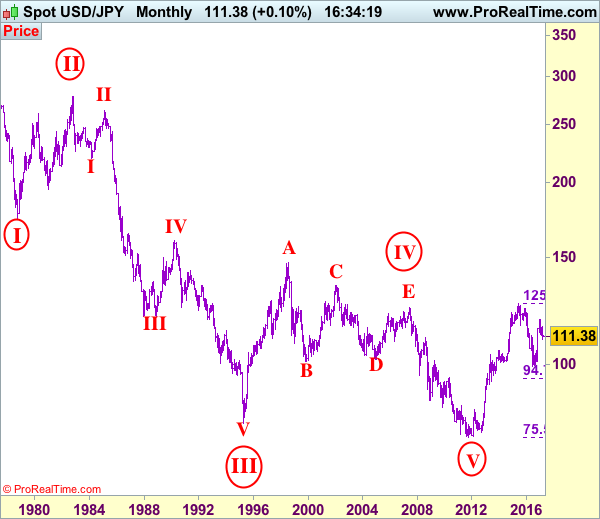
USD/JPY – Wave V of larger degree circle V has possibly ended at 75.31 and major correction has commenced and already met indicated target at 125.00.
The greenback only recovered to 111.58 early last week before meeting renewed selling there and price dropped quite sharply from there in line with our bearish expectation, this selloff adds credence to our view that top has been formed at 118.66 and the decline from there is still in progress for further weakness to 118.10-15, below there would extend weakness to 107.85-90 (61.8% Fibonacci retracement of 101.19-118.66), then towards 107.10-20 but reckon 106.75-80 (1.236 times projection of 118.66-111.59 measuring from 115.51) would limit downside and 106.00 should hold, bring rebound later due to oversold condition.
Our preferred count is that, triangle wave IV (with circle) ended at 101.45 and the circle wave V brought dollar down to the record low of 75.31 in 2011 and the subsequent rebound signal major correction has commenced with A leg ended at 84.19, followed by wave B at 77.14 and impulsive wave C is now unfolding (indicated upside target at 125.00 had been met) for gain towards 127.00 level. In the event dollar drops below support at 99.01, this would confirm medium term decline from 125.86 top (2015 high) has resumed for subsequent weakness to 98.00 and possibly 97.00.
Under this count, this wave C is unfolding as impulsive waves with (1) (2), 1 2 ended at 80.67, 79.07, 82.84 and 81.69 respectively, hence the extended wave 3 has ended at 103.74 and wave 4 correction of recent upmove should bring weakness to 92.57, then towards 90.88 but psychological support at 90.00 should limit downside and bring another rally later in wave 5, indicated target at 125.00 had been met and gain to 127.00 cannot be ruled out but reckon price would falter below 130.00.
On the upside, although the rebound from 108.13 (yesterday’s low) suggests consolidation above this level would be seen with initial upside risk for corrective bounce to 110.00, reckon 110.50-60 would limit upside and bring another decline later. Only break of said resistance at 111.58 would abort and suggest a temporary low is formed instead, bring a stronger rebound to resistance at 112.20.
Recommendation: Sell at 110.60 for 108.60 with stop above 111.60.
On the monthly chart, we have changed our preferred count that an impulsive wave is unfolding with major wave III with circle ended at 79.75, then followed by wave IV with circle and is labeled as a triangle with A: 147.64 (11 August, 1998), B: 101.25, C: 135.20, D: 101.67 and E leg ended at 124.14 to end the wave IV with circle. Hence, wave V with circle commenced from there and hit a record low of 75.31, however, the subsequent strong rebound signals this circle wave V has possibly ended there, hence gain to (indicated upside target at 122.00 and 125.00 had been met), the retreat from 125.86 suggests wave A of major correction has ended there and wave B correction back to 99.00, then 95.00 would be seen, however, reckon downside would be limited to 90.00, bring another rebound in wave C next year.
USD/CHF Still Weak Within Range, USD/CAD Weak Bounce. AUD/USD Fading Near The Resistance At 0.7610.
USD/CHF Still weak within range.
USD/CHF failed to breach 1.0107 dropping sharply to support. The short-term technical structure is negative as long as prices remain below the hourly resistance at 1.0171 (07/03/2017). Hourly support is given at 1.0009 (13/04/2017 base low) then 0.9814 (27/03/2017 low).
In the long-term, the pair is still trading in range since 2011 despite some turmoil when the SNB unpegged the CHF. Key support can be found 0.8986 (30/01/2015 low). The technical structure favours nonetheless a long term bullish bias since the unpeg in January 2015.
USD/CAD Weak bounce.
USD/CAD has broken the support at 1.3265 confirming an underlying bearish trend. Hourly resistances can now be found at 1.3340 (intraday high) and 1.3456 (04/04/2017 high). Support is given at 1.2969 (31/01/2017 low).
In the longer term, there is a golden cross with the 50 dma crossing the 200 dma indicating further upside pressures. Strong resistance is given at 1.4690 (22/01/2016 high). Long-term support can be found at 1.2461 (16/03/2015 low).
AUD/USD Fading near the resistance at 0.7610.
AUD/USD has failed to break short term resistance at 0.7610, reversing bullish momentum. Key resistance stands at 0.7681 (30/03/2017 high). Hourly support is located at 0.7449 (13/01/2017 low).
In the long-term, we are waiting for further signs that the current downtrend is ending. Key supports stand at 0.6009 (31/10/2008 low) . A break of the key resistance at 0.8295 (15/01/2015 high) is needed to invalidate our long-term bearish view.