Sample Category Title
First Quarter Growth Sent Pleasant Surprise, Tighter Lending Drove Borrowers to ‘Shadow Bank’
China's economic activities surprised to the upside in 1Q17. GDP expanded +6.9% y/y, beating consensus of, and 4Q16's, +6.8%. Growth was led by a +7.7% expansion in the tertiary sector, followed by a +6.4% growth in the secondary industry. Economic activities also strengthened across the board in March. Retail sales expanded +10.9%, accelerating from +9.5% in the combined January to February period. Industrial production (IP) growth improved to +7.6%, the fastest pace since end-2014, from +6.3% in the January-February period. The market had anticipated a mild drop to +6.2%. Fixed asset investment (FAI) increased 9.2% y/y to March, up from +8.9% in the January-February period. Looking into the details, investment gained +19.8% in the primary sector, +4.2% in the secondary sector and +12.2% y/y in the tertiary sector. Moreover, private investment expanded +7.7% y/y in March, up from +6.7% in the prior month, while the growth in public investment slowed to +13.6%, from +14.4% in February. For the first quarter of the year, retail sales grew +10%, IP rose +6.8% with manufacturing output up +7.4% while fixed asset investment expanded +9.2%, of which real estate investment and tech investment up +9.1% and +22.6%, respectively.

Housing and lending remained the key drivers to Chinese growth in 1Q17. Besides strong FAI growth, a report from National Bureau of Statistics (NBS) shows that new home prices gained +0.6% in March, doubling the growth in February. Although property sales growth eased in March, the three-month moving average suggests that it remains in an uptrend in both volume and value terms. Growth of land sales and housing starts also stayed firm. The strong property cycle is expected to help avoid a sharp slowdown this year.
As indicated in PBOC's report published late last week, the country's new renminbi loans dropped to RMB1.02 trillion in March from RMB1.17 trillion a month ago. The market had anticipated a pickup to RMB1.25 trillion. It was estimated that 40% of the new loans was property lending loans (developers plus household) which soared +26% y/y to RMB28.4 trillion at end-March. The new loans figure would increase to RMB 1.16 trillion after adding back interbank lending. Incremental Total Social Financing (TSF) rebounded to RM 2.1 trillion. TSF outstanding balance gained +12.5% y/y. Broad money supply (M2) growth slowed to +10.6% y/y, the slowest pace in 8 months. Moderation in loan growth can be viewed as a result of the government's tighter policy measures. Yet, restrictions of acquiring loans through traditional channels have encouraged shadow lending. New shadow lending (including entrusted loans, trust loans and bank acceptances) was reported to have reached RMB2.05 trillion in the first quarter, up +320% from the same period last year.
The current environment suggests that China's property market has remained buoyant, despite the government's tightening measures. Investors/speculators have been driven to shadow lending, an activity that the government has been trying to curb, for funding. Yet, we expect the government would have few choices but to continue its monetary tightening measured targeting the asset markets
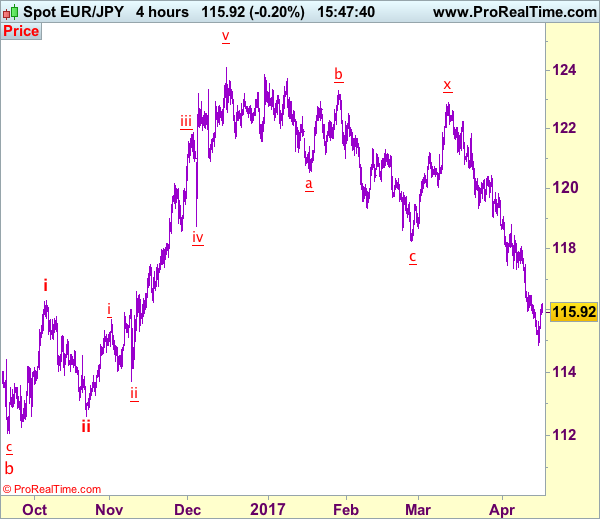
Trade Idea: EUR/JPY – Sell at 118.00 or buy at 115.25
EUR/JPY - 115.93
Recent wave: wave v of (C) ended at 94.12 and major correction in wave A has ended at 149.79
Trend: Near term down
Original strategy:
Sell at 118.00, Target: 116.00, Stop: 118.60
Position: -
Target: -
Stop: -
New strategy :
Sell at 118.00, Target: 116.00, Stop: 118.60
O.C.O.
Buy at 115.25, Target: 117.25, Stop: 114.65
Position: -
Target: -
Stop:-
Although the single currency extended recent decline to as low as 114.85 yesterday, the subsequent rebound suggests a temporary low is possibly formed there and consolidation with mild upside bias is seen for retracement of recent decline, hence gain to 117.00 and then 117.45-50 is likely, however, reckon resistance at 118.07 would limit upside and bring another decline later.
In view of this, whilst we are looking to turn long on dips, we would also sell euro on subsequent rebound towards 118.00. Below said support at 114.85 would signal recent entire fall from 124.10 top is still in progress and downside risk remains for further weakness to 114.40-50, then towards 114.00-10, however, near term oversold condition should prevent sharp fall below latter level and risk from there is seen for a much-needed rebound to take place later.
Our latest preferred count is that wave (ii) is ABC-X-ABC which ended at 123.33 and wave (iii) is unfolding with wave iii ended at 100.77, followed by wave iv at 111.57 and wave v as well as the wave (iii) has ended at 97.04, followed by wave (iv) at 111.43 and wave (v) has ended at 94.12 which is also the end of the larger degree v, this also implied the major wave (C) has also ended there, hence major correction has commenced from there with (A) leg unfolding in its lower degree wave c which has possibly ended at 145.69. Under this count, A-B-C wave (B) has commenced with A leg ended at 136.23, wave B at 143.79 and wave C has possibly ended at 149.79.
Our larger degree count is that the decline from 139.26 is wave (C) and is sub-divided into a diagonal triangle i-ii-iii-iv-v with wave i - 105.44, wave ii- 123.33, wave iii - 97.03, wave iv - 111.43, followed by the final wave v as well as the end of wave (C) at 94.12, this also mark the bottom of larger degree wave B. Under this count, major rise in wave C has commenced as an impulsive wave with minor wave III ended at 145.69, wave V is still in progress for further gain to 150.00. Having said that, this so-called wave V could well be the first leg of larger degree 5-waver wave C and this wave C should bring at least a retest of wave A top at 169.97 (July 2008).
Trade Idea: AUD/USD – Exit long entered at 0.7525
AUD/USD – 0.7555
Recent wave: Wave 5 ended at 1.1081 and major correction has commenced for fall to 0.7000 and then towards 0.6500-10
Trend: Near term down
Original strategy :
Bought at 0.7525, Target: 0.7680, Stop: 0.7465
Position: - Long at 0.7525
Target: - 0.7680
Stop: - 0.7465
New strategy :
Exit long entered at 0.7525
Position: - Long at 0.7525
Target: -
Stop:-
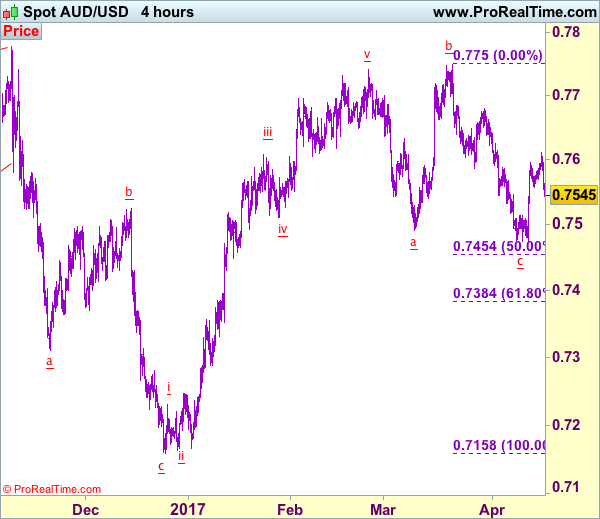
Although aussie rose briefly to 0.7611 yesterday, lack of follow through buying and the subsequent retreat suggest consolidation would be seen and downside risk has increased for weakness to 0.7500, however, only break of last week’s low at 0.7473 would signal the decline from 0.7750 top has resumed and extend weakness to 0.7450-55 (50% Fibonacci retracement of 0.7158-0.7750) but oversold condition should limit downside to 0.7380-85 (61.8% Fibonacci retracement), risk from there is seen for a rebound later.
In view of this, would be prudent to exit long entered at 0.7525 and stand aside for now. Above said resistance at 0.7611 would revive bullish view that low has been formed at 0.7473 last wee, bring further gain towards resistance at 0.7680 but break there is needed to retain bullishness and signal the fall from 0.7750 has ended, bring further gain to 0.7700-10 first.
On the 4-hour chart, the move from 0.8066 is the wave 5 with i: 0.8860, ii: 0.8315, wave iii is an extended move ended at 1.0183, iv: 0.9706 and wave v has ended at 1.1081 (also the top of entire wave 5). The subsequent selloff is the major correction which is unfolding as ABC-X-ABC and 2nd A leg has ended at 0.8848, followed by a-b-c wave B which ended at 0.9758, hence, 2nd C wave is now in progress and indicated downside target at 0.7000 and 0.6950 had been met, so further fall to 0.6710-20 cannot be ruled out.
Trade Idea : USD/CHF – Stand aside
USD/CHF - 1.0032
Most recent candlesticks pattern : N/A
Trend : Near term down
Tenkan-Sen level : 1.0039
Kijun-Sen level : 1.0032
Ichimoku cloud top : 1.0045
Ichimoku cloud bottom : 1.0039
New strategy :
Stand aside
Position : -
Target : -
Stop : -
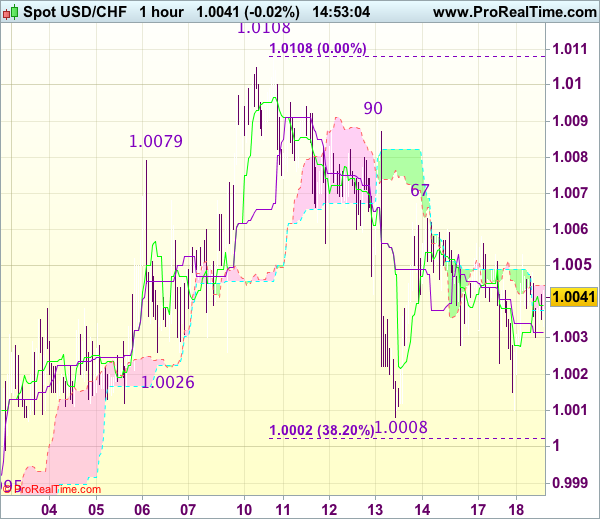
Despite falling to 1.0010 yesterday, as the greenback has rebounded again after holding above last week’s low at 1.0008, suggesting further choppy trading within near term established range would be seen and risk of another bounce to 1.0067 resistance cannot be ruled out, however, break there is needed to signal low has been made at 1.0008, bring test of 1.0090, once this level is penetrated, this would suggest the fall from 1.0108 high has ended, bring retest of this last week’s high first.
On the downside, below said support at 1.0008 would extend the fall from 1.0108 top to previous support at 0.9995, however, still reckon downside would be limited to 0.9970 (50% Fibonacci retracement of 0.9831-1.0108) and 0.9940-50 should hold from here, bring rebound later. As near term outlook is still mixed, would be prudent to stand aside for now.
Trade Idea : GBP/USD – Buy at 1.2510
GBP/USD - 1.2589
Most recent candlesticks pattern : N/A
Trend : Near term up
Tenkan-Sen level : 1.2573
Kijun-Sen level : 1.2563
Ichimoku cloud top : 1.2536
Ichimoku cloud bottom : 1.2530
Original strategy :
Buy at 1.2480, Target: 1.2580, Stop: 1.2445
Position : -
Target : -
Stop : -
New strategy :
Buy at 1.2510, Target: 1.2610, Stop: 1.2475
Position : -
Target : -
Stop : -
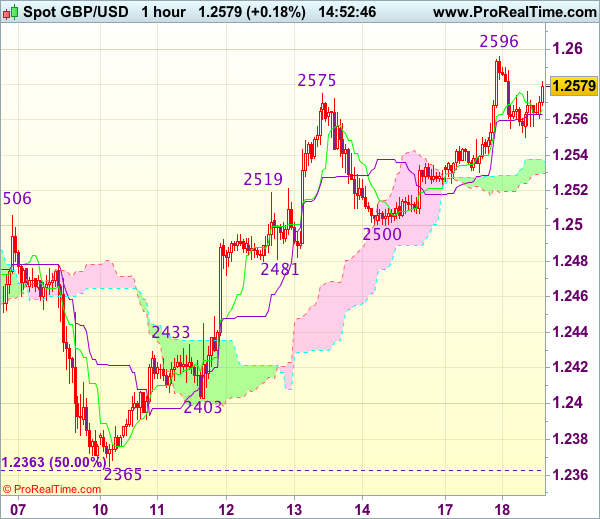
As cable found renewed buying interest at 1.2500 late last week and has surged again, adding credence to our bullish view that recent upmove is still in progress and upside bias remains for last week’s rise from 1.2365 to extend gain to previous resistance at 1.2616, however, break there is needed to retain bullishness and bring subsequent upmove to 1.2650-60 which is likely to hold on first testing due to near term overbought condition.
In view of this, would not chase this rise here and would be prudent to buy cable on pullback as said support at 1.2500 should limit downside and bring another upmove later. Below another previous support at 1.2481 would abort and suggest top is formed, risk test of 1.2433 (previous resistance) later.
Mixed Messages On The U.S. Dollar, Who Should You Listen To?
The U.S. dollar continued to recover from a five-month low against the Yen early Tuesday, after testing 108.11 yesterday. Comments from U.S. Secretary of the Treasury Steven Mnuchin, stating that a strong dollar is good in the long run, offset previous remarks from President Trump who last week said that the dollar is getting too strong and that it is hard to compete when other countries devalue their currency. However, Mnuchin also agreed that the dollar’s strength in the short run is hurting exports and the economy;based on such mixed signals, traders are finding it difficult to choose on which side to take a trade.
Since both the U.S. President and Secretary of the Treasury agree that the greenback is overvalued in the short-term perspective, dollar bulls shouldn’t get overexcited on the long run views. Instead, I would suggest ignoring what politicians are claiming for the time being and to focus on what most recent economic data is saying:
- U.S. inflation expectations fell to their lowest levels in 2017
- Retail sales fell for a second month in March
- Consumer prices dropped for the first time in over a year
- Atlanta Fed cuts U.S. first quarter GDP to 0.5%
- U.S. non-farm payrolls marked the smallest gain since May 2016
This set of most recent economic hard data indicates that the robust soft data reflecting consumer and business sentiment didnot translate into spending, investing and hiring. There’s a clear gap here and such a divergence may not last for long. Either hard data should agree with sentiment surveys, or optimism will start to fade.
Mnuchin sent another signal on tax reforms on Monday, saying that expecting one before August is highly aggressive and not realistic. Investor and traders are likely to start questioning whether Trump will be able to deliver on tax reform and stimulus but so far most signs are negative, thus another negative factor affectingthe USD.
Expectations of a wider divergence in monetary policy also took a hit. Markets expectations for a June rate hike have fallen below 50%, down from more than 60% just a week ago according to the CME FedWatchTool. Moreover, chances of two rate hikes in 2017 dropped below 40%, so traders betting on interest rates differentials should tweak their model assumptions.
Overall, there’s a high chance that the dollar could have already topped out for the year, but whether more declines willbe seen relies heavily on fundamental drivers, not verbal interventions. I would prefer selling the rallies than buying the dips on the short-run until we see solid evidence of U.S. fiscal stimulus.
Trade Idea : EUR/USD – Hold short entered at 1.0665
EUR/USD - 1.0650
Most recent candlesticks pattern : N/A
Trend : Near term down
Tenkan-Sen level : 1.0645
Kijun-Sen level : 1.0643
Ichimoku cloud top : 1.0640
Ichimoku cloud bottom : 1.0615
Original strategy :
Sold at 1.0665, Target: 1.0565, Stop: 1.0680
Position : - Short at 1.0665
Target : - 1.0565
Stop : - 1.0680
New strategy :
Hold short entered at 1.0665, Target: 1.0565, Stop: 1.0675
Position : - Short at 1.0665
Target : - 1.0565
Stop : - 1.0675
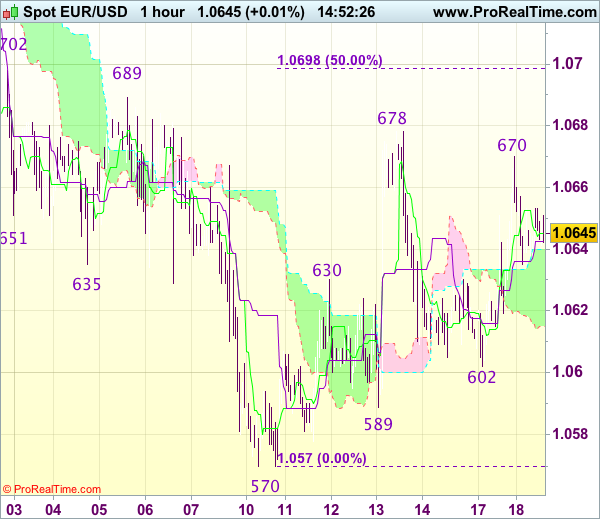
Although the single currency slipped to 1.0602 initially yesterday, euro found good support there and has staged a strong rebound to 1.0670, suggesting further choppy trading would be seen, however, as long as resistance at 1.0670-78 holds, prospect of another decline remains, below said support at 1.0602 would bring test of 1.0589 support but break there is needed to signal decline has resumed for retest of 1.0570, (last week’s low), below there would extend the decline from 1.0906 to 1.0550-55 (50% projection of 1.0906-1.0635 measuring from 1.0689), then 1.0525-30.
In view of this, we are holding on to our short position entered at 1.0665. A firm break above said resistance at 1.0670-78 would abort and suggest low has been formed at 1,0570, bring a stronger rebound to 1.0698-02 (50% Fibonacci retracement of 1.0827-1.0570 and previous resistance).
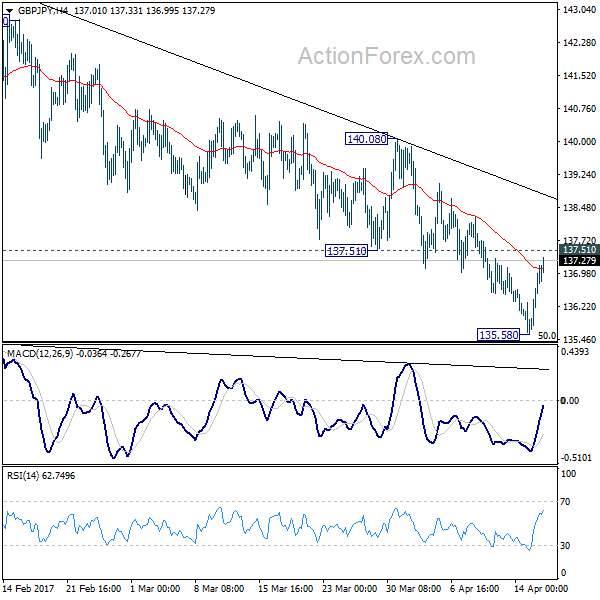
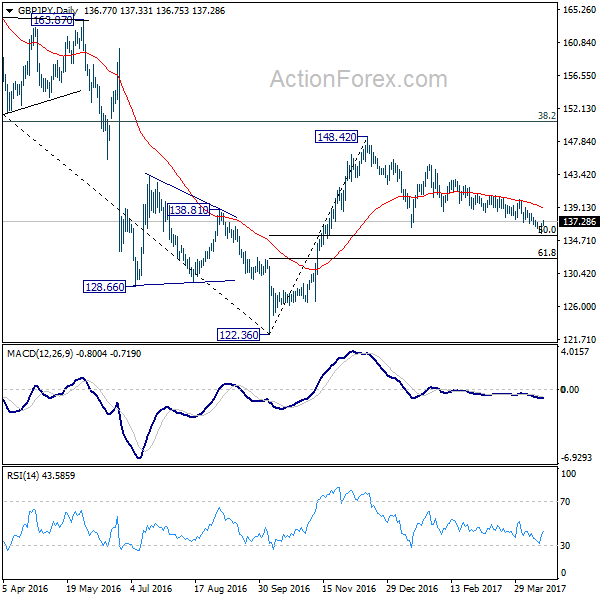
GBP/JPY Daily Outlook
Daily Pivots: (S1) 136.36; (P) 136.84; (R1) 137.16; More...
A temporary low is formed at 135.58, ahead of medium term fibonacci level at 135.39. Intraday bias in GBP/JPY is turned neutral first. As noted before, we're viewing price actions from 148.42 as a corrective pattern. Break of 137.51 support turned resistance will turn intraday bias back to the upside. Break of 140.08 resistance will confirm near term reversal. However, sustained break of 135.39 will dampen our view and target next fibonacci level at 132.31.
In the bigger picture, price actions from 122.36 medium term bottom are still seen as a corrective pattern. As long as 50% retracement of 122.36 to 148.42 at 135.39 holds, another rising leg would be seen to 38.2% retracement of 195.86 to 122.36 at 150.42 and possibly above. However, firm break of 135.39 will bring retest of 122.36, with prospect of resuming the larger down trend from 195.86.
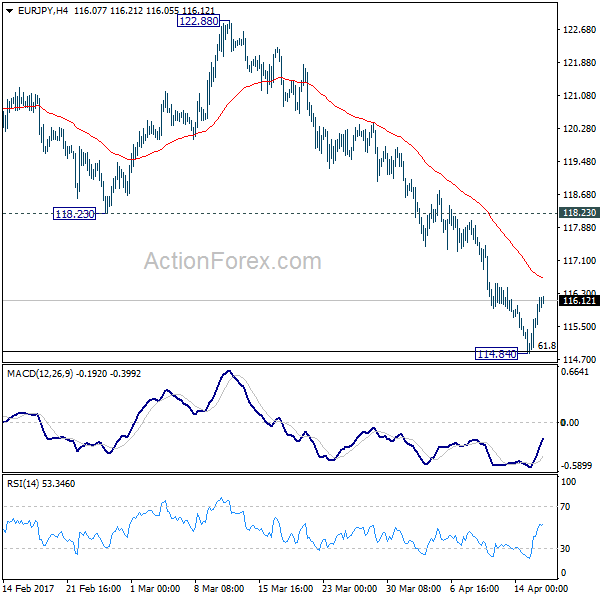
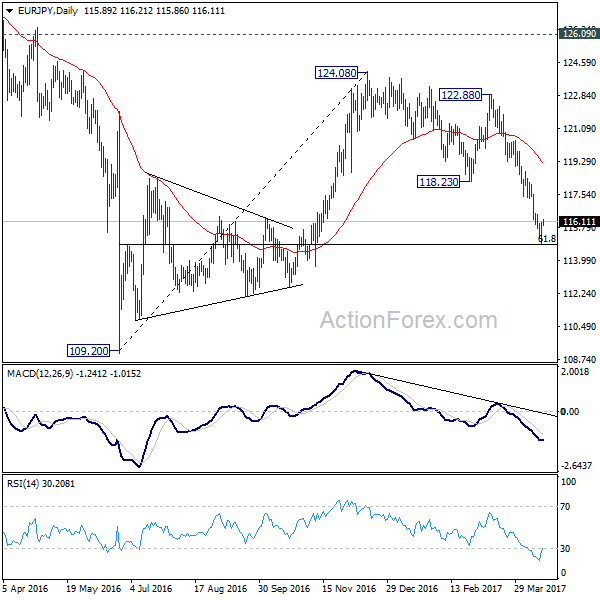
EUR/JPY Daily Outlook
Daily Pivots: (S1) 115.16; (P) 115.59; (R1) 116.35; More...
EUR/JPY formed a temporary low at 114.84 after hitting 61.8% retracement of 109.20 to 124.08 at 114.88. Intraday bias is turned neutral for consolidations. Upside of recovery should be limited by 118.23 support turned resistance and bring another decline. Corrective rise from 109.20 has completed at 124.08. Below 114.84 will turn bias back to the downside for retesting 109.20 low.
In the bigger picture, medium term corrective rise from 109.20 should have completed at 124.08, ahead of 126.09 support turned resistance. Medium term down trend from 149.76 is likely resuming. Break of 109.20 will target 94.11 low. In any case, break of 126.09 is needed needed to confirm medium term reversal. Otherwise, outlook will remain bearish in case of another rebound.
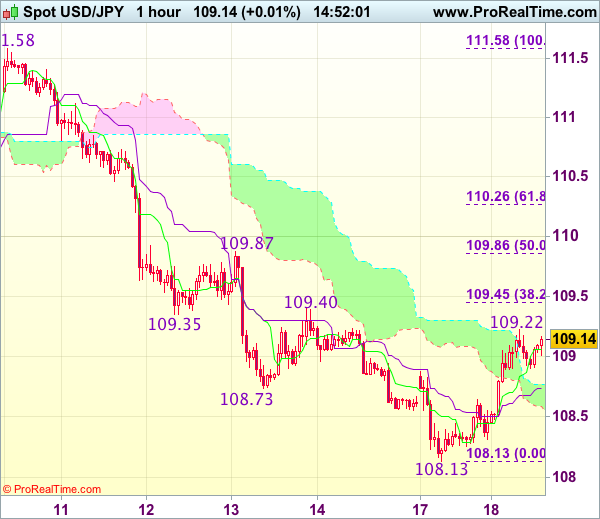
Trade Idea : USD/JPY – Sell at 109.90 or buy at 108.60
USD/JPY - 109.09
Most recent candlesticks pattern : N/A
Trend : Near term down
Tenkan-Sen level : 109.06
Kijun-Sen level : 108.74
Ichimoku cloud top : 108.77
Ichimoku cloud bottom : 108.55
Original strategy :
Sell at 109.90, Target: 108.90, Stop: 110.25
Position : -
Target : -
Stop : -
New strategy :
Sell at 109.90, Target: 108.90, Stop: 110.25
O.C.O.
Buy at 108.60, Target: 109.60, Stop: 108.25
Position : -
Target : -
Stop : -
Although the greenback extended recent decline to as low as 108.13 yesterday, the subsequent strong rebound suggests a temporary low has been formed there and consolidation with mild upside bias is seen for retracement of recent decline, hence gain to 109.40-45 (previous resistance and 38.2% Fibonacci retracement of 111.58-108.13) is likely, however, reckon upside would be limited to 109.86-87 (50% Fibonacci retracement and previous resistance) and price should falter below 110.25-30 (61.8% Fibonacci retracement), bring retreat later to 108.50-60 but price should stay above 108.30-35, bring another rebound.
In view of this, whilst we are looking to turn long on dips for such a rebound, we are inclined to sell dollar on subsequent bounce as 109.90-00 should limit upside, bring another decline. Below 108.30-35 would risk retest of 108.13 support (yesterday’s low) but break there is needed to signal recent decline has resumed and extend weakness to 107.75-80 later.