Sample Category Title
Yen Stars as North Korean Tension Escalates, Markets Losing Confidence on Trump
Worries on geopolitical tensions and US policies were the two main forces driving the markets in a holiday shortened week. Yen surged broadly and the relative strength to Swiss Franc argues that worries are mainly on the tensions in Korean Peninsula. The rally in Yen was also accompanied safe haven flows into US treasuries. Long term yields tumbled sharply to the lowest level this year, breaking key near term support levels. Gold surged to as high as 1290.7 and is having its sight on 1300 handle. WTI crude oil also extended recent rise before losing some momentum ahead of 55.24 resistance. In the currency markets, Dollar ended as the weakest major currency as talked down by US President Donald Trump, and dragged down by falling yields. Euro ended as the second weakest ahead of French presidential election and dragged down the Swiss Franc.
North Korean tensions escalated as Trump and Kim showed muscles
Both factors driving the markets were related to Trump. Trump sent a "very power Armada" to Korean peninsula after tweeting that US will solve the North Korea problem alone if China doesn't help. North Korea responded by warning to take "the toughest counteraction against the provocateurs" and to "sweep the imperialist group with a nuclear fire of justice." On Saturday, North Korean leader Kim Jong Un oversaw a military parade, live broadcast to the world. The parade displayed the country's weapons including submarine launched ballistic missiles for the first time. Japan National Security Council has already discussed plan to evacuate as many as 57,000 Japanese residing in South Korea in case of crisis. China urged all parties to "stop provoking" and warned that no one would become a winner in wars.
US-Russian relationship not getting better neither
Separately, Trump ordered to drop US's most powerful non-nuclear bomb, the "Mother of All Bombs" in Afghanistan, targeting ISIS. According to an Afghan official, at least 94 ISIS fighters were killed. Also, three underground tunnels were destroyed. And both US and Afghan officials claimed that no civilians were hurt. Russian government claimed that it has a "big daddy" bomb that is four times the size of the American mother of all bombs. Russian President Vladimir Putin complained that the level of trust with US has dropped after Trump became President of US. Putin criticized that US's missile strike on Syrian air base as "a clear violation of international law". And the chemical weapon attack last week were "provocations" by terrorists and for accusing the Syrian government.
Trump talked down Dollar
Separately, in an interview with the Wall Street Journal, Trump complained that US dollar "is getting too strong, and partially that's my fault because people have confidence in me. But that's hurting - that will hurt ultimately". He added that "it's very, very hard to compete when you have a strong dollar and other countries are devaluing their currency". Meanwhile, Trump also reversed his position and said that China is "not currency manipulators". And he hailed that Chinese President Xi Jinping "wants to help us with North Korea." Also, Trump showed in the interview his "respect" for Fed chair Janet Yellen and suggested that he has not decided whether he would reappoint her for the second term.
Markets losing confidence on Trump
The comments regarding Dollar was seen as a factor driving the greenback down. However, it remains to be seen if investors' worries are more than that. To be specific, traders could be getting increasingly doubtful on what Trump would and could do. His failure in health act and travel ban raised a lot of questions on his administrative ability. Now that his stance on China has had a U-turn. His stance on Fed chair Yellen also changed. He stance on war also changed. And that further raises questions on whether he will deliver his election promises.
DJIA heading south, through 20000 handle
Technically, the outlooks for stocks, yields and Dollar are bearish in the near term. DJIA's close below 55 day EMA last week indicates that correction from 21169.11 is still in progress and extending. Further fall should be seen in near term to 38.2% retracement of 17883.56 to 21169.11 at 19914.02. At this point, we'd still expect strong support from this fibonacci level to contain downside and bring rebound. Larger up trend from 17883.56 should resume at a later stage.
TNX to drop further to 2.13 fib level
10 year yield tumbled sharply through 2.314 support to close at 2.232. The development confirmed that correction (started either at 2.621, or 2.615) is still in progress. Further decline should be seen to 38.2% retracement of 1.336 to 2.621 at 2.130. But at this point, we'd expect the breach of 55 week EMA (now at 2.152) to be brief.
Dollar index to have another leg down before correction finishes
Dollar index's failure to sustain above 55 day EMA, and rejection from near term falling trend line suggests short term topping at 101.34. The development also argue that corrective pattern from 103.82 is developing into a five wave triangle pattern. More downside should be seen in the index in near term with prospect of breaking 98.85 low. But overall, we'd still expect strong support from 50% retracement of 91.91 to 103.82 at 97.86 to contain downside and bring up trend resumption, at a later stage.
Holding on to EUR/USD short
The premises of our strategy last week were totally wrong even though results were not that bad. Focus did turn to Dollar but instead of rallying, it tumbled. Yields and stocks also plummeted after struggling to advance. Our AUD/JPY short (entered at 84.90) was closed at 83.20 at open, with 170 points profit. AUD/JPY then dipped to as low as 81.84 before recovering mildly. The lack of strength in recovery suggests that there is more downside ahead in the cross.
Our EUR/GBP short, (entered at 0.8550) was closed at 0.8545 with 5 points profit. We expected the cross to gyrate sideway with risk of further recovery. But instead, EU/GBP broke 0.8474 support to resume recent decline. More downside would likely be seen in EUR/GBP for 0.8402 support next.
Meanwhile, we sold EUR/USD at market at 1.0580 last week with stop at 1.0690. The pair recovered to 1.0677 then reversed. The trade is held in place mainly thanks to the fact that Euro ended as the second weakest currency next to Dollar. Weakness in Euro is anticipated though as markets pared back hawkish expectations on ECB. While we're expecting some softness in Dollar in near term, we'd maintain the view that Euro should under perform. So we'll just hold on to this EUR/USD short trade with stop lowered to 1.0680.
And with so much geopolitical uncertainties around, we'll refrain from opening new position this week.
USD/JPY Weekly Outlook
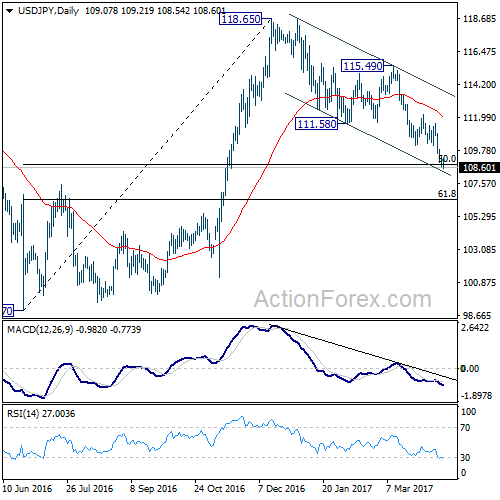
USD/JPY's fall from 118.65 extended to as low as 108.52 last week. The firm break of 55 week EMA argues that rise from 98.97 is completed already. And deeper fall could be seen to 98.97 and below to extend the correction pattern from 125.85.
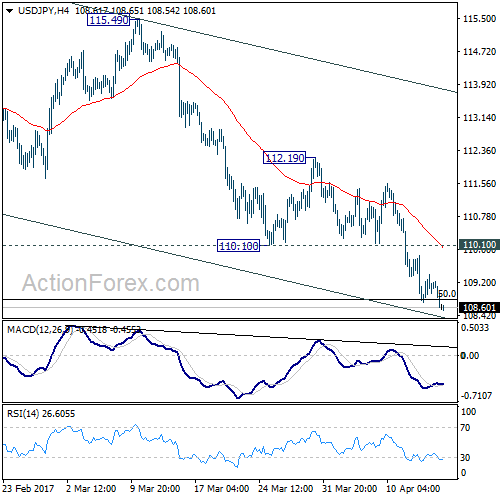
Initial bias in USD/JPY remains on the downside this week. Deeper fall would be seen to 61.8% retracement of 98.97 to 118.65 at 106.48. Sustained break there will pave the way back to 98.97 low. On the upside, break of 110.10 support turned resistance is needed to be the first sign of short term bottoming. Otherwise, outlook will remain mildly bearish in case of recovery.
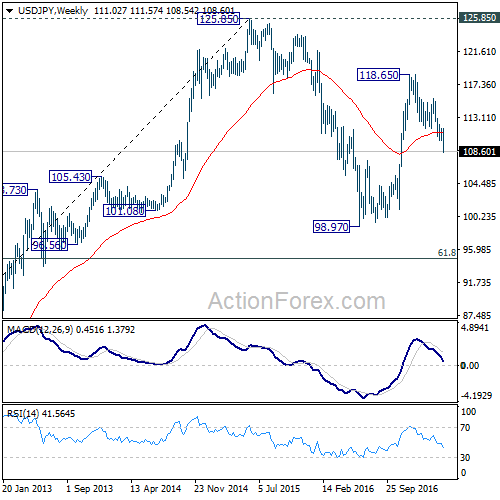
In the bigger picture, price actions from 125.85 high are seen as a corrective pattern. Current development suggests that it's not completed yet and is extending. In case of deeper decline, downside should be contained by 61.8% retracement of 75.56 to 125.85 at 94.77 to bring rebound. Rise from 75.56 is still expected to resume later after the correction from 125.85 completes.
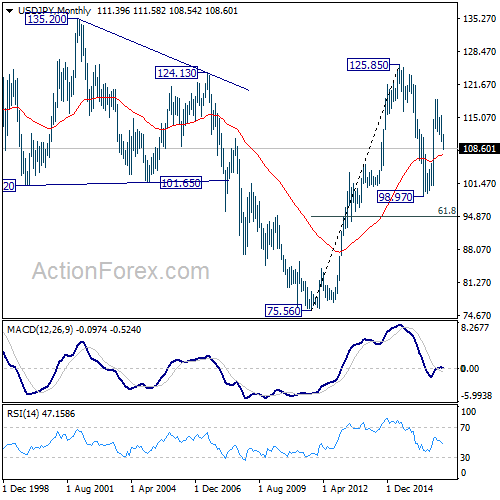
In the long term picture, the rise from 75.56 long term bottom to 125.85 medium term top is viewed as an impulsive move. Price actions from 125.85 are seen as a corrective move which could still extend. But, up trend from 75.56 is expected to resume at a later stage for above 135.20/147.68 resistance zone.
EUR/USD Weekly Outlook
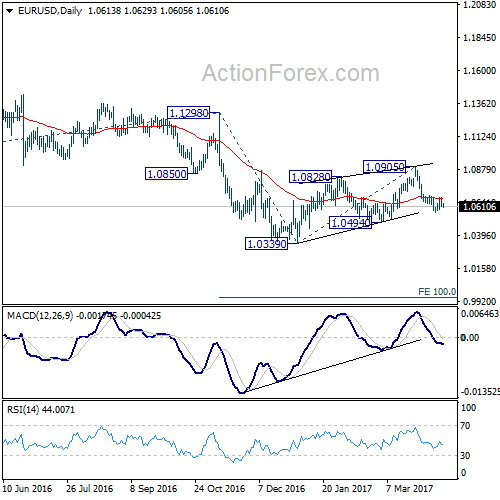
EUR/USD edged lower to 1.0569 last week but recovered since then. Upside was limited below 1.0688 minor resistance. And EUR/USD failed to stay above 55 day EMA. Hence, near term bearish outlook is unchanged. That is, correction from 1.0339 has completed with three waves up to 1.0905. Fall from there is resuming larger down trend.
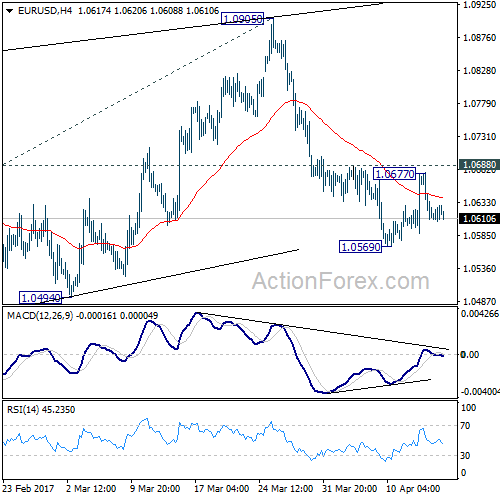
Initial bias in EUR/USD remains neutral this week first. Break of 1.0569 will turn bias to the downside for 1.0494 support first. Decisive break there should confirm our bearish view. In that case, EUR/USD should drop through 1.0339 to 100% projection of 1.1298 to 1.0339 from 1.0905 at 0.9946. On the upside, however, break of 1.0688 resistance will delay the bearish case and turn focus back to 1.0905 resistance instead.
In the bigger picture, as long as 1.1298 key resistance holds, whole down trend from 1.6039 (2008 high) is still expected to continue. Break of 1.0339 low will send EUR/USD through parity to 61.8% projection of 1.3993 to 1.0461 from 1.1298 at 0.9115. However, considering bullish convergence condition in weekly MACD, break of 1.1298 will indicate term reversal. this would also be supported by sustained trading above 55 week EMA.
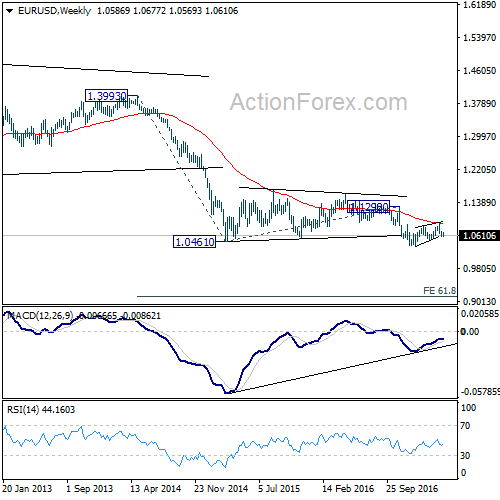
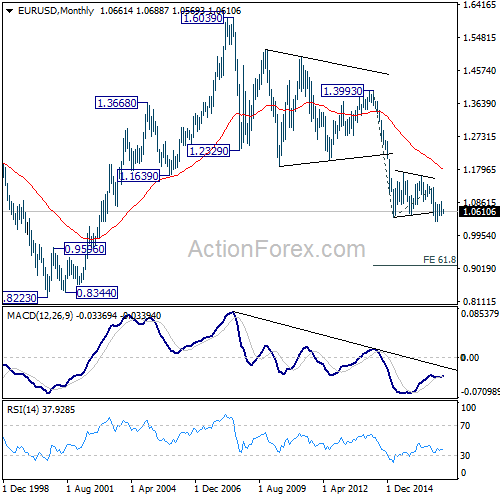
In the long term picture, the down trend from 1.6039 (2008 high) is still in progress and there is no clear sign of completion. We'd expect more downside towards 0.8223 (2000 low) as long as 1.1298 resistance holds. However, firm break of 1.1298 should now confirm long term reversal.
USD/JPY Weekly Outlook
USD/JPY's fall from 118.65 extended to as low as 108.52 last week. The firm break of 55 week EMA argues that rise from 98.97 is completed already. And deeper fall could be seen to 98.97 and below to extend the correction pattern from 125.85.
Initial bias in USD/JPY remains on the downside this week. Deeper fall would be seen to 61.8% retracement of 98.97 to 118.65 at 106.48. Sustained break there will pave the way back to 98.97 low. On the upside, break of 110.10 support turned resistance is needed to be the first sign of short term bottoming. Otherwise, outlook will remain mildly bearish in case of recovery.
In the bigger picture, price actions from 125.85 high are seen as a corrective pattern. Current development suggests that it's not completed yet and is extending. In case of deeper decline, downside should be contained by 61.8% retracement of 75.56 to 125.85 at 94.77 to bring rebound. Rise from 75.56 is still expected to resume later after the correction from 125.85 completes.
In the long term picture, the rise from 75.56 long term bottom to 125.85 medium term top is viewed as an impulsive move. Price actions from 125.85 are seen as a corrective move which could still extend. But, up trend from 75.56 is expected to resume at a later stage for above 135.20/147.68 resistance zone.
GBP/USD Weekly Outlook
GBP/USD's strong rebound last week argues that rise from 1.2108 is still in progress. And more importantly, the consolidation pattern from 1.1946 could extend with another rise. Further rise will now be mildly is favor as long as 1.2365 support holds.
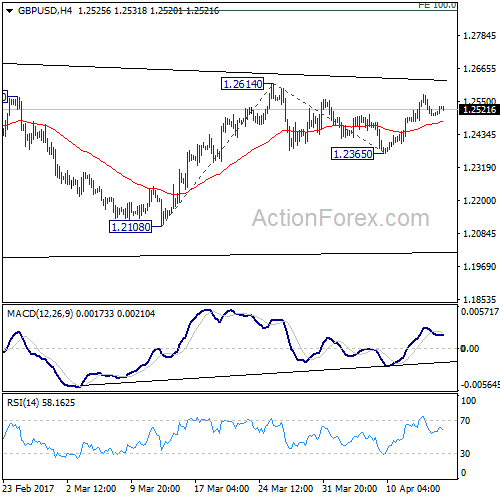
Further rise is expected in GBP/USD this week as long as 1.2365 support holds. Break of 1.2614 will resume rise from 1.2108 and target 100% projection of 1.2108 to 1.2614 from 1.2365 at 1.2871. But overall, price actions from 1.1946 low are viewed as a consolidation pattern. We'd expect strong resistance around 55 week EMA (now at 1.3034) to limit upside and bring down trend resumption. Meanwhile, break of 1.2365 will turn bias back to the downside for 1.2108 support.
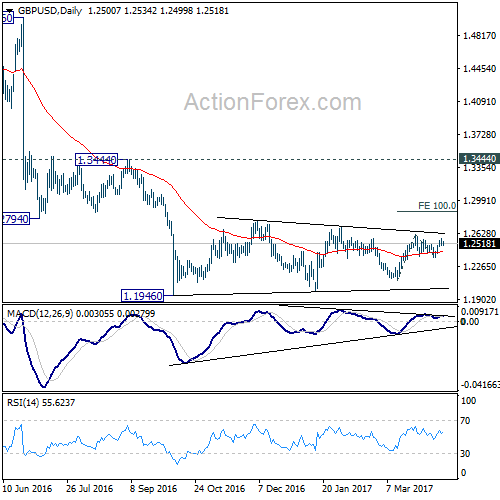
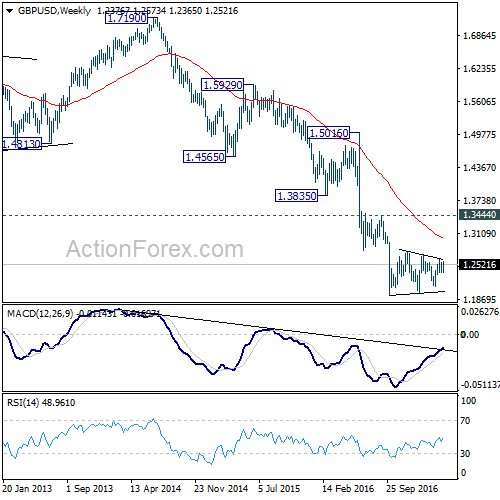
In the bigger picture, fall from 1.7190 is seen as part of the down trend from 2.1161. There is no sign of medium term reversal yet. Sustained trading below 61.8% projection of 2.1161 to 1.3503 from 1.7190 at 1.2457 will target 100% projection at 0.9532. Overall, break of 1.3444 resistance is needed to confirm medium term bottoming. Otherwise, outlook will remain bearish.
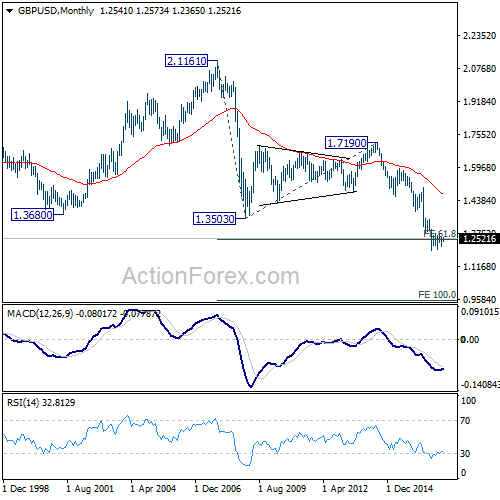
In the longer term picture, no change in the view that down trend from 2.1161 is still in progress. Current momentum suggests that the down trend will go deeper than originally expected to 100% projection of 2.1161 to 1.3503 from 1.7190 at 0.9532.
USD/CHF Weekly Outlook
USD/CHF edged higher to 1.0107 last week but retreated since then. The retreat from there is contained above 0.9980 support and thus, bullish outlook is maintained. That is corrective from 1.0342 has completed with three waves down to 0.9812. And, rise from 0.9548 is resuming.
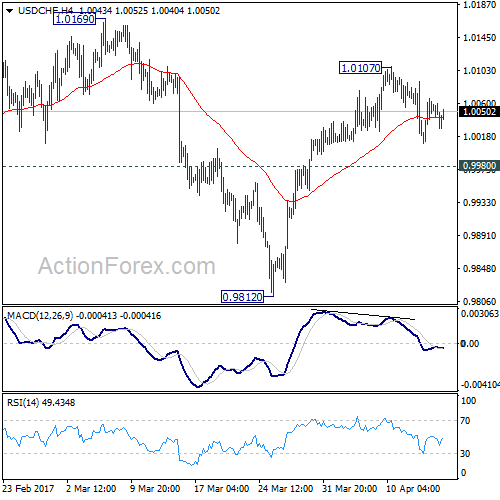
Initial bias in USD/CHF remains neutral this week first. Break of 1.0107 will turn bias to the upside for 1.0169 resistance. Break there should confirm our bullish view and should target a test on 1.0342 key resistance next. However, below 0.9980 will dampen this bullish case and turn bias back to the downside for 0.9812 low.
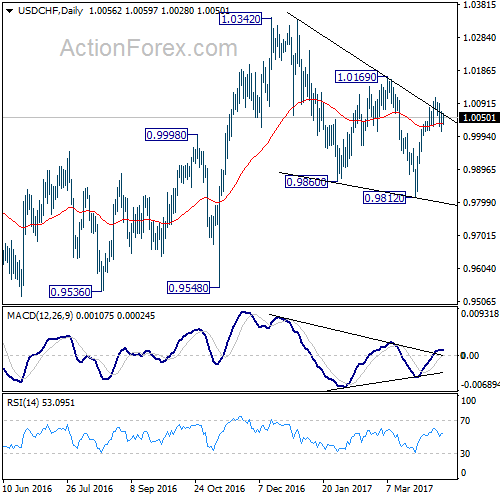
In the bigger picture, we're still maintaining that firm break of 1.0342 key resistance is needed to confirm underlying bullish momentum in the cross. However, the corrective nature of the fall from 1.0342 to 0.9812 is starting to give the medium term outlook a bullish favor. Hence, in stead of looking for topping signal around 1.0342, we'd now pay closer attention to upside acceleration as USD/CHF approaches this level again.
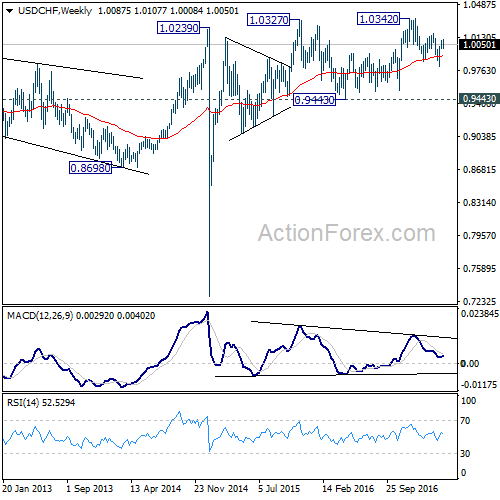
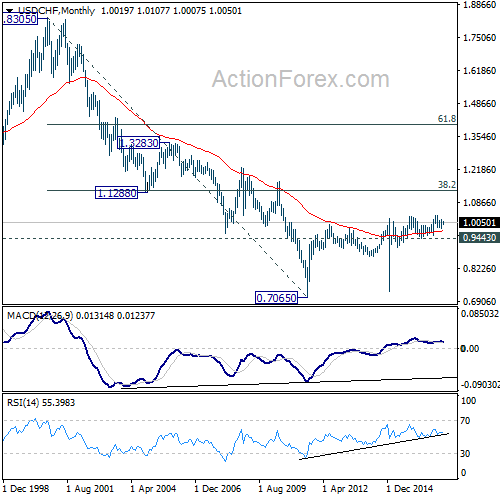
The long term outlook in USD/CHF stays a bit mixed for the moment. But in case of another medium term fall, we'd expect strong support from 0.9443/9548 support zone. Meanwhile, firm break of 1.0342 will target 38.2% retracement of 1.8305 to 0.7065 at 1.1359.
AUD/USD Weekly Outlook
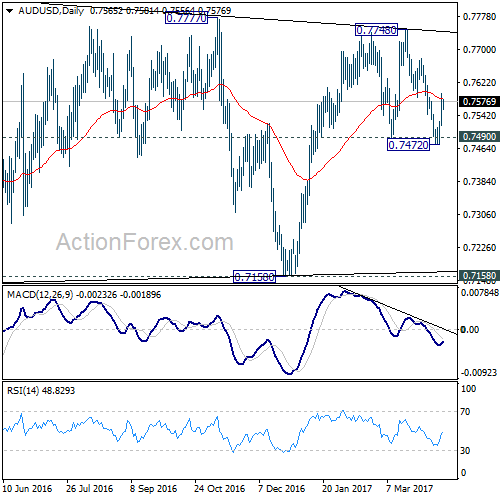
AUD/USD dipped to 0.7472 last week but failed to sustain below 0.7490 support and rebounded. The development argues that rise from 0.7158 is possibly not completed yet. And another rally could be seen through 0.7748 resistance to test key long term fibonacci level at 0.7849.
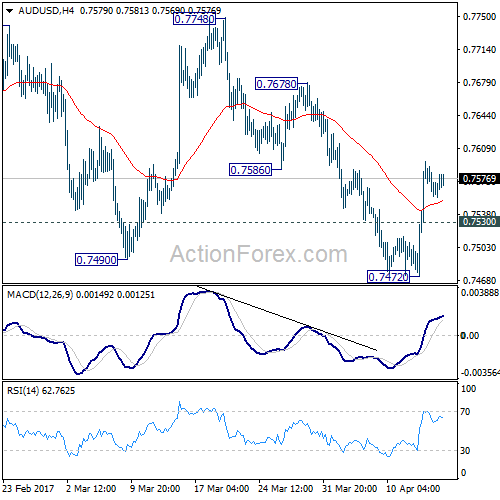
Initial bias in AUD/USD is mildly on the upside this week for 0.7678 resistance. Break there will confirm completion of the pull back from 0.7748. And rise from 0.7158 would be resuming. AUD/USD should target 0.7748 and above next. On the downside, below 0.7530 minor support will turn bias neutral again, with focus back on 0.7472 support.
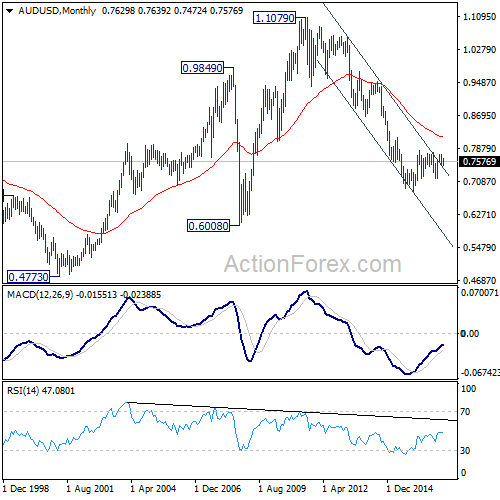
In the bigger picture, we're still treating price actions from 0.6826 low as a correction. And, as long as 38.2% retracement of 0.9504 to 0.6826 at 0.7849 holds, long term down trend from 1.1079 is expected to resume sooner or later. Break of 0.6826 low will target 0.6008 key support level. However, firm break of 0.7849 will indicate that rise from 0.6826 is developing into a medium term rebound, rather than a sideway pattern. In such case, stronger rise should be seen to 55 month EMA (now at 0.8144) and above.
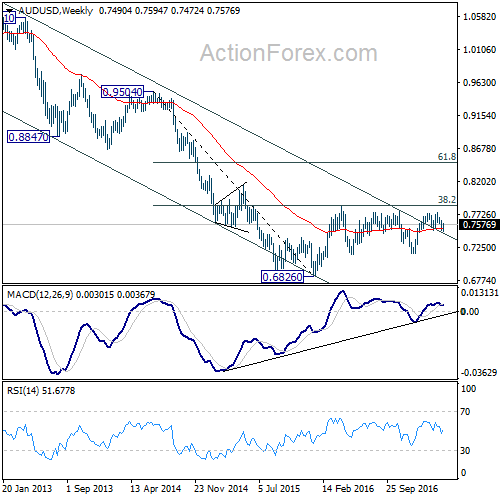
In the longer term picture, while the down trend from 1.1079 might extend lower, we're not anticipating a break of 0.6008 (2008 low) yet. We'll look for bottoming above there to reverse the medium term trend.
USD/CAD Weekly Outlook
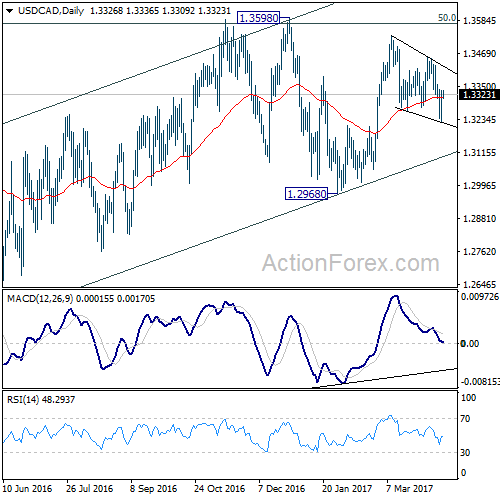
USD/CAD dipped to as low as 1.3222 last week but recovered strongly since then. The is no change in the view that price actions from 1.3534 are forming a consolidation pattern. Therefore, rise from 1.2968 and 1.2460 are not completed yet. Further rally would be seen through 1.3598 after consolidation from 1.3534 is confirmed to be finished.
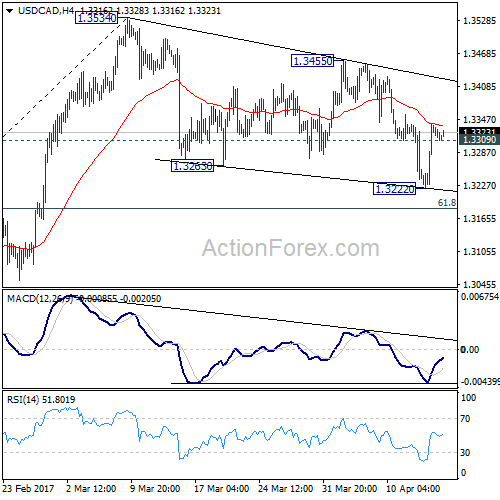
Strong rebound from 1.3222 and break of 1.3309 suggests that consolidation from 1.3534 is completed. Initial bias is back on the upside this week for 1.3455 resistance first. Break should confirm this case and resume the rise from 1.2968 to 1.3598 next. Break there will confirm resumption of whole rise from 1.2460 to next medium term fibonacci level at 1.3838. On the downside, in case of another fall, we'd expect strong support from 61.8% retracement of 1.2968 to 1.3534 at 1.3184 to contain downside and bring rebound.
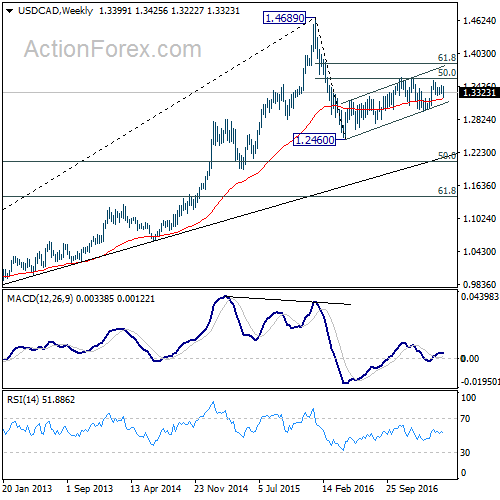
In the bigger picture, price actions from 1.4689 medium term top are seen as a correction pattern. The first leg has completed at 1.2460. The second leg from 1.2460 is likely still in progress and could target 61.8% retracement of 1.4689 to 1.2460 at 1.3838. We'd look for reversal signal there to start the third leg. However, break of 1.2968 will argue that the third leg has already started and should at least bring a retest of 1.2460 low. Meanwhile, sustained trading above 1.3838 would pave the way to retest 1.4689 high.
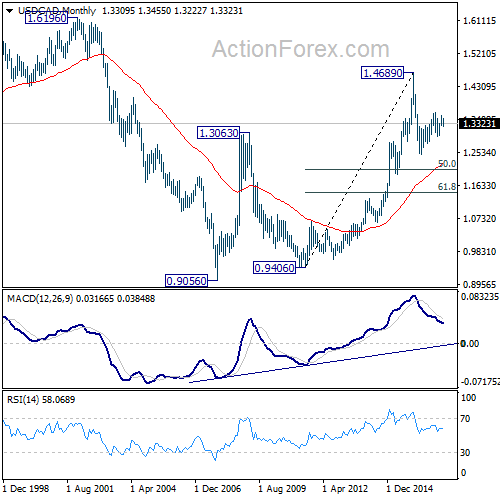
In the longer term picture, rise from 0.9056 (2007 low) is viewed as a long term up trend. It's taking a breath after hitting 1.4689. But such rise expected to resume later to test 1.6196 down the road.
GBP/JPY Weekly Outlook
GBP/JPY's choppy fall from 144.77 extended last week and reached as low as 135.99. Such decline is expected to continue to medium term fibonacci level at 135.29. At this point, since we're viewing price actions from 148.42 as a corrective pattern. We'll look for support from 135.29 to contain downside and bring rebound.
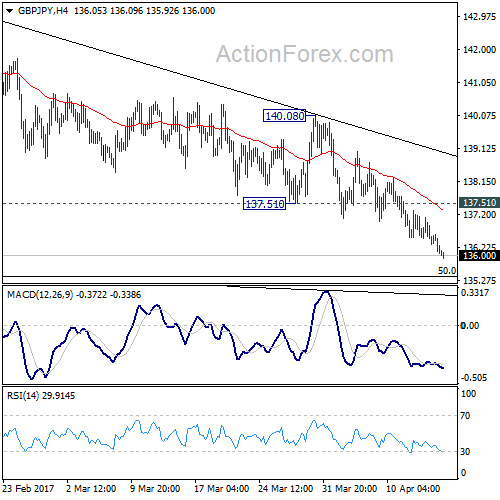
Initial bias in GBP/JPY remains on the downside tis week for medium term fibonacci level at 135.39. We'd anticipate strong support from there to bring rebound. On the upside, break of 137.51 support turned resistance will turn intraday bias back to the upside. Break of 140.08 resistance will confirm near term reversal. However, sustained break of 135.39 will dampen our view and target next fibonacci level at 132.31.
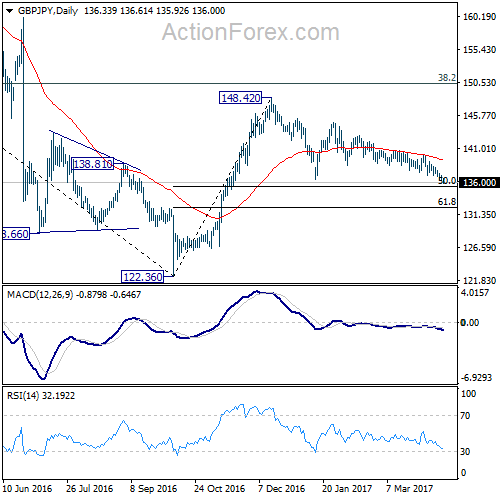
In the bigger picture, price actions from 122.36 medium term bottom are still seen as a corrective pattern. As long as 50% retracement of 122.36 to 148.42 at 135.39 holds, another rising leg would be seen to 38.2% retracement of 195.86 to 122.36 at 150.42 and possibly above. However, firm break of 135.39 will bring retest of 122.36, with prospect of resuming the larger down trend from 195.86.
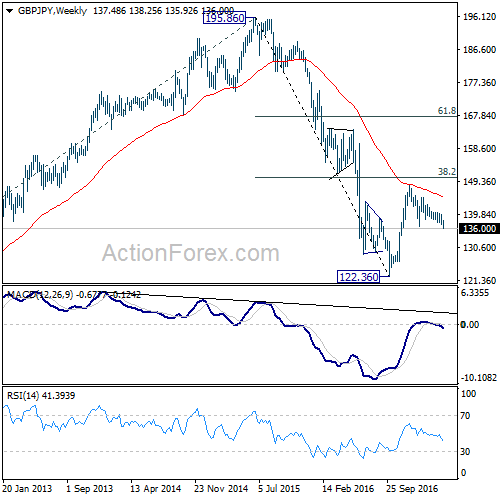
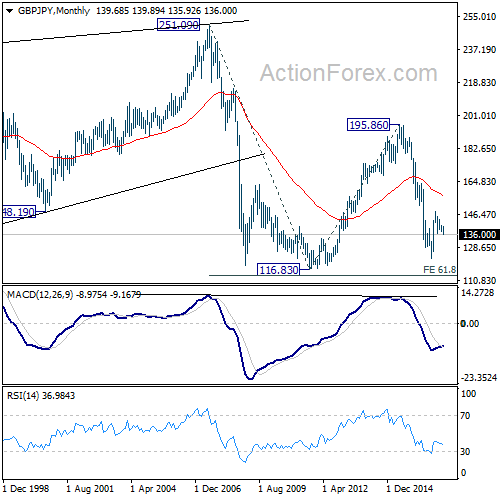
In the longer term picture, while price actions from 122.36 would develop into a medium term correction, fall from 195.86 is still seen as resuming the down trend from 251.09 (2007 high). Hence, after the correction from 122.36 completes we'd expect another fall through 116.83 low.
EUR/JPY Weekly Outlook
EUR/JPY's fall from 124.08 continued last week and reached as low as 115.19. The development is consistent with our view that corrective rise from 109.20 has completed at 124.08. And further fall is expected to retest 109.20.
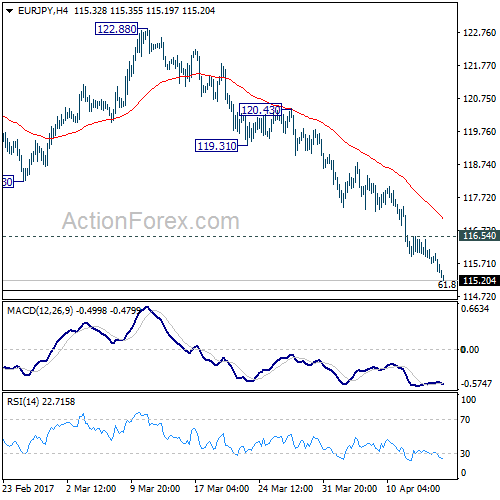
Initial bias in EUR/JPY remains on the downside this week for 61.8% retracement of 109.20 to 124.08 at 114.88. Sustained break of 114.88 will pave the way for retesting 109.20 low. On the upside, above 116.54 minor resistance will turn intraday bias neutral and bring recovery. But upside should be limited by 118.23 support turned resistance and bring fall resumption.
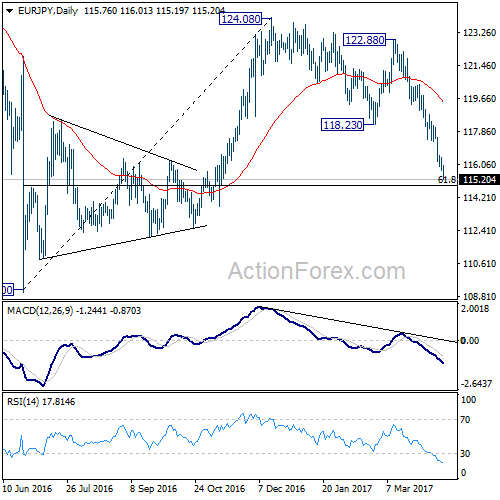
In the bigger picture, medium term corrective rise from 109.20 should have completed at 124.08, ahead of 126.09 support turned resistance. Medium term down trend from 149.76 is likely resuming. Break of 109.20 will target 94.11 low. In any case, break of 126.09 is needed needed to confirm medium term reversal. Otherwise, outlook will remain bearish in case of rebound.
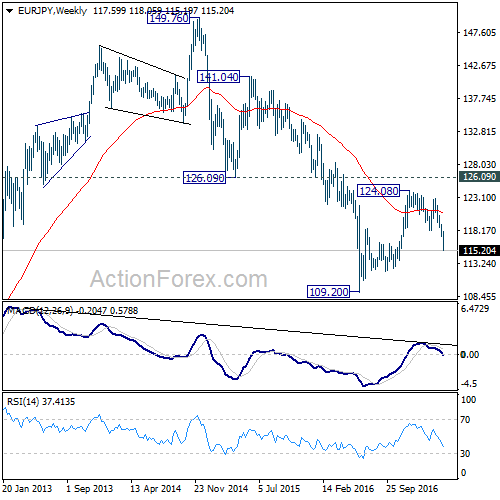
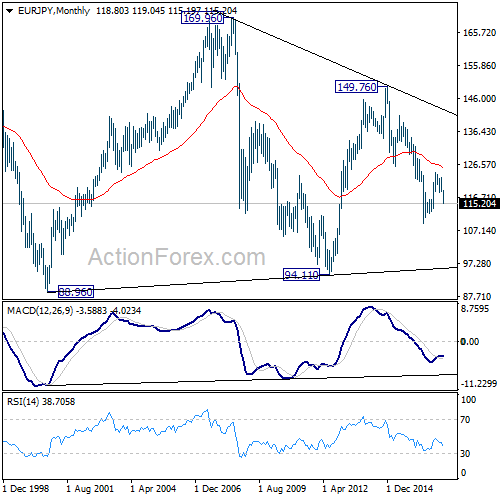
In the long term picture, medium term decline from 149.76 is seen as part of a long term sideway pattern from 88.96. Such decline is still in progress and could target 94.11 low. At this point, we'd look for loss of downside momentum above 94.11 to signal bottoming and reversal. This bearish view will hold as long as 126.09 resistance holds.
EUR/GBP Weekly Outlook
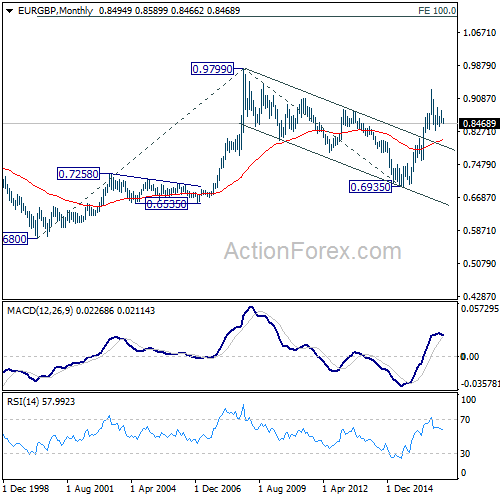
EUR/GBP's fall from 0.8786 resumed last week by taking out 0.8483 and reaches as low as 0.8466. Near term bearish outlook is unchanged. Consolidation from 0.8303 could be completed at 0.8786. Fall from 0.8786 could be developing as the third leg of the correction from 0.9304. Deeper fall is anticipated through 0.8303 support.
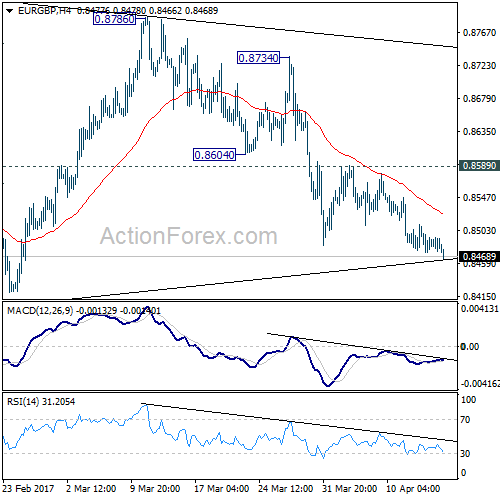
Initial bias in EUR/GBP is now on the downside this week for 0.8402 support. Firm break there should confirm our bearish view and target target 0.8303 and below. At this point, we'd expect front support from 0.8116/20 cluster support to contain downside and complete the correction from 0.9304. On the upside, break of 0.8589 resistance is needed to indicate short term bottoming. Otherwise, outlook will stay cautiously bearish in case of recovery.
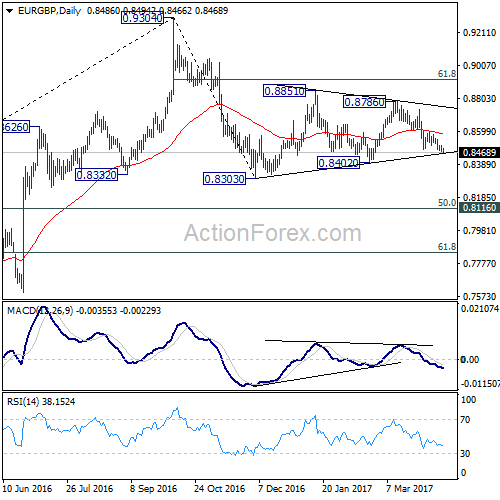
In the bigger picture, price actions from 0.9304 are viewed as a medium term corrective pattern. Such decline is likely ready to resume and should make a new low below 0.8303. At this point, we'd expect strong support from 0.8116 cluster support (50% retracement of 0.6935 to 0.9304 at 0.8120) to contain downside. Rise from 0.6935 (2015 low) will resume at a later stage to 0.9799 (2008 high). However, sustained break of 0.8116 could bring deeper decline to next key support level at 0.7564 before the correction completes.
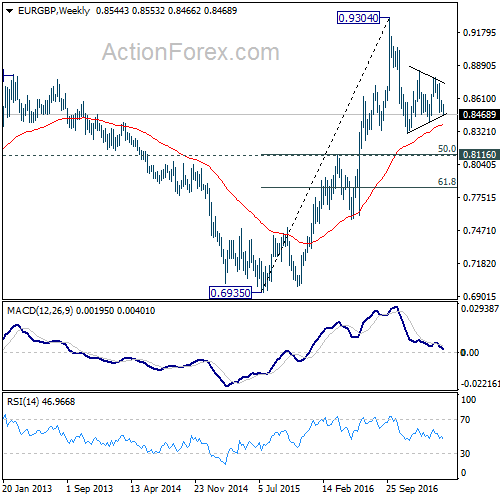
In the long term picture, firstly, price action from 0.9799 (2008 high) is seen as a long term corrective pattern and should have completed at 0.6935 (2015 low). Secondly, rise from 0.6935 is likely resuming up trend from 0.5680 (2000 low). Thirdly, this is supported by the impulsive structure of the rise from 0.6935 to 0.9304. Hence, after the correction from 0.9304 completes, we'd expect another medium term up trend to target 0.9799 high and above.