Sample Category Title
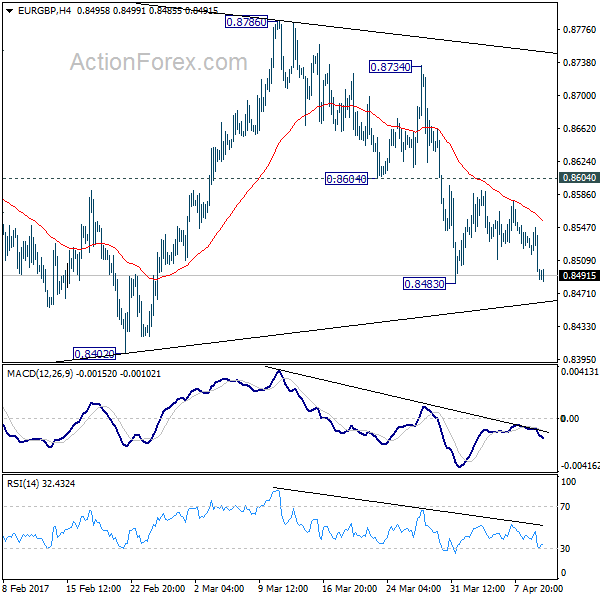
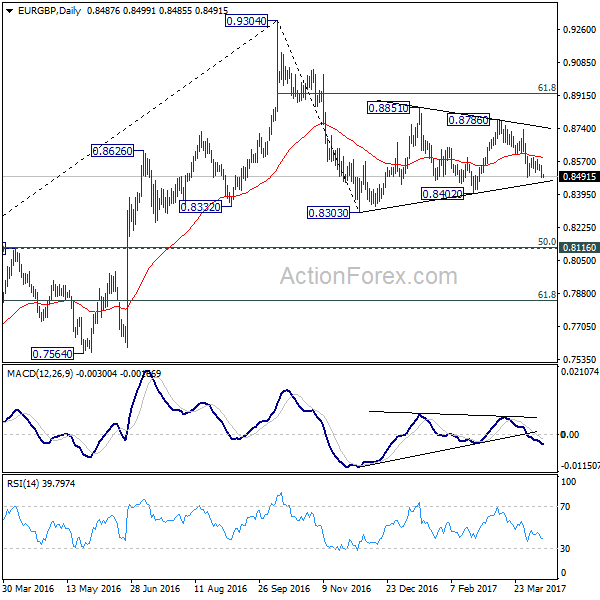
EUR/GBP Daily Outlook
Daily Pivots: (S1) 0.8468; (P) 0.8508; (R1) 0.8529; More...
EUR/GBP is holding above 0.8483 temporary low and intraday bias remains neutral. As noted before, decline from 0.8786 could be developing into the third leg of the whole corrective pattern from 0.9304. And hence, deeper fall is expected ahead. On the downside, break of 0.8483 will turn bias to the downside for 0.8402 support first. Decisive break there should confirm our bearish view and target 0.8303 and below. As fall from 0.9304 is viewed as a corrective move, we'd expect strong support at 0.8116/20 cluster support to contain downside and bring rebound. On the upside, above 0.8604 minor resistance will delay the bearish case. That is, one more recovery will be seen to complete a five wave triangle pattern fro 0.8303 before completion.
In the bigger picture, price actions from 0.9304 are viewed as a medium term corrective pattern. Such decline is likely ready to resume and should make a new low below 0.8303. At this point, we'd expect strong support from 0.8116 cluster support (50% retracement of 0.6935 to 0.9304 at 0.8120) to contain downside. Rise from 0.6935 (2015 low) will resume at a later stage to 0.9799 (2008 high). However, sustained break of 0.8116 could bring deeper decline to next key support level at 0.7564 before the correction completes.
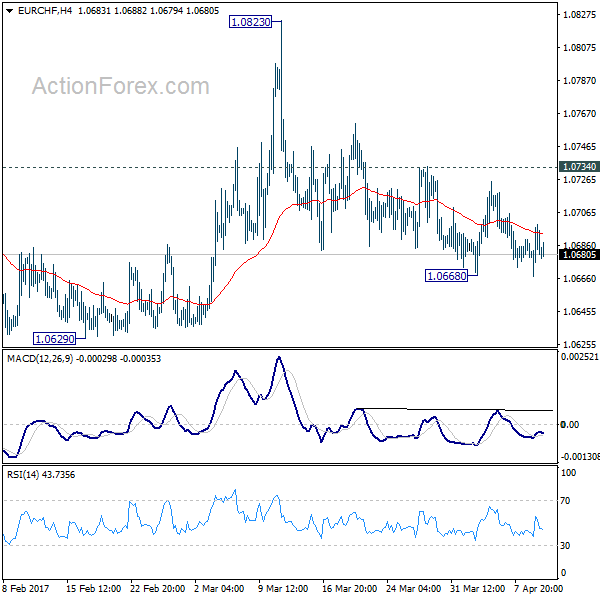
EUR/CHF Daily Outlook
Daily Pivots: (S1) 1.0667; (P) 1.0683; (R1) 1.0698; More...
EUR/CHF is still bounded in range above 1.0668 and intraday bias stays neutral. But the bearish outlook is unchanged with 1.0734 resistance intact. That is, rebound from 1.0629 has completed at 1.0823. And the larger decline from 1.1198 is likely still in progress. On the downside, below 1.0668 will target 1.0620/29 key support zone. Decisive break there will resume whole fall from 1.1198 and target next long term fibonacci level at 1.0485. Nonetheless, break of 1.0734 will suggest that pull back from 1.0823 is completed and turn bias back to the upside for this resistance.
In the bigger picture, the decline from 1.1198 is seen as a corrective move. Current development suggests that it's not completed yet. Sustained trading below 38.2% retracement of 0.9771 to 1.1198 at 1.0653 will target 50% retracement at 1.0485. In any case, break of 1.0823 resistance is needed to be the first indication of reversal. Otherwise, deeper fall is still expected even in case of recovery.
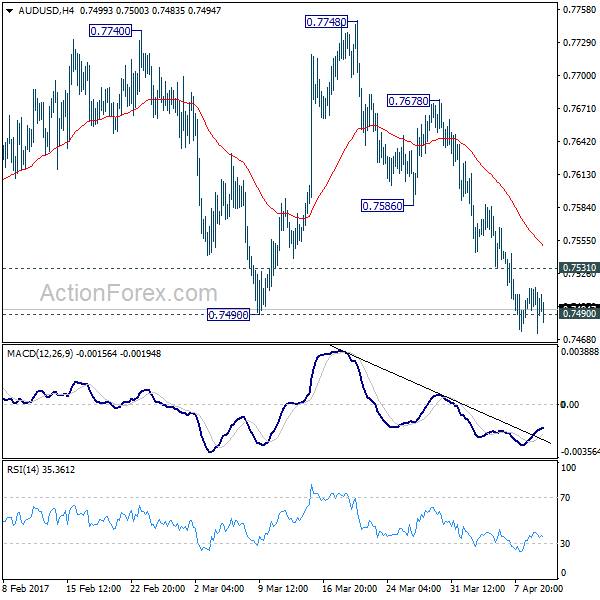
AUD/USD Daily Outlook
Daily Pivots: (S1) 0.7477; (P) 0.7495; (R1) 0.7517; More...
Intraday bias in AUD/USD is turned neutral for the moment. Rise from 0.7158 is likely completed at 0.7748. And, near term trend has reversed. Sustained break of 0.7490 support should confirm this bearish case. And, deeper fall should be seen back to 0.7158 support zone next. On the upside, above 0.7351 minor resistance with dampen this view and turn bias back to the upside for 0.7586/7678 resistance zone instead.
In the bigger picture, we're still treating price actions from 0.6826 low as a correction. And, as long as 38.2% retracement of 0.9504 to 0.6826 at 0.7849 holds, long term down trend from 1.1079 is expected to resume sooner or later. Break of 0.6826 low will target 0.6008 key support level. However, firm break of 0.7849 will indicate that rise from 0.6826 is developing into a medium term rebound, rather than a sideway pattern. In such case, stronger rise should be seen to 55 month EMA (now at 0.8142) and above.
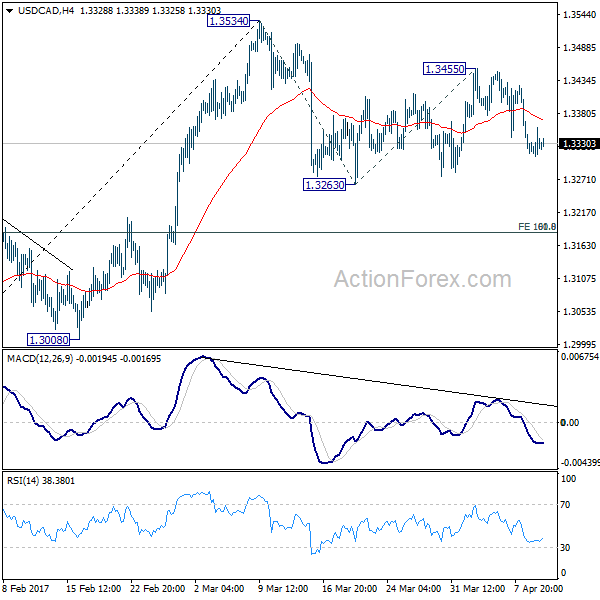
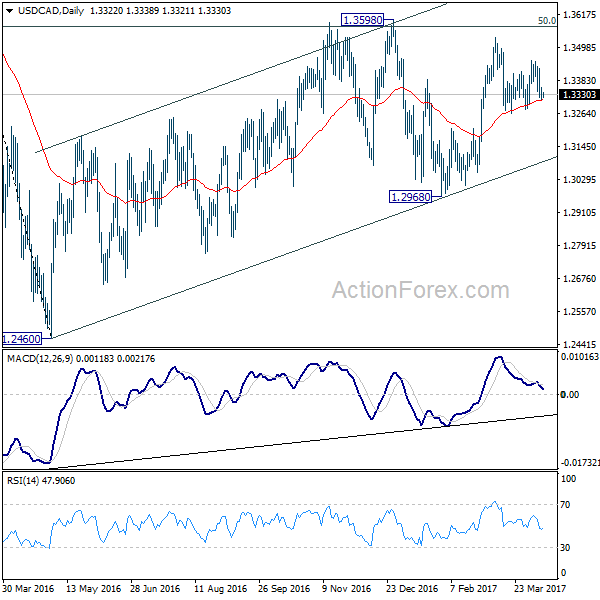
USD/CAD Daily Outlook
Daily Pivots: (S1) 1.3305; (P) 1.3331; (R1) 1.3353; More....
Intraday bias in USD/CAD remains on the downside for the moment. Corrective fall from 1.3534 is resuming and break of 1.3263 will confirm. In that case, we'd expect strong support from 1.3184 cluster level (61.8% retracement of 1.2968 to 1.3534 at 1.3184, 100% projection of 1.3534 to 1.3263 from 1.3455 at 1.3814 too) to contain downside and bring rebound. On the upside, break of 1.3455 will turn bias back to the upside for 1.3534 resistance.
In the bigger picture, price actions from 1.4689 medium term top are seen as a correction pattern. The first leg has completed at 1.2460. The second leg from 1.2460 is likely still in progress and could target 61.8% retracement of 1.4689 to 1.2460 at 1.3838. We'd look for reversal signal there to start the third leg. However, break of 1.2968 will argue that the third leg has already started and should at least bring a retest of 1.2460 low. Meanwhile, sustained trading above 1.3838 would pave the way to retest 1.4689 high.
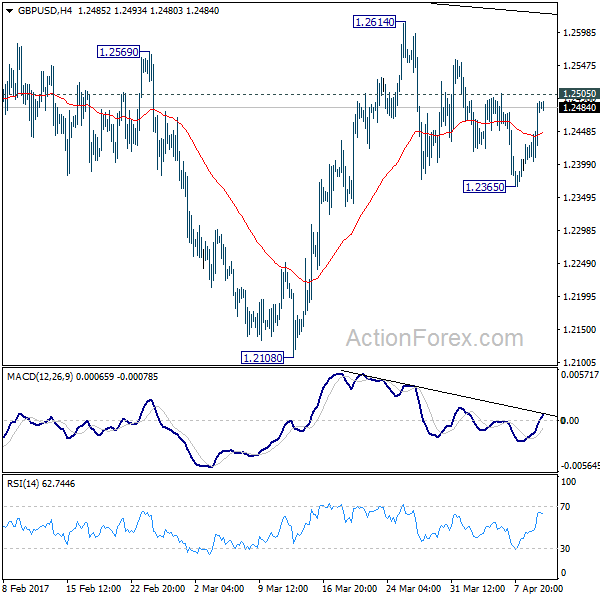
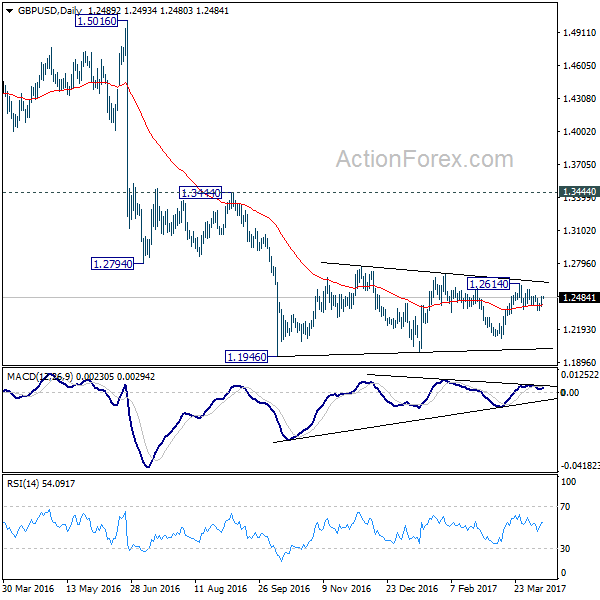
GBP/USD Daily Outlook
Daily Pivots: (S1) 1.2429; (P) 1.2462; (R1) 1.2523; More...
With 1.2505 minor resistance intact, intraday bias in GBP/USD remains neutral first. On the upside, break of 1.2505 will suggest that pull back from 1.2614 has completed at 1.2365. And rise from 1.2108 is resuming. In such case, intraday bias will be turned back to the upside for 1.2614 resistance and above. Also, that would mean that the consolidative pattern from 1.1946 is extending with another rising leg. On the downside, break of 1.2365 will revive that case that consolidation from 1.1946 has completed and turn bias to the downside for 1.2108 support.
In the bigger picture, fall from 1.7190 is seen as part of the down trend from 2.1161. There is no sign of medium term reversal yet. Sustained trading below 61.8% projection of 2.1161 to 1.3503 from 1.7190 at 1.2457 will target 100% projection at 0.9532. Overall, break of 1.3444 resistance is needed to confirm medium term bottoming. Otherwise, outlook will remain bearish.
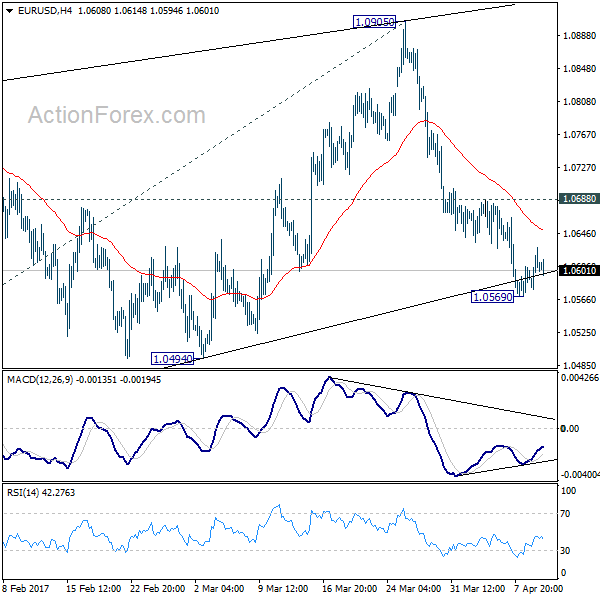
EUR/USD Daily Outlook
Daily Pivots: (S1) 1.0578; (P) 1.0604 (R1) 1.0630; More....
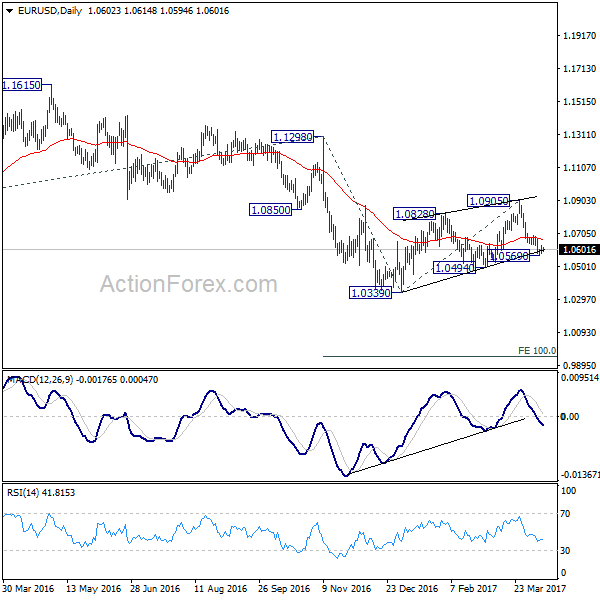
Intraday bias in EUR/USD remains neutral for consolidation above 1.0569 temporary low. Upside of recovery should be limited by 1.0688 resistance and bring fall resumption. As noted before, corrective rise from 1.0339 is likely finished after being rejected by 55 week EMA. And, the larger down trend is ready to resume. Below 1.0569 will turn bias to the downside for 1.0494 support first. Break will confirm this bearish case and send EUR/USD through 1.0339 to 100% projection of 1.1298 to 1.0339 from 1.0905 at 0.9946. On the upside, however, break of 1.0688 resistance will delay the bearish case and turn focus back to 1.0905 resistance instead.
In the bigger picture, as long as 1.1298 key resistance holds, whole down trend from 1.6039 (2008 high) is still expected to continue. Break of 1.0339 low will send EUR/USD through parity to 61.8% projection of 1.3993 to 1.0461 from 1.1298 at 0.9115. However, considering bullish convergence condition in weekly MACD, break of 1.1298 will indicate term reversal. this would also be supported by sustained trading above 55 week EMA.
USD/CHF Daily Outlook
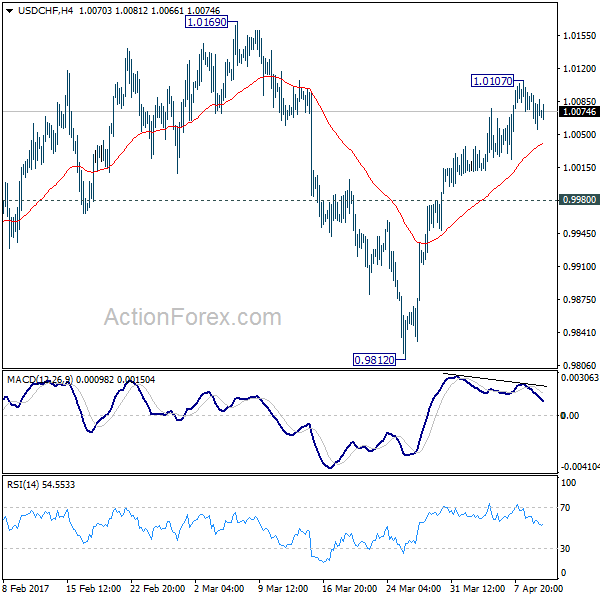
Daily Pivots: (S1) 1.0054; (P) 1.0074; (R1) 1.0092; More.....
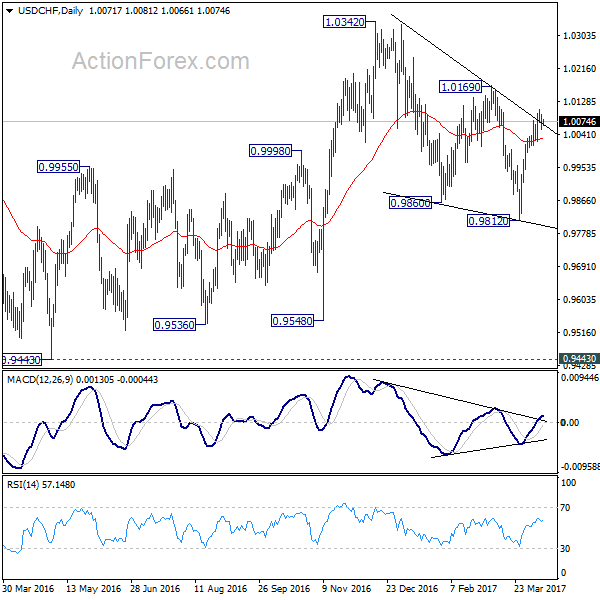
Intraday bias in USD/CHF remains neutral as the consolidation from 1.0107 continues. Outlook is unchanged that corrective fall from 1.0342 should have finished with three waves down to 0.9812. Hence, downside of retreat should be contained by 0.9980 support and bring rally resumption. Above 1.0107 will target 1.0169 resistance. Decisive break there will confirm this bullish case and target 1.0342 key resistance next. However, below 0.9980 will dampen this bullish case and turn bias back to the downside for 0.9812 low.
In the bigger picture, we're still maintain that firm break of 1.0342 key resistance is needed to confirm underlying bullish momentum in the cross. However, the corrective nature of the fall from 1.0342 to 0.9812 is starting to give the medium term outlook a bullish favor. Hence, in stead of looking for topping signal around 1.0342, we'd now pay closer attention to upside acceleration as USD/CHF approaches this level again.
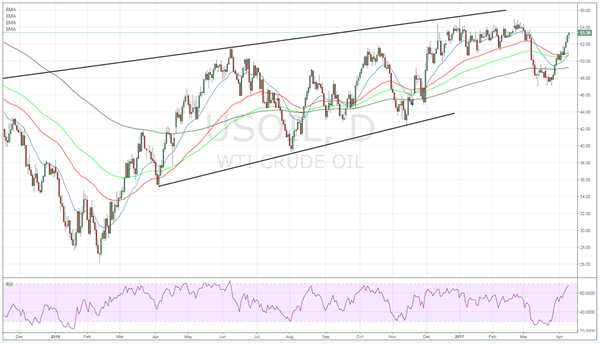
Crude Oil Continues To Rampage Higher As Saudi Arabia Signals Further Cuts Ahead
Key Points:
- Saudi Arabia signals potential extension to production cuts.
- Price action being pushed to the update by geopolitical risk.
- Medium term outlook remains unchanged despite recent rally
Crude oil prices have experienced a renaissance over the past week as concerted rallies have harkened back to the days of complete OPEC control. In particular, the price of West Texas Intermediate (WTI) has soared over the past 24 hours as, a combination of geopolitical risk and further potential supply cuts from Saudi Arabia, have buoyed the commodity. Subsequently, WTI prices currently trade around the $53.39 a barrel mark but it remains to be seen if oil can retain this level over the medium term.
The Saudi Announcement that they will seek an extension to the current production cuts during the May OPEC meeting was certainly well received by the market. Future prices immediately spiked on the prospect of additional production constraints but the reality is that this is far from a done deal given the various OPEC members propensity to cheat on production cuts. This risk is amplified given the fact that many OPEC members are currently experiencing pressures upon their foreign currency reserves and require the market share to balance their books. Subsequently, there are plenty of external pressures to suggest that the May meeting could be contentious
Additionally, the success of any future production cut agreement is likely to hinge upon the participation of a range of non-OPEC members. In the new oil reality, OPEC no longer is able to control the globally integrated oil markets without the tacit agreement, or direct collusion, of external producers. However, this is difficult to see given the levels of crude production currently being obtained in the Canadian oil sands and U.S. shale operations. It is relatively clear that advances in North American oil extraction is strongly altering the balance of power within the marketplace and sorely testing the cartel’s ability to respond.
Realistically, once most of the geopolitical risks around Syria and North Korea ebb away, so too will the upward pressure on oil prices. Rebalancing is still occurring within global markets and the rise in WTI prices is simply a distraction as U.S. shale production activity is likely to now increase, in response to the price rises. The reality is that there is plenty of pain still required before supply is balanced to a sustainable level globally.
In addition, there are also some specific concerns over the current level of demand as we head into what is effectively the driving season for the United States. There are some indications that consumer sentiment is slipping ahead of a planned tightening phase from the Federal Reserve. This could have a marked impact on crude prices, especially if we continue to see growing inventory figures emanating from the EIA.
Ultimately, Crude prices are unlikely to persist at their current level in the medium term, even with an extension of the OPEC production cut agreement. As long as we manage to avoid a conflict in either Syria or North Korea the price of oil is likely to slide back towards the $50.00 handle over the next month. This will especially be the case of EIA inventory figures continue to disappoint the market with builds. Subsequently, realise that the long play is running out of momentum and that the downside is beckoning regardless of any OPEC action.
Daily Technical Analysis: EURUSD, GBPUSD, USDJPY, USDCHF
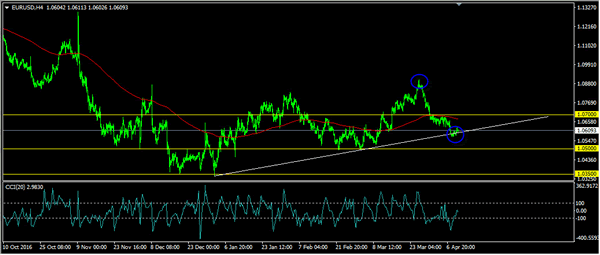
EURUSD
The EURUSD had another indecisive movement yesterday. The bias is neutral in nearest term. Overall price is still in a short-term bearish phase after a false break above 1.0873 two weeks ago, but needs a clear break below the trend line support as you can see on my H4 below to continue the bearish phase testing 1.0500. Immediate support is seen around 1.0575. A clear break below that area could trigger further bearish pressure testing 1.500 region. Immediate resistance is seen around 1.0630. A clear break above that area could trigger further bullish pressure testing 1.0700 area. Overall I remain neutral.
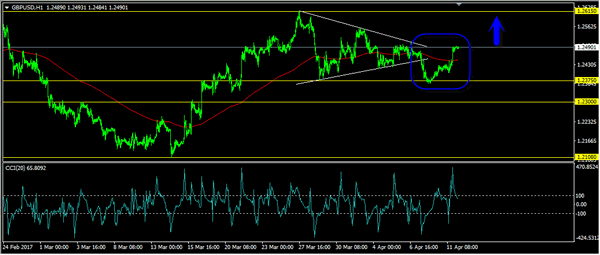
GBPUSD
The GBPUSD had a bullish momentum yesterday topped at 1.2494. The bearish scenario after broke below the triangle formation is no longer valid and price is now traded back above the H1 EMA 200 as you can see on my H1 chart below suggests a potential bullish outlook. The bias is bullish in nearest term retesting 1.2615. Immediate support is seen around 1.2450. A clear break back below that area could lead price to neutral zone in nearest term as direction would become unclear. Overall I remain neutral.
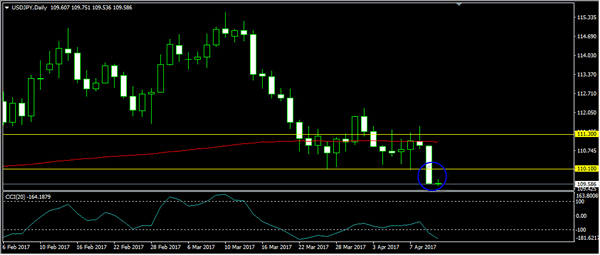
USDJPY
The USDJPY had a significant bearish momentum yesterday, broke below 110.10 key support and hit 109.34 earlier today in Asian session. The bias is bearish in nearest term testing 108.50 area. Immediate resistance is seen around 110.10. A clear break back above that area could lead price to neutral zone in nearest term as direction would become unclear. I am bearish on this pair.
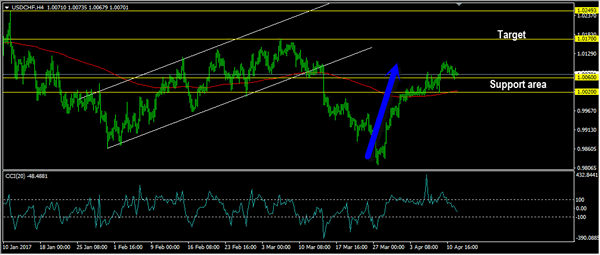
USDCHF
The USDCHF had another indecisive movement yesterday. The bias remains neutral in nearest term but price is still in a bullish phase with key support seen at 1.0060 – 1.0020 region targeting 1.0170 area. A clear break back below 1.0020 (H4 EMA 200) would interrupt the bullish phase started from 0.9813. On the upside, a clear break and daily close above 1.0170 would expose 1.0250 or higher. Overall I remain neutral.
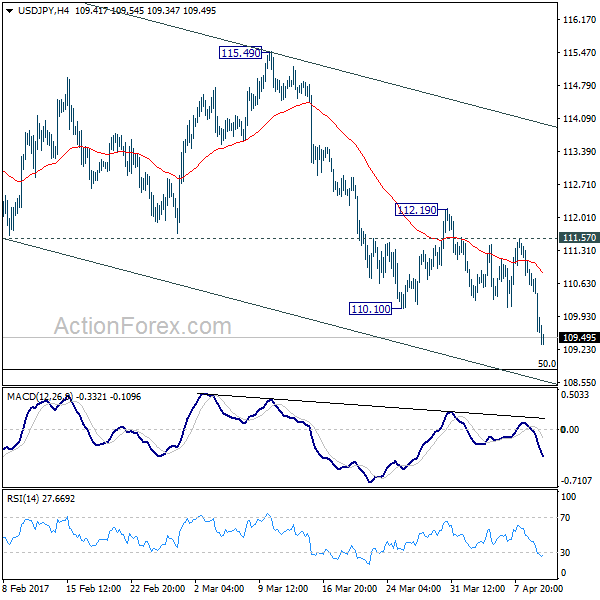
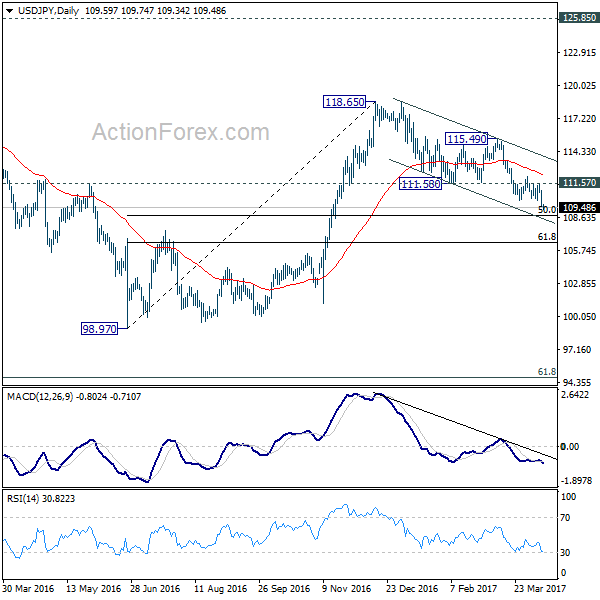
USD/JPY Daily Outlook
Daily Pivots: (S1) 109.15; (P) 110.04; (R1) 110.49; More....
USD/JPY's strong break of 110.10 support confirms resumption of near term decline from 118.65. Intraday bias is back on the downside for 50% retracement of 98.97 to 118.65 at 108.81. At this point, there is no clear indication of reversal yet and it's staying comfortably inside a falling channel. Break of 108.81 will target 61.8% retracement at 106.48 and possibly below. Meanwhile, on the upside, break of 111.57 resistance is needed to be the first sign of reversal. Otherwise, outlook will remain bearish in case of recovery.
In the bigger picture, price actions from 125.85 high are seen as a corrective pattern. Sustained trading below 55 week EMA (now at 111.15) will indicate that the second leg from 98.97 has completed at 118.65. And in that case, USD/JPY would start the third leg down through 98.97 low to 61.8% retracement of 75.56 to 125.85 at 94.77. On the upside, break of 115.49 resistance should resume the rise from 98.97 for a test on 125.85 high.