
Sample Category Title
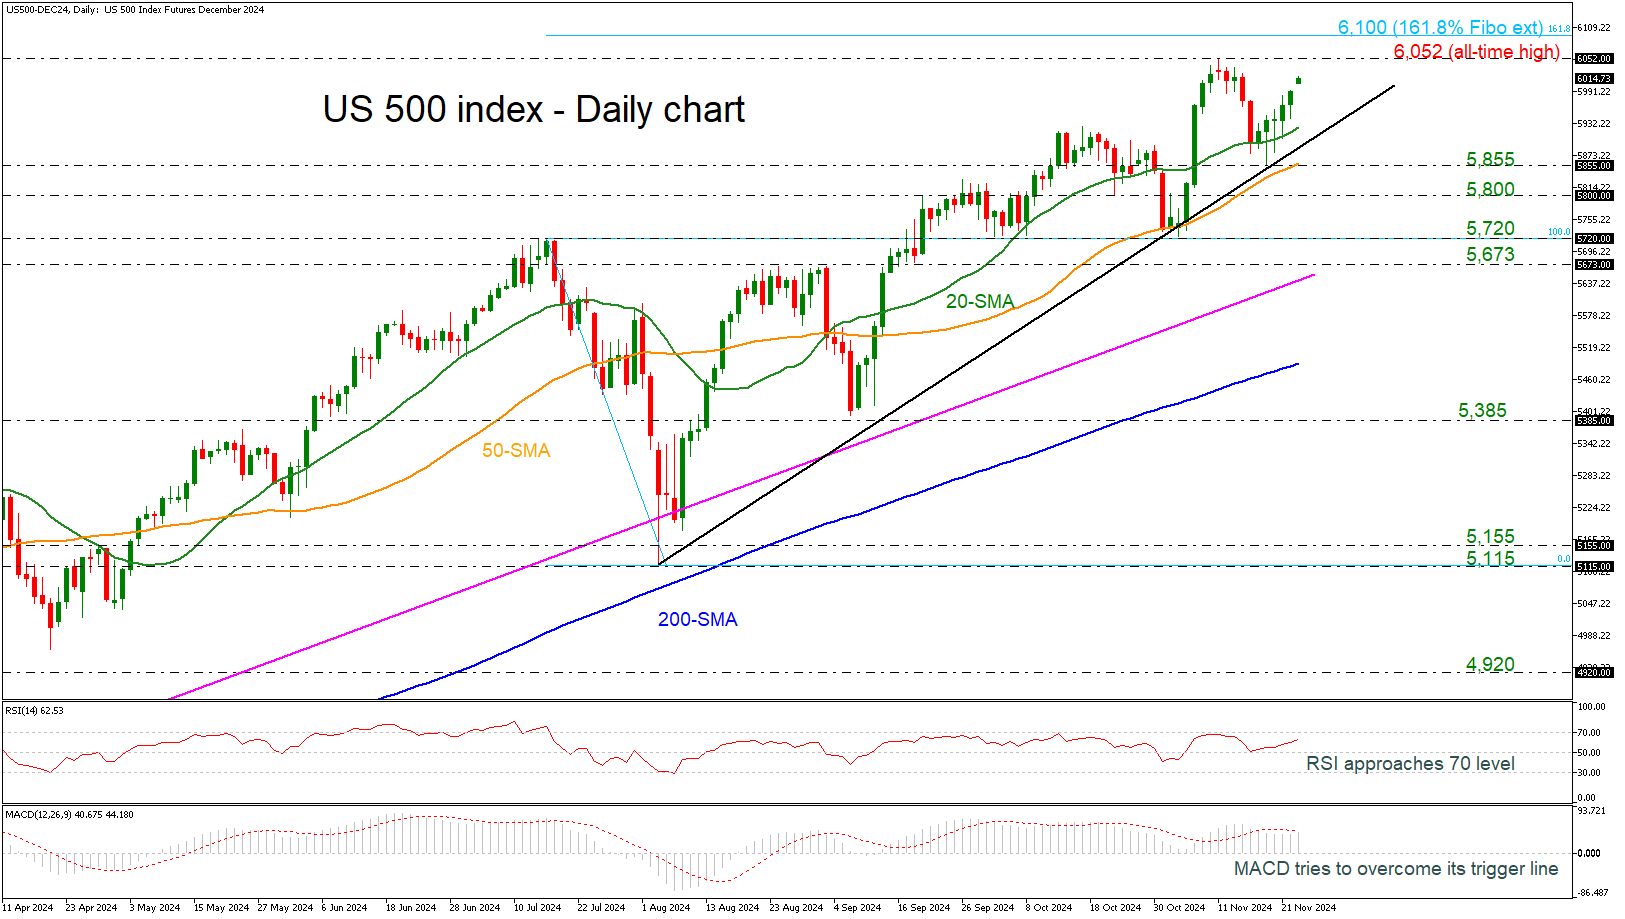
US 500 Index Bulls Hold Control Above 6,000
- US 500 rebounds from uptrend line
- RSI approaches 70 level; MACD tries to surpass its trigger line
The US 500 cash index is creating the sixth consecutive green day, following the bounce off the short-term uptrend line and the 5,855 support level. The price is currently approaching the previous all-time peak of 6,052 and the 161.8% Fibonacci extension level of the down leg from 5,720 to 5,115 at 6,100.
On the other hand, a retreat may send traders towards the 20-day simple moving average (SMA) at 5,924 ahead of the previous bottom at 5,855. A penetration of the diagonal line could endorse the negative scenario, meeting the 5,800 mark and the 5,720 support region.
According to technical oscillators, the RSI is extending its upside move above the neutral threshold of 50, while the MACD is ready to cross above its trigger line, holding beyond the zero level.
All in all, as long as the US 500 index remains above the long-term uptrend line and, more importantly, above the 200-day SMA, then the outlook remains strongly positive in the bigger picture.
BoE’s Lombardelli warns of costly risks if inflation upside materializes
I view the probabilities of downside and upside risks to inflation as broadly balanced. But at this point I am more worried about the possible consequences if the upside materialised, as this could require a more costly monetary policy response.
Lombardelli said the level of interest rates was “comfortably in restrictive territory at the moment” and supported “a gradual removal of monetary policy restriction” but the data over the coming months will be critical and need “careful observation.”
“There are some signs that the process of wage disinflation may be slowing, so it’s too early to declare victory on inflation. It’s often been said that the last mile may be the hardest, and that’s where we are now.”
EUR/USD Amid Slowing European Economy
EUR/USD encountered significant pressure, testing a low of 1.0331 before rebounding to 1.0476, as market concerns mount over the potential economic slowdown in Europe and aggressive rate cuts by the European Central Bank (ECB).
Recent business surveys indicating an accelerated economic contraction in Germany and France have starkly dampened the euro’s outlook. Additionally, under the newly elected President Donald Trump’s administration, potential new trade duties from the US threaten to exacerbate Germany’s already fragile economic state. Trump’s protectionist stance could notably impact German industries, intensifying existing internal challenges.
Investors are bracing for a scenario where the ECB might implement rate reductions more swiftly than anticipated. At the same time, the Federal Reserve may hold steady, expanding the interest rate differential unfavourably against the euro.
This backdrop has led to heightened investor nervousness about the euro’s future, with further potential declines in EUR/USD not ruled out amidst ongoing uncertainties regarding the full pricing-in of these expectations.
Technical analysis of EUR/USD
H4 chart: the EUR/USD has hit its projected low at 1.0331, subsequently initiating a rebound towards 1.0500. Upon reaching this level, a pullback to 1.0414 may occur. The market may form a consolidation range around 1.0414, with potential upward movements targeting 1.0570 and possibly extending to 1.0655. This EUR/USD outlook is supported by the MACD indicator, which suggests an impending rise from below the zero level.
H1 chart: the pair is forming a rise to 1.0500, which is anticipated as an initial target. After this level, a corrective phase towards 1.0414 is expected, suggesting a test from above. The stochastic oscillator corroborates this view, indicating a readiness to descend from a mid-range position towards lower thresholds.
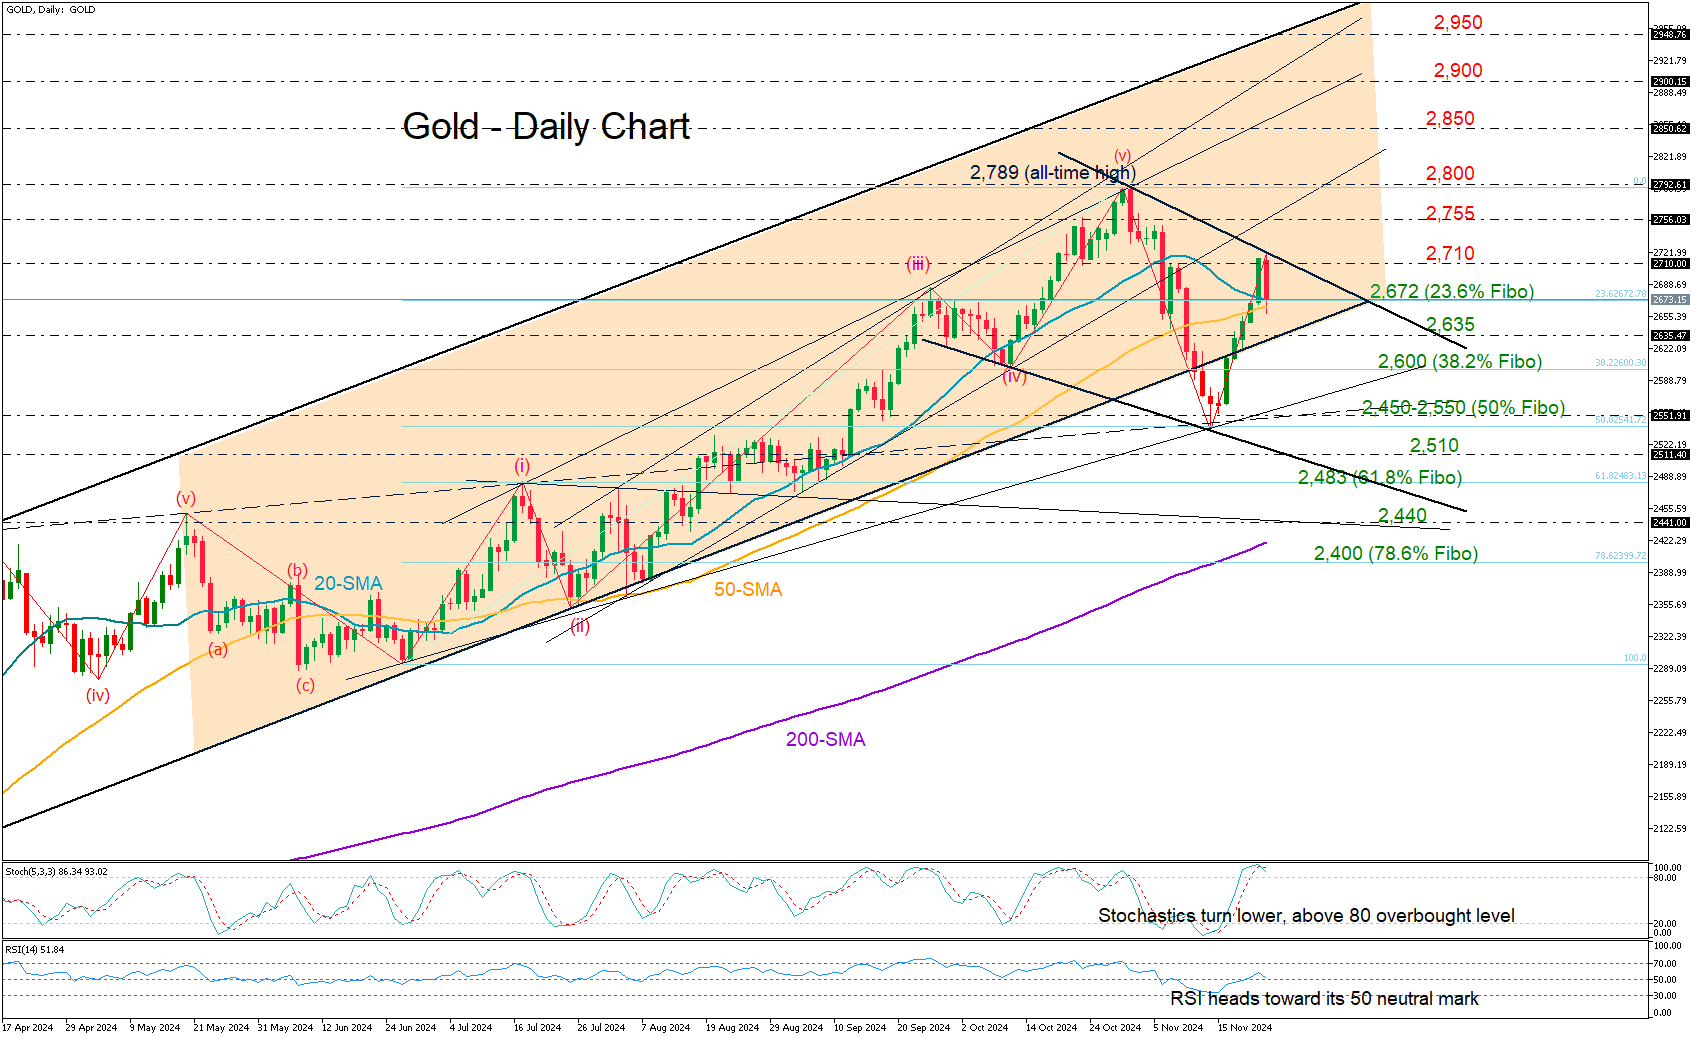
Gold Stalls Near 2,700. Is It Losing Its Shine?
- Gold switches to loses before reaching all-time high
- A consolidation phase likely in the short-term
Gold felt Monday's blues, retreating immediately toward its 20-day simple moving average (SMA) at 2,670 after five consecutive winning days.
The pullback in the price is now raising concerns about whether the metal will form a lower high in the coming sessions. With the 20-day and 50-day SMAs nearing a bearish cross, sentiment could stay downbeat, although some key support levels could still come to the rescue.
The 2,672 area, which aligns with the 23.6% Fibonacci retracement and the short-term SMAs, is currently keeping the bears busy. If it breaks, the next level to watch is 2,635, where the lower boundary of the big bullish channel sits. Then the spotlight will fall on the 38.2% (there is an extra space here) Fibonacci at $2,600, a break of which could bring attention to the $2,450-2,550 zone, where the 50% Fibonacci level lies. A drop below $2,510 would signal a bearish trend reversal, likely leading to a decline toward 2,483 or 2,440.
On the upside, if gold recovers, it could target 2,755, with a break above this level potentially clearing the path to the all-time high of 2,789, and even to 2,800. A further rise could push prices to 2,850 and possibly toward the critical trendline zone of 2,900–2,950.
In summary, gold’s bullish momentum remains at risk. A move above 2,755 would remove downside risks, while a drop below 2,510 could indicate a bearish trend reversal in the short-term picture.
Canadian Dollar Shrugs as Retail Sales Jump
The Canadian dollar has started the week with small gains. In the European session, USD/CAD is trading at 1.3958 at the time of writing, down 0.15% on the day. There are no tier-1 events out of Canada or the US today, which means we can expect a quiet day for the Canadian dollar.
Canada’s retail sales surge
The week ended on a high note as Canada’s retail sales are expected to have jumped 0.7% y/y in October. This follows an upwardly revised gain of 0.4% in September. In the third quarter, retail sales were up 0.9%.
This marks a strong turnaround after a sharp contraction in the first half of the year and indicates that the Bank of Canada’s aggressive interest rate cuts are supporting consumer spending. The BoC has chopped rates by 1.25% since June, lowering the cash rates to 3.75%, its lowest level in two years.
The BoC meets next on Dec. 11 and is expected to lower rates, with a 25 basis point cut the more likely scenario. October inflation surprised on the upside, rising from 1.6% to 2%, and today’s strong retail sales data supports a smaller size cut. As well, the government is removing a sales tax on some items from December 2024 until February 2025. This could dampen spending in November as consumers might delay purchases until December to take advantage of the sales tax holiday.
In the US, the PMI reports pointed to continued weakness in manufacturing, while the services sector continues to carry the economy. The Manufacturing PMI contracted for a fifth straight month, rising from 48.5 to 48.8. The Services PMI rose to 57.0, up from 55.0, which points to strong growth.
USD/CAD Technical
- USD/CAD is testing support at 1.3952. Below, there is support at 1.3923
- 1.3986 and 1.4015 are the next resistance lines

GBP/USD Analysis: Pair Finds Support at Psychological Level
As the GBP/USD chart shows today:
→ Since the start of the month, the pound has declined by approximately 2.5% against the US dollar.
→ The 1.2618 level has shifted from support to resistance (as indicated by arrows).
Bearish sentiment has also been fuelled by Friday’s UK data (according to Forex Factory):
→ Retail sales fell by 0.7% month-on-month.
→ PMI figures came in below analysts’ expectations.
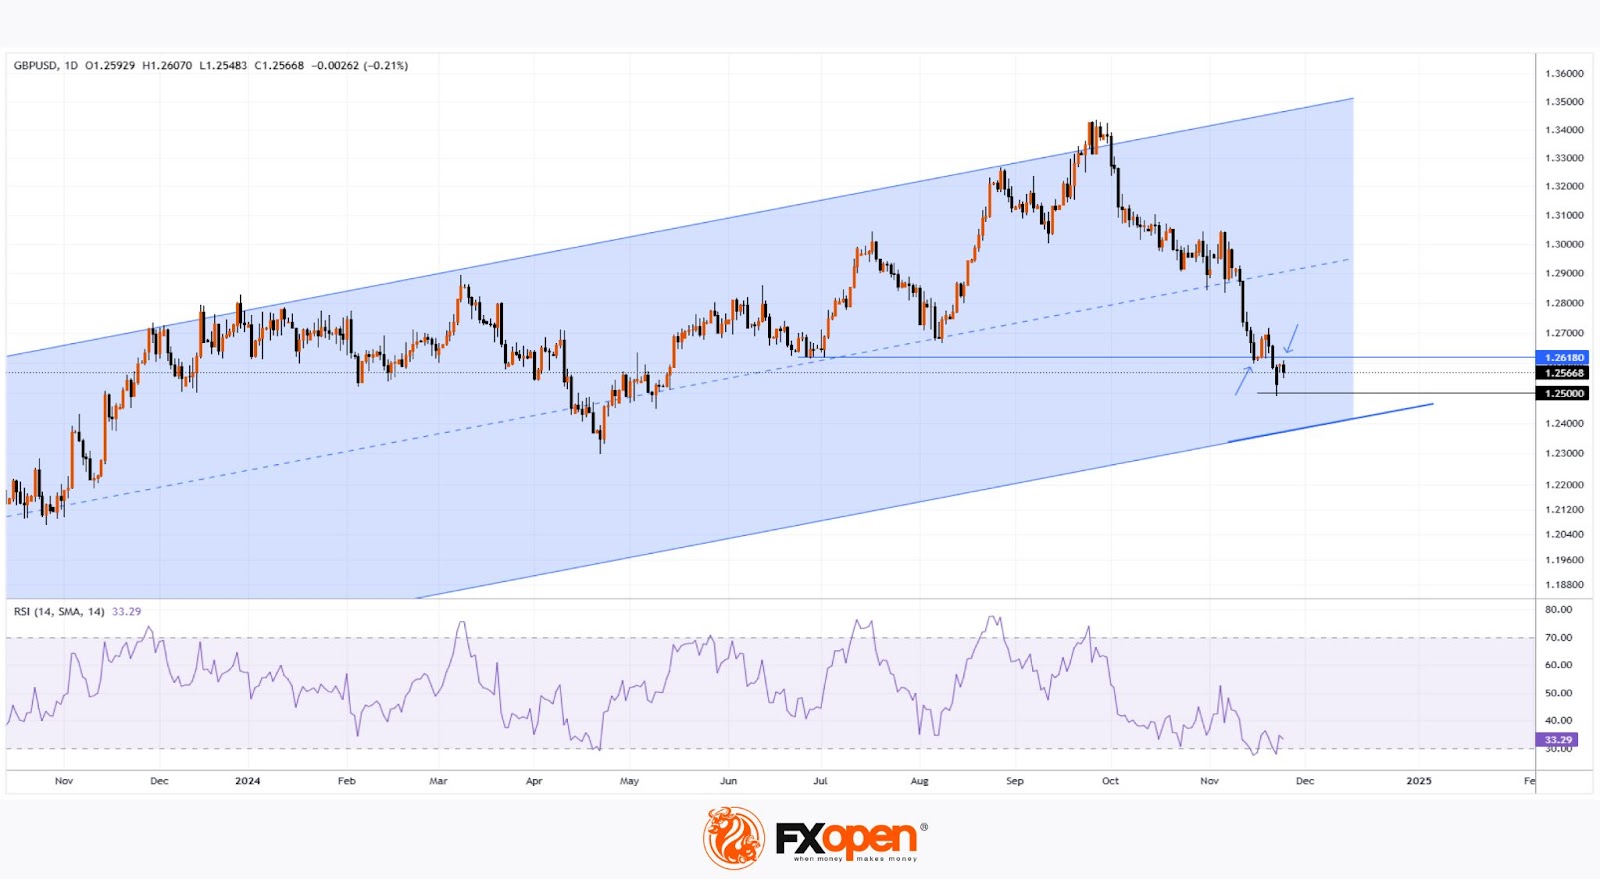
Technical analysis of the GBP/USD chart offers some optimism for bullish traders:
→ In the long term, the pair remains within an ascending channel (shown in blue), with the lower boundary potentially acting as support.
→ The RSI indicator is in oversold territory, suggesting the cheaper pound may attract buyers.
→ The psychological level of 1.25000 served as support, as the price sharply reversed upwards from it on Friday.
Upcoming US data on Wednesday is likely to have a significant impact on GBP/USD:
→ 16:30 GMT+3: GDP figures.
→ 18:00 GMT+3: PCE Price Index, a key measure of inflation.
Trade over 50 forex markets 24 hours a day with FXOpen. Take advantage of low commissions, deep liquidity, and spreads from 0.0 pips. Open your FXOpen account now or learn more about trading forex with FXOpen.
This article represents the opinion of the Companies operating under the FXOpen brand only. It is not to be construed as an offer, solicitation, or recommendation with respect to products and services provided by the Companies operating under the FXOpen brand, nor is it to be considered financial advice.
Crypto Recharged Over the Weekend
Market Picture
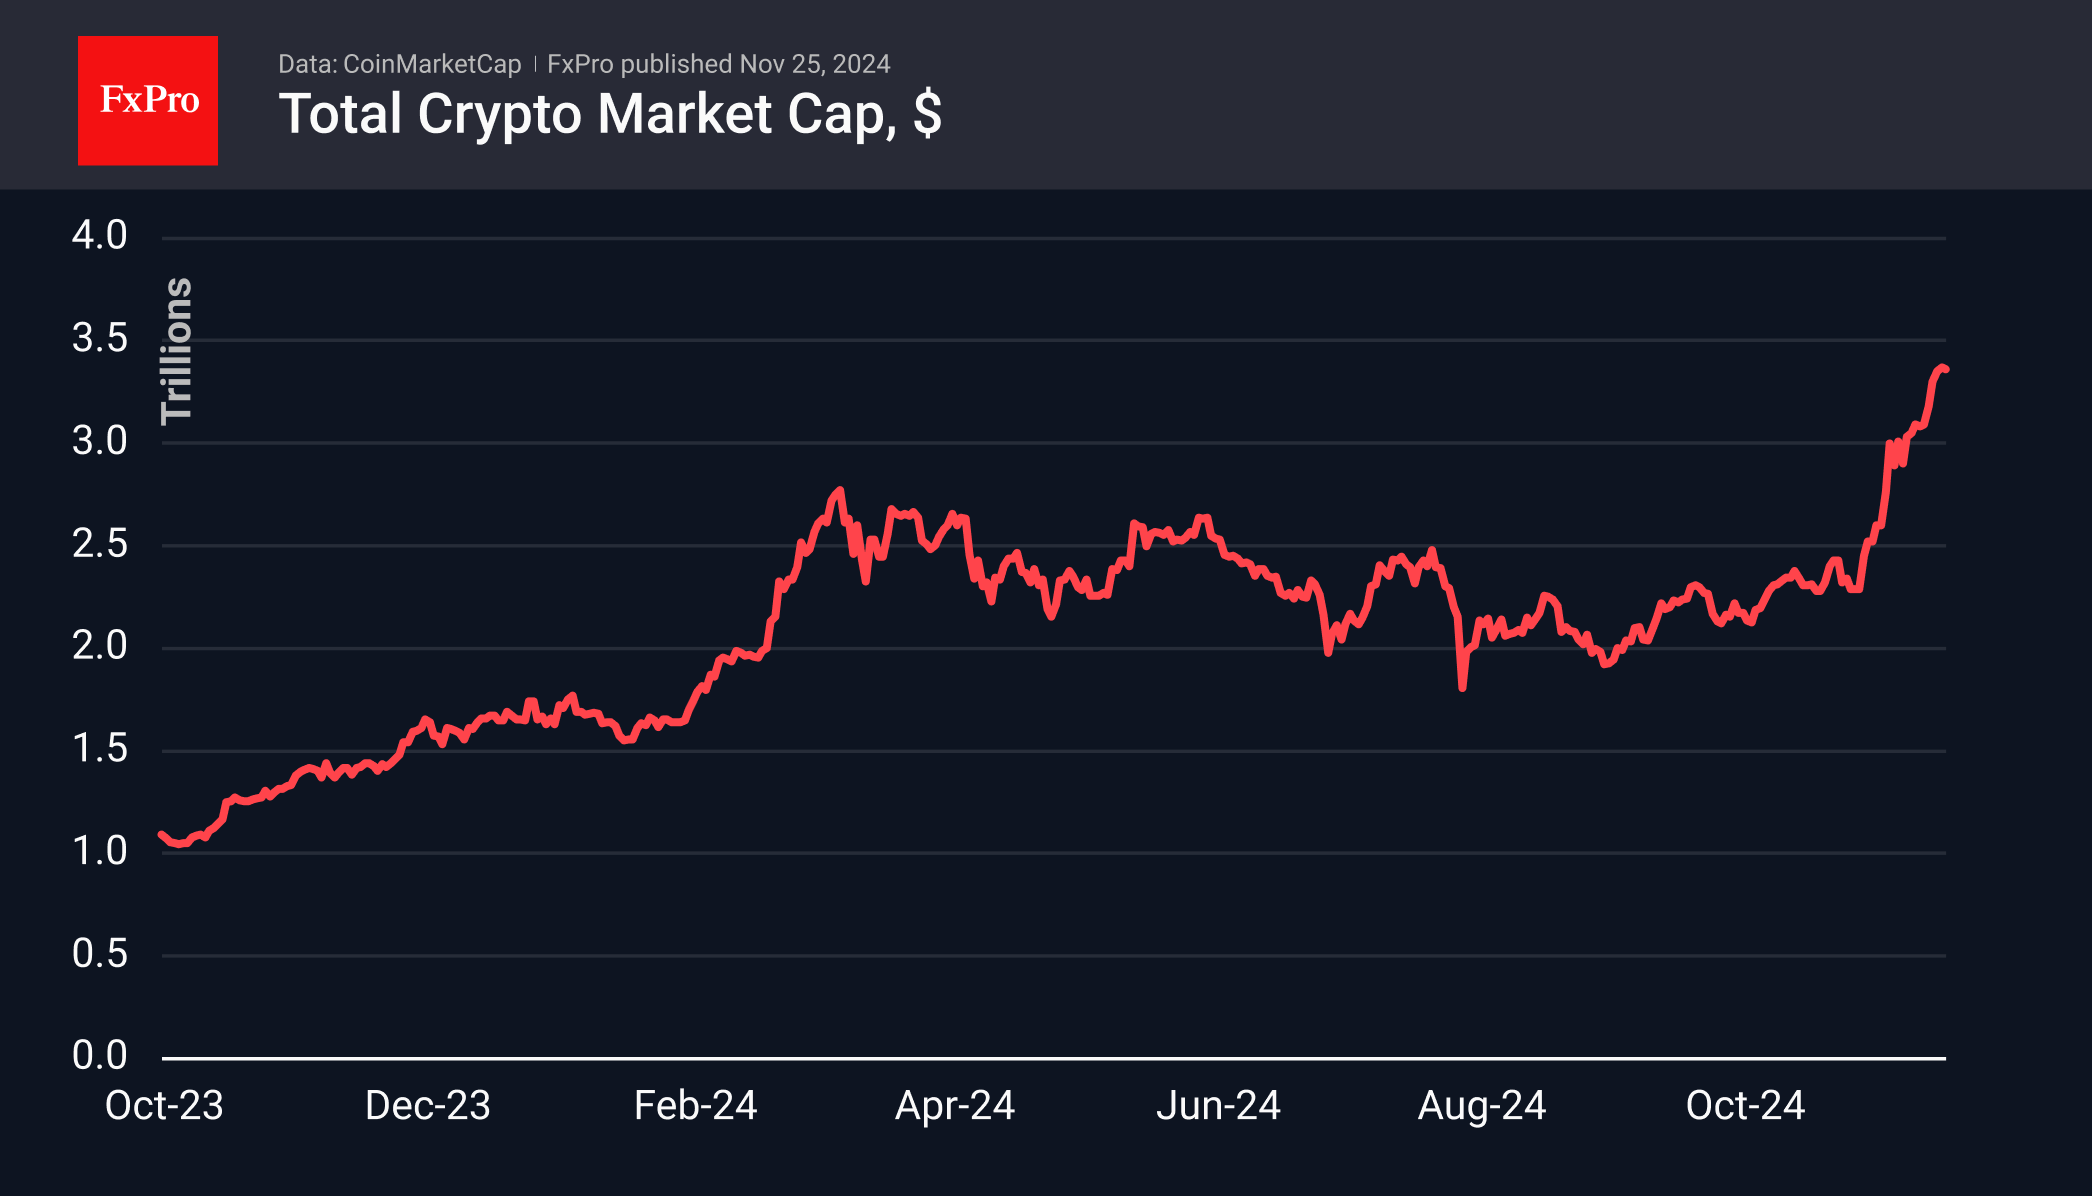
The crypto market has recharged over the weekend. Positive traction resumed on Monday after the crypto market’s total capitalisation shrank by 150 billion from Saturday’s high near $3.39 trillion to Sunday’s low. We saw more profit-taking by retail traders, and buying resumed during trading hours, setting the stage for inflows from institutional traders due to increased risk appetite in global markets.
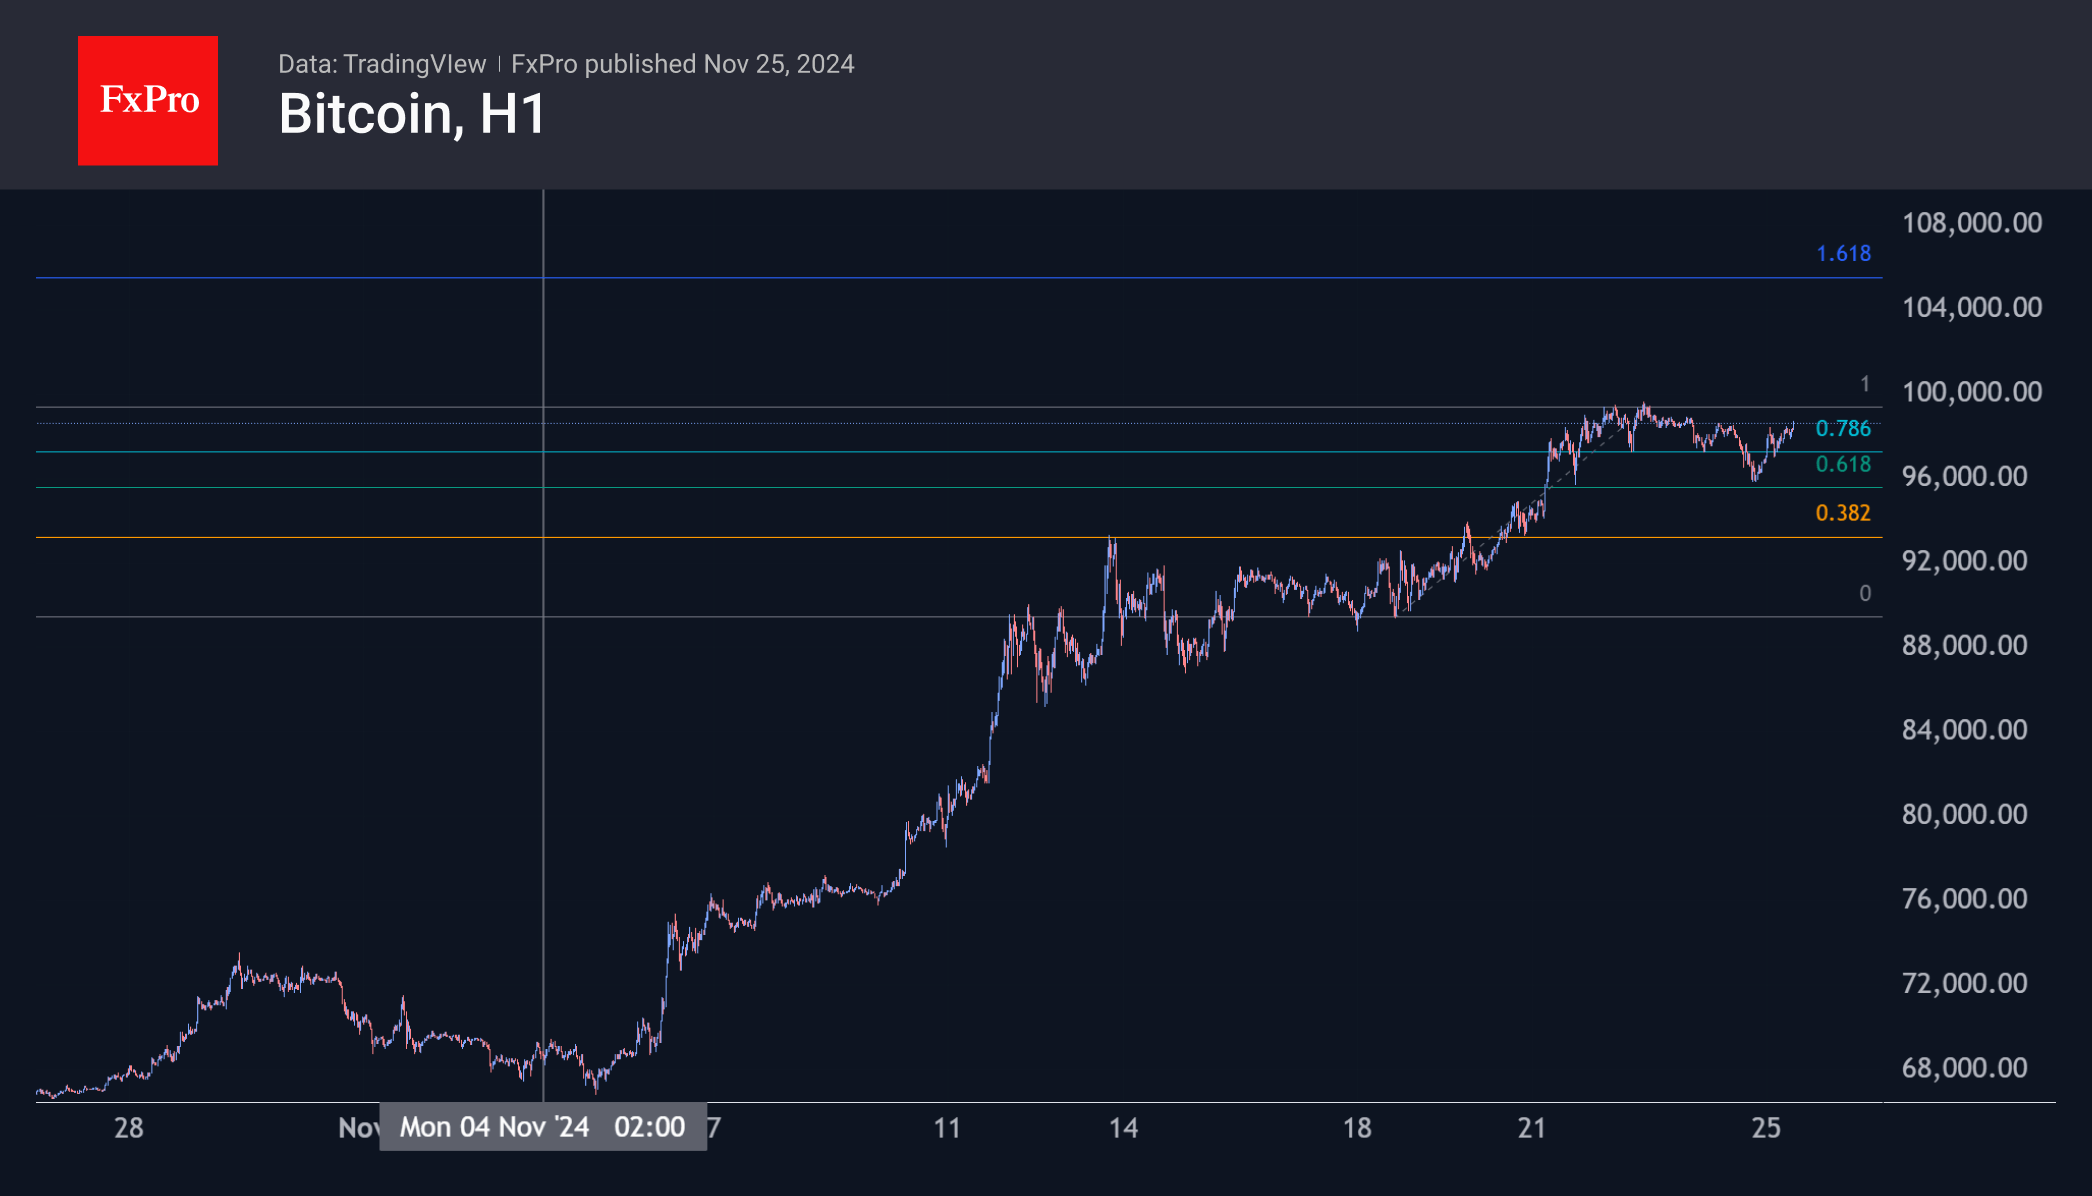
Bitcoin approached the $100K level on Friday but failed to break through and, at one point, pulled back below $96K. This looks like an intra-week correction. On Monday morning, we saw buying dominate again, taking the price back to $98.2K. The persistence of the recent pattern suggests that Bitcoin will reach the $106K level by the end of the week.
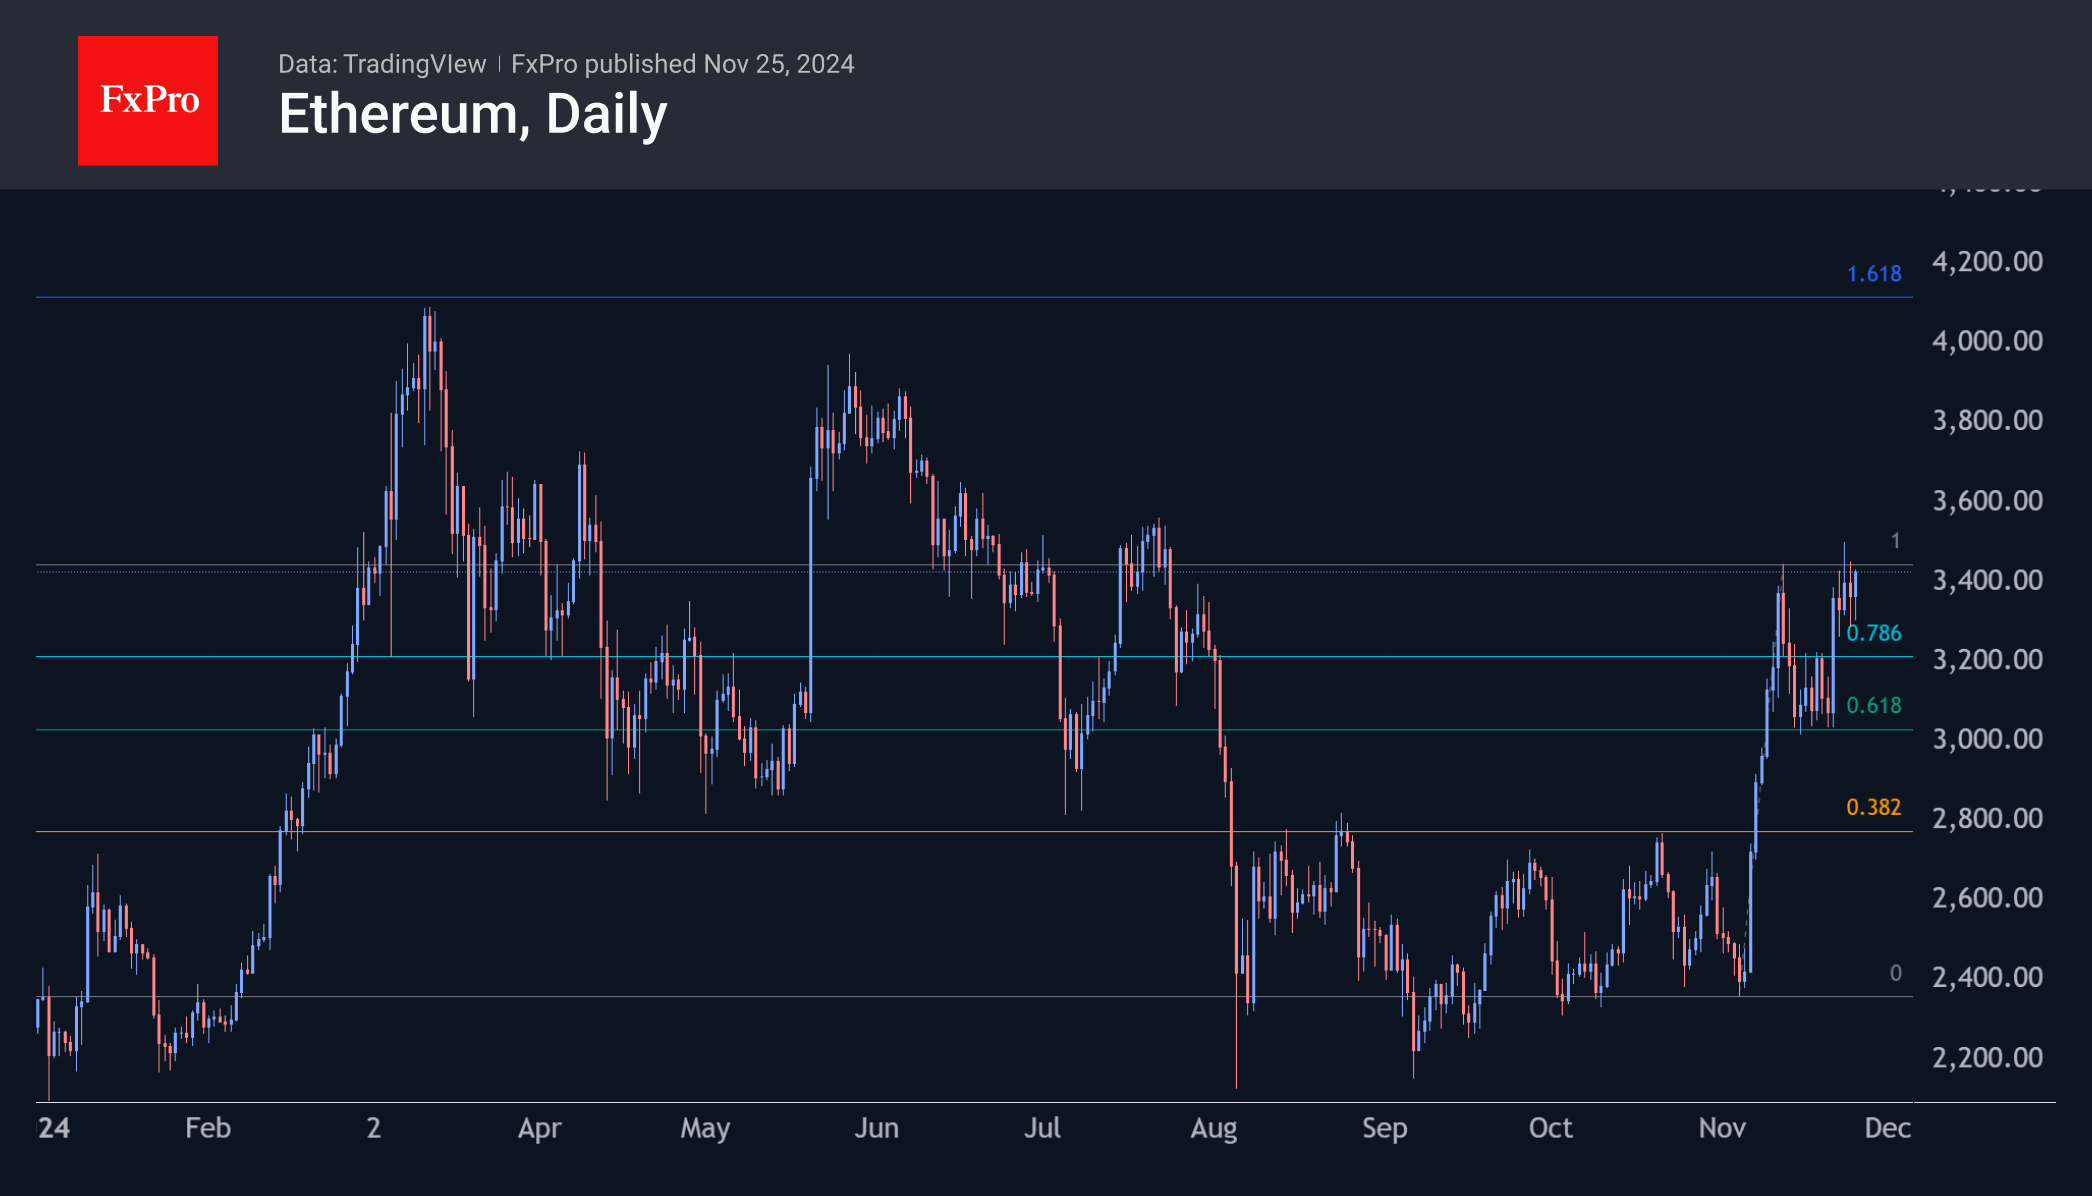
Ethereum is trading near $3400, close to the November highs. A move above $3450 could spark more active growth, with a potential target at $4000-4100, the area of the year’s highs.
News Background
According to SoSoValue, net inflows into US spot bitcoin ETFs totalled a record $3.38 billion last week, bringing total inflows since bitcoin ETFs approval in January to $30.84 billion.
Solana updated the all-time high previously set in 2021 on the back of four filings with the SEC to launch spot Solana ETFs. The Chicago Board Options Exchange (CBOE) published Forms 19b-4 for these funds.
VanEck reiterated its September Bitcoin forecast. The target price for the first cryptocurrency in the current cycle is $180,000. Several key indicators suggest that the next phase of the bull market has just begun.
According to The Block, Ethereum’s daily transferred on-chain value reached $7.13 billion, the highest since the beginning of the year. This indicates a recovery in network activity amid the cryptocurrency market rally.
Trump is expanding the number of cryptocurrency supporters in a future administration. He has nominated hedge fund manager Scott Bessent as Treasury Secretary. According to CNN, Trump is considering appointing former Bakkt CEO Kelly Leffler as Secretary of Agriculture.
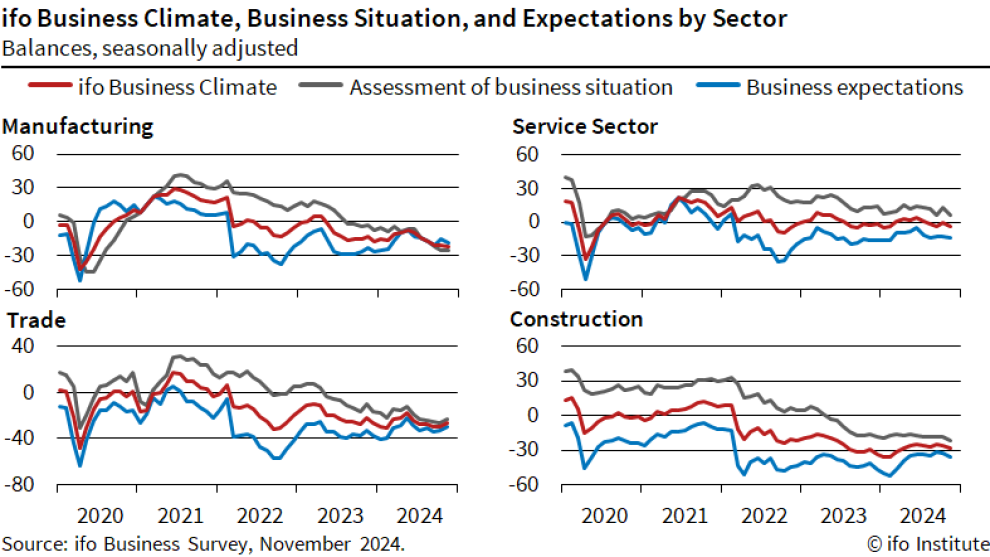
German Ifo falls to 85.7, further deterioration
Germany’s Ifo Business Climate Index declined to 85.7 in November, down from 86.5 in October, reflecting growing pessimism across key sectors of Europe’s largest economy. Current Assessment Index dropped from 85.7 to 84.3, indicating weaker confidence in present conditions. Expectations Index edged slightly lower from 87.3 to 87.2, suggesting limited optimism for the months ahead.
Sector-specific data painted a grim picture. Manufacturing sentiment worsened, dropping from -20.6 to -21.9, and the services sector also reversed, declining from 0.1 to -3.6. Construction sentiment weakened significantly, falling from -25.7 to -28.5. Trade was the only sector to show some improvement, rising from -29.4 to -26.6, though it remains firmly in negative territory.
Ifo President Clemens Fuest characterized the situation as increasingly bleak, remarking that sentiment among German companies has turned "gloomier" and that the economy is "floundering."
Gold and WTI Crude Oil Prices Signal Bullish Bias
Gold price started a fresh increase above the $2,600 resistance level. WTI Crude oil prices climbed higher above $70.00 and might extend gains.
Important Takeaways for Gold and WTI Crude Oil Prices Analysis Today
- Gold price started a steady increase from the $2,535 zone against the US Dollar.
- A connecting bullish trend line is forming with support near $2,645 on the hourly chart of gold at FXOpen.
- WTI Crude oil prices extended gains above the $68.50 and $70.00 resistance levels.
- There is a key bullish trend line forming with support at $70.30 on the hourly chart of XTI/USD at FXOpen.
Gold Price Technical Analysis
On the hourly chart of Gold at FXOpen, the price formed a base near the $2,535 zone. The price started a steady increase above the $2,600 and $2,605 resistance levels.
There was a decent move above the 50-hour simple moving average and $2,675. The bulls pushed the price above the $2,700 resistance zone. Finally, the bears appeared near $2,720. A high was formed near $2,720 and the price is now consolidating gains.
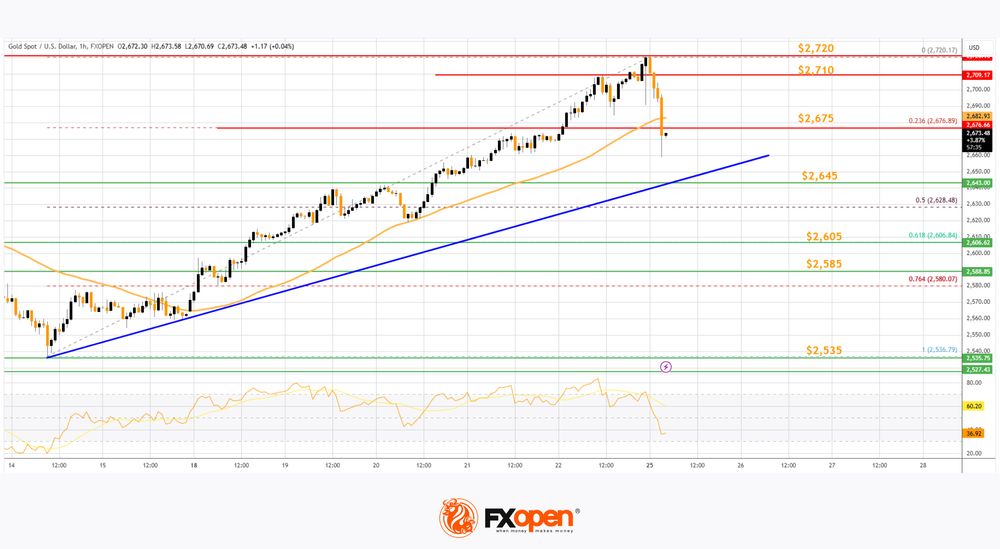
The price dipped a few points below the 23.6% Fib retracement level of the upward move from the $2,536 swing low to the $2,720 high. The RSI is now below 50 and the price is now approaching a connecting bullish trend line with support near $2,645.
If there is a downside break below the $2,645 support, the price might decline further. In the stated case, the price might drop toward the $2,605 support or the 61.8% Fib retracement level of the upward move from the $2,536 swing low to the $2,720 high. The next major support sits at $2,585.
Immediate resistance is near the $2,710 level. The next major resistance is near the $2,720 level. An upside break above the $2,720 resistance could send Gold price toward $2,740. Any more gains may perhaps set the pace for an increase toward the $2,750 level.
Oil Price Technical Analysis
On the hourly chart of WTI Crude Oil at FXOpen, the price started a major upward move from $66.50 against the US Dollar. The price gained bullish momentum after it broke the $68.50 resistance and the 50-hour simple moving average.
The bulls pushed the price above the $70.00 and $70.30 resistance levels. The recent high was formed at $71.36 and the price started a downside correction. There was a minor move below the 23.6% Fib retracement level of the upward move from the $69.19 swing low to the $71.36 high.
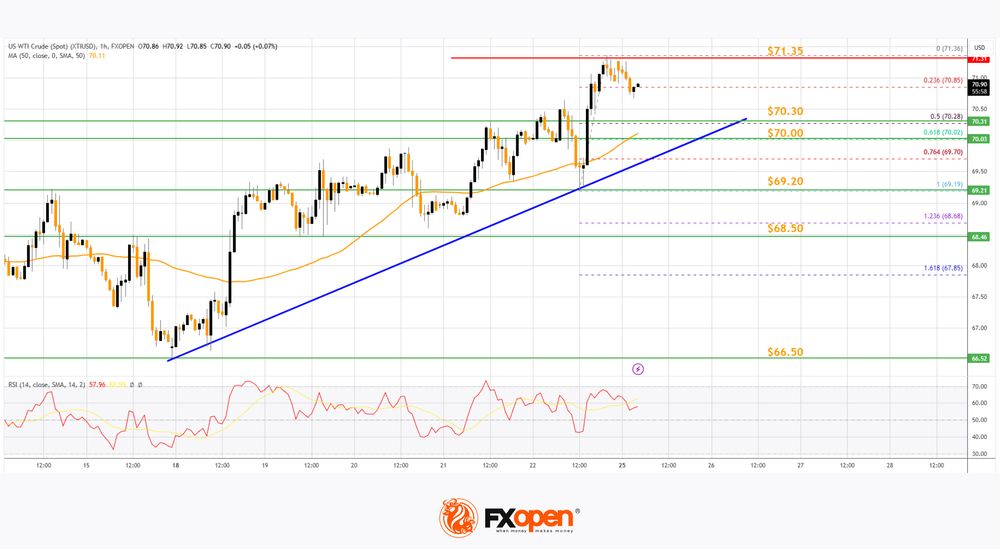
The RSI is still above the 50 level and there is a key bullish trend line forming with support at $70.30. Immediate support on the downside is near the trend line zone.
The next major support on the WTI crude oil chart is near the $70.00 zone or the 61.8% Fib retracement level of the upward move from the $69.19 swing low to the $71.36 high, below which the price could test the $69.20 zone.
If there is a downside break, the price might decline toward $68.50. Any more losses may perhaps open the doors for a move toward the $66.50 support zone.
If the price climbs higher again, it could face resistance near $71.35. The next major resistance is near the $72.20 level. Any more gains might send the price toward the $74.50 level.
Start trading commodity CFDs with tight spreads. Open your trading account now or learn more about trading commodity CFDs with FXOpen.
This article represents the opinion of the Companies operating under the FXOpen brand only. It is not to be construed as an offer, solicitation, or recommendation with respect to products and services provided by the Companies operating under the FXOpen brand, nor is it to be considered financial advice.
Markets Draw Some Comfort from Bessent Being Trump’s Treasury Secretary
Markets
The PMI’s on Friday again highlighted the divergence in growth and confidence between the US and EMU. The glimmers of hope some optimists saw in the October EMU PMI reading where brutally rejected by the November update. The composite PMI tumbled back in contraction territory (48.1 from 50.0). Even more worrisome, services which until now still provided some counterweight against an ailing manufacturing sector, this time also dropped below the 50-boom-or-bust level (49.2 from 51.6). Germany and in particular France, were the main reason of the decline, but growth in the rest of the EMU is slowing as well. At the same time, rising wage costs caused input and output prices rising again, indicating Europa is heading for a stagflationary environment. The contrast with the US could hardly be bigger. The US composite PMI rose more than expected to an healthy 55.3 from 54.1, with survives taking the lead (57.0). In manufacturing, a mild contraction continues (48.8). Even more striking, in this context, the pace of US output price inflation slowed to the slowest since May 2000. In a sharp bull steepening move, German yields tumbled between 11.7 bps (2-y) and 4.4 bps (30-y). Markets now again see a 50-50% chance between a 25 bps and 50 bps ECB rate cut at the December 12 meeting. The reaction of US interest rate markets to the US PMI’s was much more modest. The US 2-y yield added 2.4 bps. The 30-y declined 1.4 bps. With markets discounting only 60% of a 25 bps Fed cut at the December Fed meeting and less than 75bps additional easing toward the end of next year, investors apparently don’t feel the need to a more hawkish positioning yet. The combination of lower EMU yields and a solid US eco performance supported equities on both sides of the Atlantic (Dow +0.97%; Eurostoxx 50 +0.70%). EUR/USD briefly spiked below the 1.035 mark immediately after the EMU data, but closed the day at 1.042. Sterling showed a similar intraday pattern, but EUR/GBP soon returned north of 0.83, as the US PMI (composite 49.9) also missed expectations by a big margin.
This morning, sentiment on Asian markets (ex China) is constructive. Markets apparently draw some comfort from Scott Bessent being Donald Trump’s candidate to become Treasury Secretary. Markets hope he will hold a market-friendly but also a measured policy, supporting financial and macro-economic stability. US Treasuries are rebounding, with yields declining between 4.5 (2-y) and 7 bps (10-30-y). The correction (in US yields) and a constructive risk sentiment also triggers some profit taking on recent USD rally. DXY drops below the 107 barrier (compared to a test of 108 on Friday). EUR/USD also tries to fight back (1.048). Especially, for EUR/USD, we don’t anticipate a genuine turnaround, but some consolidation might be on the cards. The eco calendar contains the IFO business confidence. We also keep a close eye at ECB comments after last Friday’s PMI’s. Later this week EMU CPI data (Thursday, Friday) are important to further shape expectations on the pace of ECB easing in December.
News & Views
Nationalist candidate Calin Georgescu unexpectedly won the first round of Romanian presidential elections, securing around 22% of the vote. He’s slightly ahead of Prime Minister Ciolacu who gained around 20%. Both men advance to a run-off vote on December 8. This set-up still favors Ciolacu for the ceremonial win, although the president is commander-in-chief of the military and the country’s representative at NATO and EU Summits. Georgescu has questioned military support for Ukraine, called for an end to the war, cast doubt on the benefit of Romania’s NATO-membership and labeled Russian president Putin one of the world’s few true leaders. The outcome of the presidential ballot makes way for possible surprises at general elections (December 1) triggered by a collapse of the coalition government (Social Democrats of PM Ciolacu and Liberal Party) after three years in charge.
People close to the Italian government indicated that this year’s budget deficit could be 3.9% or 4% of GDP instead of the 3.8% target. The debt ratio might be up to two percentage points above the 134.8% tabled in September. The key concern is the 1% growth forecast Rome uses is significantly above the 0.7%-0.8% taking into account by the Bank of Italy, the IMF or the EC. That’s also why the impact on debt ratio is larger than on the deficit. Italian officials estimate that every tenth of a percentage point deviation in growth equates to around €2bn in additional issuance.