Sample Category Title
USD/JPY Daily Outlook
Daily Pivots: (S1) 153.58; (P) 154.15; (R1) 154.75; More...
Intraday bias in USD/JPY remains neutral as consolidation from 156.74 is still extending. On the downside, break of 153.27 will bring deeper correction to 38.2% retracement of 139.57 to 156.74 at 150.18. Meanwhile, on the upside, firm break of 156.74 will resume the rally from 139.57 towards 161.95 high.

In the bigger picture, price actions from 161.94 are seen as a corrective pattern to rise from 102.58 (2021 low). The range of medium term consolidation should be set between 38.2% retracement of 102.58 to 161.94 at 139.26 and 161.94. Nevertheless, sustained break of 139.26 would open up deeper medium term decline to 61.8% retracement at 125.25.

Trump’s Tariff Threats Weigh on CAD and AUD; Dollar and Yen Gain Ground
Dollar strengthened broadly in Asian session, especially against commodity currencies, following a bold announcement from President-elect Donald Trump. Trump pledged to impose steep tariffs on Canada, Mexico, and China to pressure them into halting fentanyl trafficking to the US.
The announcement came as markets were digesting the positive sentiment surrounding Trump’s Treasury Secretary pick, hedge fund magnate Scott Bessent, whose appointment had propelled DOW to record highs overnight. Analysts viewed Bessent as a stabilizing presence, with some seeing him as someone who could keep Trump “on a tight leash.” However, Trump’s remarks reinforced his intent to lead decisively on trade policies.
In the currency markets, Japanese Yen emerged is currently the strongest performer for the day so far, bolstered by the sharp decline in US Treasury yields. Additionally, October’s corporate services inflation in Japan rose to 2.9%, which keeps a December BoJ rate hike alive. Dollar followed as the second strongest currency, with New Zealand Dollar ranking third.
Conversely, Canadian Dollar plummeted on Trump’s tariff threats, making it the session’s weakest currency, followed by Australian Dollar and Euro. British Pound and Swiss Franc held steady in middle positions.
Technically, US 10-year yield is now pressing 4.264 support after yesterday's gap down and extended decline. Firm break there will confirm short term topping at 4.505, after rejection by both medium term falling trend line and 61.8% retracement of 4.997 to 3.603 at 4.464. Deeper fall should then be seen through 55 D EMA (now at 4.185) and drag USD/JPY back towards 150 mark.
In Asia, at the time of writing, Nikkei is down -1.42%. Hong Kong HSI is up 0.19%. China Shanghai SSE is up 0.07%. Singapore Strait Times is down -0.17%. Japan 10-year JGB yield is down -0.0096 at 1.065. Overnight, DOW rose 0.99%. S&P 500 rose 0.30%. NASDAQ rose 0.27%. 10-year yield fell -0.145 to 4.265.
CAD falls sharply as Trump pledges 25% tariffs to combat fentanyl trafficking
Canadian Dollar and Mexican Peso faced sharp declines after US President-elect Donald Trump announced plans for aggressive trade measures targeting Canada, Mexico, and China.
Trump stated that on January 20, as one of his first Executive Orders, he will authorize a 25% tariff on “all products” imported from Canada and Mexico. The tariffs will remain in place “until such time as drugs, in particular Fentanyl, and all illegal aliens stop this invasion of our country” through what he termed “ridiculous open borders.”
China is also in Trump’s crosshairs, with plans for an additional 10% tariff on top of existing levies, aimed at combating the “massive amounts of drugs” flowing into the US from the region.
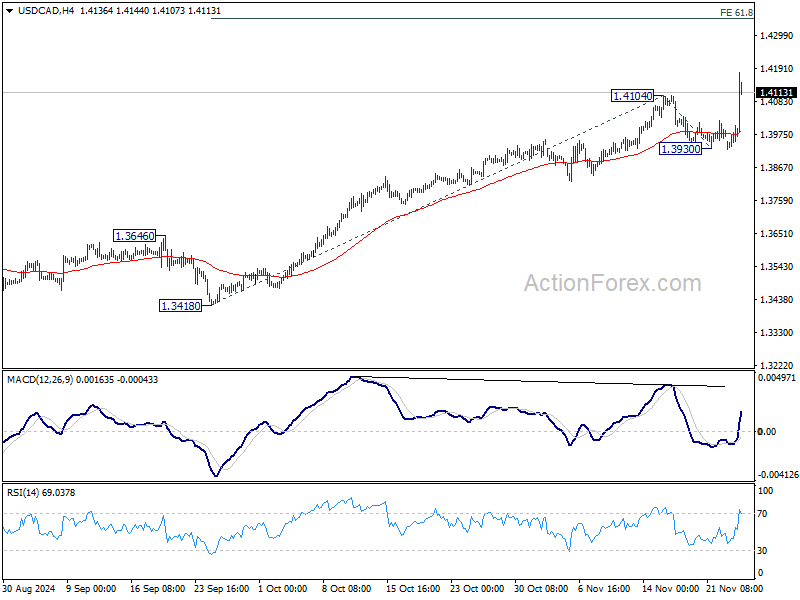
Technically, USD/CAD's up trend resumed by breaking through 1.4104 resistance. Further rise is now expected as long as 1.3930 support holds even in case of retreat. Next target is 61.8% projection of 1.3418 to 1.4104 from 1.3930 at 1.4354.
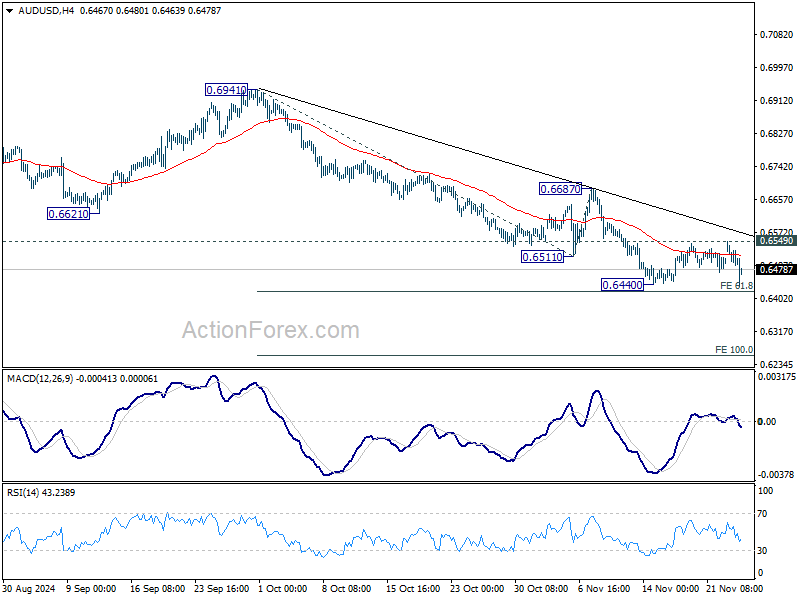
AUD/USD also dipped notably but stays above 0.6440 support so far. Further decline is expected as long as 0.6549 resistance holds. Decisive break of 61.8% projection of 0.6941 to 0.6511 from 0.6687 at 0.6421 will resume the fall from 0.6941 to 100% projection at 0.6257 next.
Fed’s Goolsbee sees clear path towards neutral rates
Chicago Fed President Austan Goolsbee has reiterated his support for gradual reduction in the fed funds rate, provided there is no “convincing evidence of overheating” in the economy. He noted that the pace of rate adjustments would depend on evolving economic conditions and the broader outlook.
“The through line to me is pretty clear that we’re on a path, and that path is going to lead to lower rates, closer to what you might call neutral,” Goolsbee emphasized overnight.
Policymakers will assess several key data points ahead of the December meeting. Goolsbee cautioned against drawing firm conclusions from one month’s data. He remarked that inflation is now “not that far above the 2% target”.
Fed’s Kashkari: December rate cut still a reasonable debate
Minneapolis Fed President Neel Kashkari signaled that a rate cut at the December meeting remains a "reasonable consideration," reflecting ongoing debates within the central bank. Speaking to Bloomberg TV, Kashkari stated, "Right now, knowing what I know today, still considering a 25-basis-point cut in December—it's a reasonable debate for us to have."
Kashkari highlighted that the economy's resilience in the face of higher interest rates suggests the neutral rate may be higher than previously estimated. This observation raises questions about the effectiveness of current monetary policy in cooling economic demand. He noted that if this resilience persists, it might indicate a structural shift rather than a temporary one.
"This is what I'm trying to understand right now," Kashkari said, emphasizing the need to assess "how much downward pressure we are putting on the economy, and what is the path for inflation."
Looking ahead
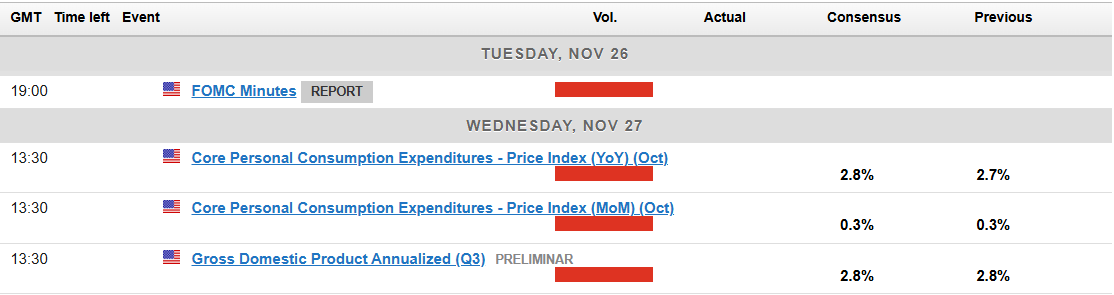
US house price index, new home sales, and consumer confidence will be released today. But more focus will be on FOMC minutes, which is released a day earlier than usual due to thanksgiving shortened week in the US.
USD/JPY Daily Outlook
Daily Pivots: (S1) 153.58; (P) 154.15; (R1) 154.75; More...
Intraday bias in USD/JPY remains neutral as consolidation from 156.74 is still extending. On the downside, break of 153.27 will bring deeper correction to 38.2% retracement of 139.57 to 156.74 at 150.18. Meanwhile, on the upside, firm break of 156.74 will resume the rally from 139.57 towards 161.95 high.
In the bigger picture, price actions from 161.94 are seen as a corrective pattern to rise from 102.58 (2021 low). The range of medium term consolidation should be set between 38.2% retracement of 102.58 to 161.94 at 139.26 and 161.94. Nevertheless, sustained break of 139.26 would open up deeper medium term decline to 61.8% retracement at 125.25.
Elliott Wave View: Oil (CL) Short Term May See More Downside
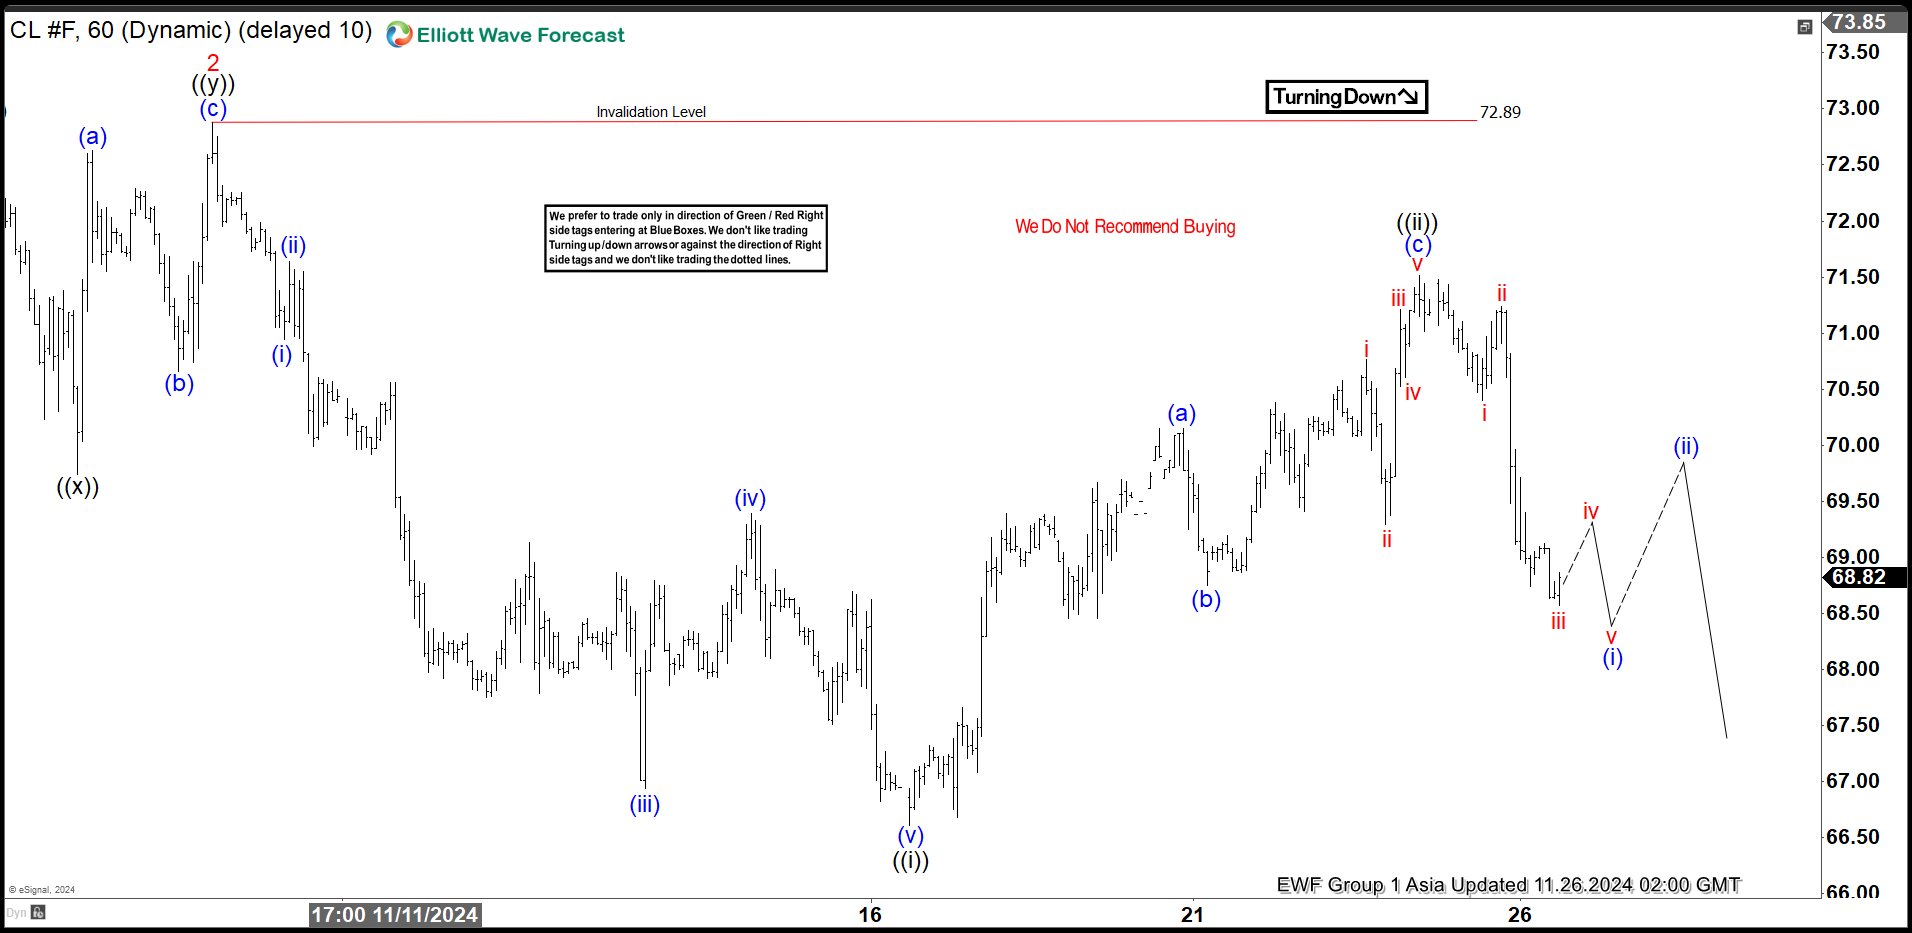
Short Term Elliott Wave View in Oil (CL) suggests that cycle from 10.8.2024 high is in progress as a 5 waves impulse. Down from 10.8.2024 high, wave 1 ended at 66.72. Wave 2 rally ended at 72.89 as the 1 hour chart below shows. It has then turned lower again in wave 3. Down from wave 2, wave (i) ended at 70.94 and wave (ii) bounce ended at 71.64. Wave (iii) lower ended at 66.94 and wave (iv) rally ended at 69.39. Final wave (v) lower ended at 66.61 which completed wave ((i)). Oil then rallied in wave ((ii)) with internal subdivision of a zigzag.
Up from wave ((i)), wave (a) ended at 70.15 and wave (b) ended at 68.75. Wave (c) higher ended at 71.51 which completed wave ((ii)). Oil has turned lower and structure of the decline looks impulsive. Down from wave ((ii)), wave i ended at 70.4 and wave ii ended at 71.24. Wave iii lower ended at 68.57. Expect wave iv to end soon and then it should turn lower in wave v to complete wave (i). Afterwards, expect oil to rally in wave (ii) in 3, 7, or 11 swing before the decline resumes. Near term, as far as pivot at 72.89 high stays intact, expect rally to fail in 3, 7, 11 swing for more downside.
Oil (CL) 60 Minutes Elliott Wave Chart
CL Elliott Wave Video
https://www.youtube.com/watch?v=tn3jUEPt-XQ
Gold Stays Resilient: Can The Upswing Continue?
Key Highlights
- Gold started a fresh increase from the $2,535 support.
- It broke a major bearish trend line with resistance at $2,630 on the 4-hour chart.
- Oil prices are recovering and might rise toward the $72.50 resistance.
- EUR/USD is consolidating losses near the 1.0520 level.
Gold Price Technical Analysis
Gold prices remained well-bid near the $2,535 zone against the US Dollar. The price formed a base and started a fresh increase above $2,600 and $2,620.
The 4-hour chart of XAU/USD indicates that the price surpassed the 50% Fib retracement level of the downward move from the $2,790 swing high to the $2,536 low. It broke a major bearish trend line with resistance at $2,630.
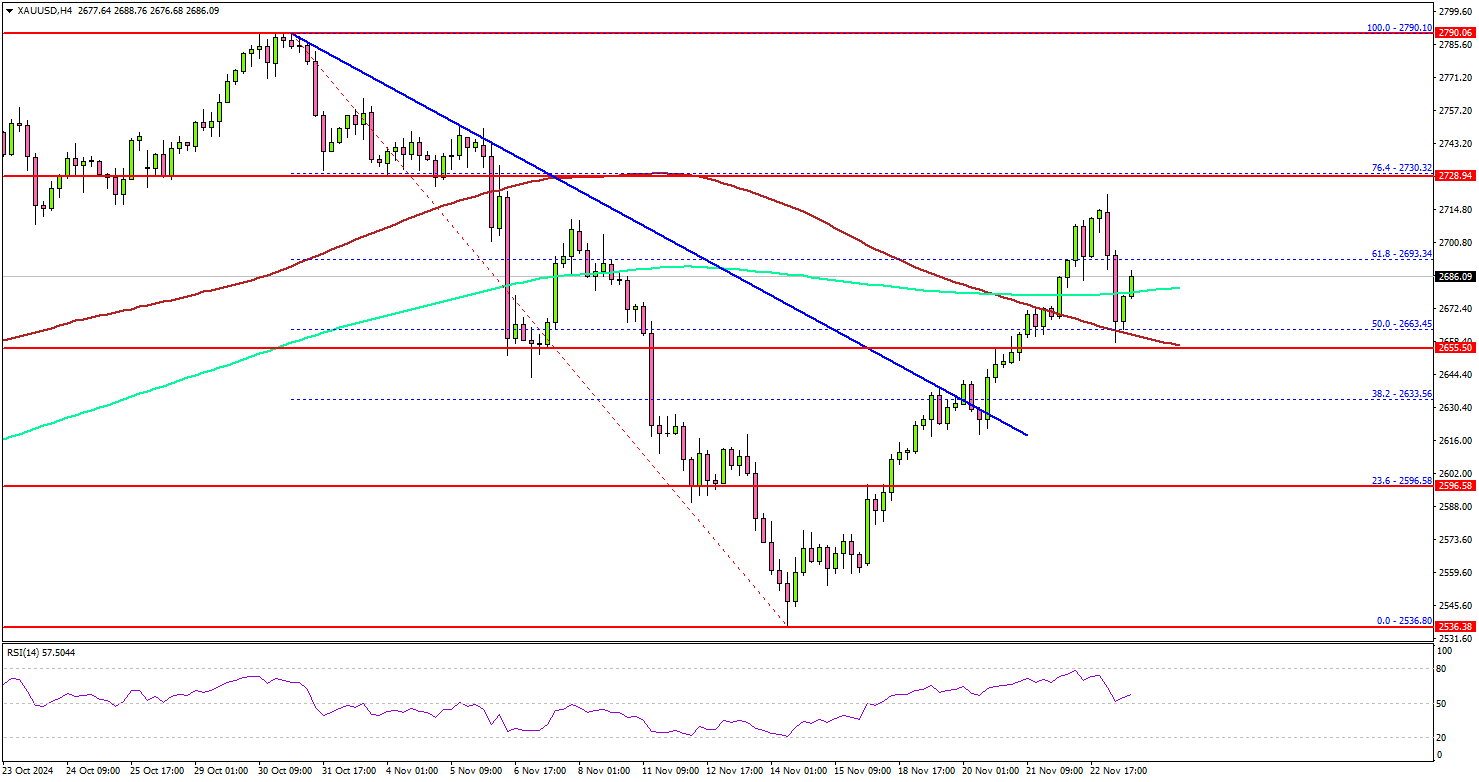
The price climbed above the 100 Simple Moving Average (red, 4 hours) and the 200 Simple Moving Average (green, 4 hours). However, the bears are active near the $2,715 level.
The first major resistance sits near the $2,730 level. It is near the 76.4% Fib retracement level of the downward move from the $2,790 swing high to the $2,536 low. A clear move above the $2,730 resistance could open the doors for more upsides.
The next major resistance could be $2,750, above which the price could rally toward the $2,780 level. On the downside, initial support is near the $2,660. The first major support is near the $2,620 level.
The main support is now $2,600. A downside break below the $2,600 support might call for more downsides. The next major support is near the $2,535 level.
Looking at EUR/USD, the pair started a short-term recovery wave above the 1.0450 level but upsides might be limited above 1.0550.
Economic Releases to Watch Today
- US New Home Sales for Oct 2024 (MoM) – Forecast -1.1% versus +4.1% previous.
CAD falls sharply as Trump pledges 25% tariffs to combat fentanyl trafficking
Canadian Dollar and Mexican Peso faced sharp declines after US President-elect Donald Trump announced plans for aggressive trade measures targeting Canada, Mexico, and China.
Trump stated that on January 20, as one of his first Executive Orders, he will authorize a 25% tariff on “all products” imported from Canada and Mexico. The tariffs will remain in place “until such time as drugs, in particular Fentanyl, and all illegal aliens stop this invasion of our country” through what he termed “ridiculous open borders.”
China is also in Trump’s crosshairs, with plans for an additional 10% tariff on top of existing levies, aimed at combating the “massive amounts of drugs” flowing into the US from the region.
Technically, USD/CAD's up trend resumed by breaking through 1.4104 resistance. Further rise is now expected as long as 1.3930 support holds even in case of retreat. Next target is 61.8% projection of 1.3418 to 1.4104 from 1.3930 at 1.4354.
AUD/USD also dipped notably but stays above 0.6440 support so far. Further decline is expected as long as 0.6549 resistance holds. Decisive break of 61.8% projection of 0.6941 to 0.6511 from 0.6687 at 0.6421 will resume the fall from 0.6941 to 100% projection at 0.6257 next.
Fed’s Kashkari: December rate cut still a reasonable debate
Minneapolis Fed President Neel Kashkari signaled that a rate cut at the December meeting remains a "reasonable consideration," reflecting ongoing debates within the central bank. Speaking to Bloomberg TV, Kashkari stated, "Right now, knowing what I know today, still considering a 25-basis-point cut in December—it's a reasonable debate for us to have."
Kashkari highlighted that the economy's resilience in the face of higher interest rates suggests the neutral rate may be higher than previously estimated. This observation raises questions about the effectiveness of current monetary policy in cooling economic demand. He noted that if this resilience persists, it might indicate a structural shift rather than a temporary one.
"This is what I'm trying to understand right now," Kashkari said, emphasizing the need to assess "how much downward pressure we are putting on the economy, and what is the path for inflation."
Fed’s Goolsbee sees clear path towards neutral rates
Chicago Fed President Austan Goolsbee has reiterated his support for gradual reduction in the fed funds rate, provided there is no “convincing evidence of overheating” in the economy. He noted that the pace of rate adjustments would depend on evolving economic conditions and the broader outlook.
“The through line to me is pretty clear that we’re on a path, and that path is going to lead to lower rates, closer to what you might call neutral,” Goolsbee emphasized overnight.
Policymakers will assess several key data points ahead of the December meeting. Goolsbee cautioned against drawing firm conclusions from one month’s data. He remarked that inflation is now “not that far above the 2% target”.
Gold’s (XAU/USD) Sharp Drop: Ceasefire Optimism and Bessent’s Impact on Markets
- Gold prices experience significant drop due to hopes of a Lebanon-Israel ceasefire and the announcement of Scott Bessent as US Treasury Secretary.
- US Treasury yields fall and the dollar weakens in response to Bessent’s expected policies.
- Technical analysis indicates a bearish trend for gold in the short term, with potential support and resistance levels identified.
Gold prices have fallen around $100 today as risk on sentiment returned. Geopolitics has taken center stage at the start of the week as rumors began doing the rounds that an Israel-Lebanon deal will be announced in 36 hours.
US Treasury Pick Confirmed
The return of risk on sentiment is also partly down to the announcement by US President Elect Donald Trump of Scott Bessent as US Treasury Secretary.
Market participants see the appointment of Bessent as a steadying influence in Trump’s administration. There seems to be a sigh of relief that Trump didn’t make another risky choice for the Cabinet. Bessent’s Wall Street experience reassures them, as they believe he’ll support balanced policies and help tone down some of Trump’s more extreme ideas.
Scott Bessent has talked about using trade levies in a way that’s less likely to upset markets or cause inflation compared to Trump’s previous plans. He has also shared ideas on reducing the budget deficit to 3% by focusing on deregulation, boosting energy production, and shifting parts of the economy back to private control all aimed at driving economic growth.
These views influenced markets on Monday, with 10-year Treasury yields dropping to 4.3%, as investors felt reassured. At the same time, the dollar lost some strength against other currencies because people believe Bessent will take a softer stance on tariffs than Trump.

Source: Bloomberg
Israel-Lebanon Ceasefire Deal Nears, Russia-Ukraine Rumbles on
Rumors began circulating in the European session that a ceasefire deal between Lebanon and Israel is drawing closer. This added to the precious metals woes setting it on course for its worst day since June 7.
According to officials, the Israeli security cabinet may vote on a Lebanon deal tomorrow. Such a move could lead to continued selling pressure on the precious metal.
What is interesting though is that rumors around Russia and Ukraine have actually intensified over the past 24 hours. Rumors have swirled that the UK and France are leading discussions to allow military personnel on the ground in Ukraine. This would be seen as a major escalation, hence my surprise at the drop in Gold prices. In theory, one would think that such rumors may at least keep Gold prices slightly supported moving forward.
This will definitely be a point of interest moving forward and could be the saving grace that Gold may need following the sharp selloff and drop in US Treasury Yields.
Economic Data Ahead
Looking at the data front this week, and tomorrow we have the FOMC minutes which may provide some insight into what Fed members think of a Trump Presidency and its potential implications. Despite Chair Jerome Powell insisting politics will not dictate policy, this seems a bit tone deaf in all honesty.
It’s no secret how President Elect Trump feels about the Fed and Jerome Powell. Given Trump’s rhetoric in the election and his economic plans, the Fed will not be able to just ignore it and wait on the data. However, I could be getting ahead of myself and the Fed minutes may not reveal anything about a potential Trump Presidency.
Technical Analysis Gold (XAU/USD)
From a technical analysis standpoint, Gold is down around 3.21% at the time of writing. Last weeks selloff did find support at the 100-day MA before rallying to peak just above the $2700/oz mark.
Overall the trend on the daily is bearish from a price action point of view, with further downside a possibility. Gold has been largely driven by fundamental factors of late, which is not to say that the technicals have not given us any clues to the precious metals next move.
Looking at the selloff today and once could argue that the fibonacci retracement provided a hint that a selloff may materialize around the 2693 and 2735, which is the 61.8-78.6 fib retracement zone.
However, many may have been caught off guard given the bullish pressure we saw last week. I for one will have to admit i did not see such an aggressive selloff to start to the week, which begs the question… will the precious metal push lower or will the situation around Russia-Ukraine reignite safe haven demand?
immediate support rests at 2625 and 2600 which is just above the 23.6% retracement level which rests at 2596.
A recovery from the current price may face resistance around the 2639 handle before the 2650 and 2673 handle comes into focus.
GOLD (XAU/USD) Daily Chart, November 25, 2024

Source: TradingView (click to enlarge)
Support
- 2625
- 2600
- 2574
Resistance
- 2639
- 2650
- 2673
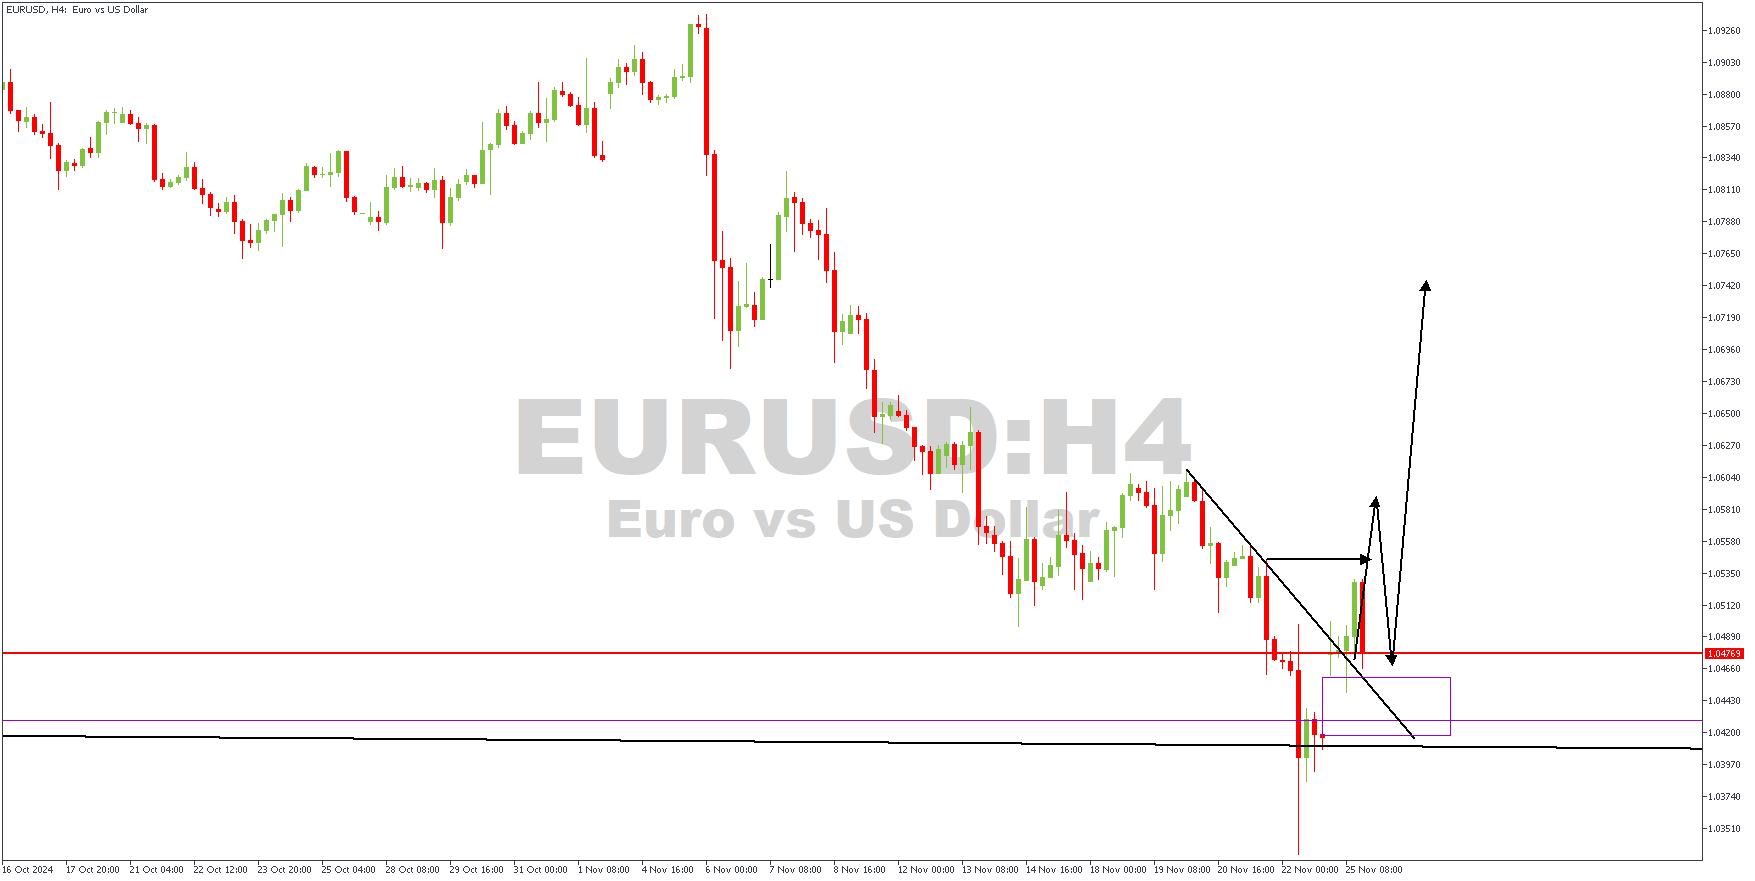
EURUSD: Weekly Market Review
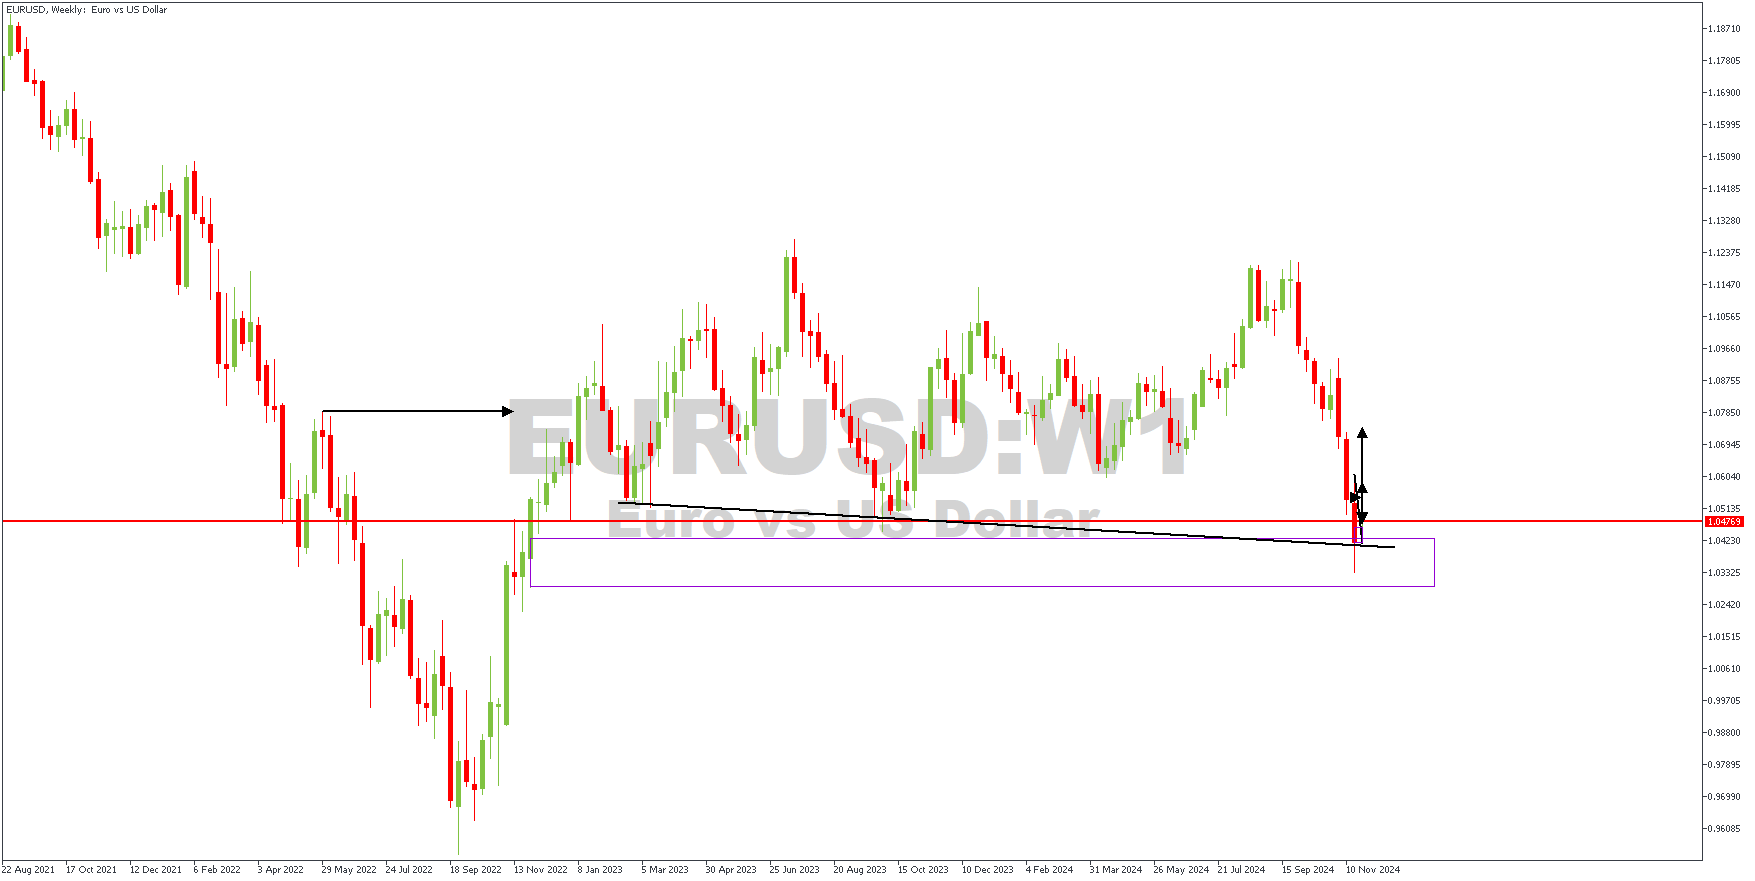
The EURUSD currency pair is starting the week trying to stabilize after dropping to 1.0332 last week, its lowest level in two years. The Euro has struggled, falling 4.21% this month and 5.54% since the start of 2024, as concerns about the Eurozone's slowing economy weigh on the currency. Business activity in the region unexpectedly shrank, raising fears about future growth and putting pressure on the European Central Bank (ECB) to cut interest rates more aggressively. Rising wages, political challenges in Germany and France, and potential tariffs from Donald Trump's presidency add to the Euro's troubles. ECB President Christine Lagarde has emphasized the need for Europe to deepen its capital markets and support innovation to counter these challenges. Let's look now at the current technical outlook from our weekly market review session.
EURUSD – W1 Timeframe
The weekly timeframe price action indicates that price has reached a critical level, and a reversal may follow. There is a weekly timeframe pivot (the horizontal red line) and a rally-base-rally demand zone serving as the visible confluence on the weekly timeframe. A closer look at the price action on the lower timeframe would give ample detail on the criteria for entry in the direction of the bullish sentiment.
H4 Timeframe
The 4-hour timeframe presents a classic break-and-retest pattern, where the point of interest is the demand zone at the base of the break of structure. In any case, the overall sentiment for EURUSD is bullish, albeit the point of entry may differ slightly.
Analyst's Expectations:
- Direction: Bullish
- Target:1.07089
- Invalidation: 1.03044
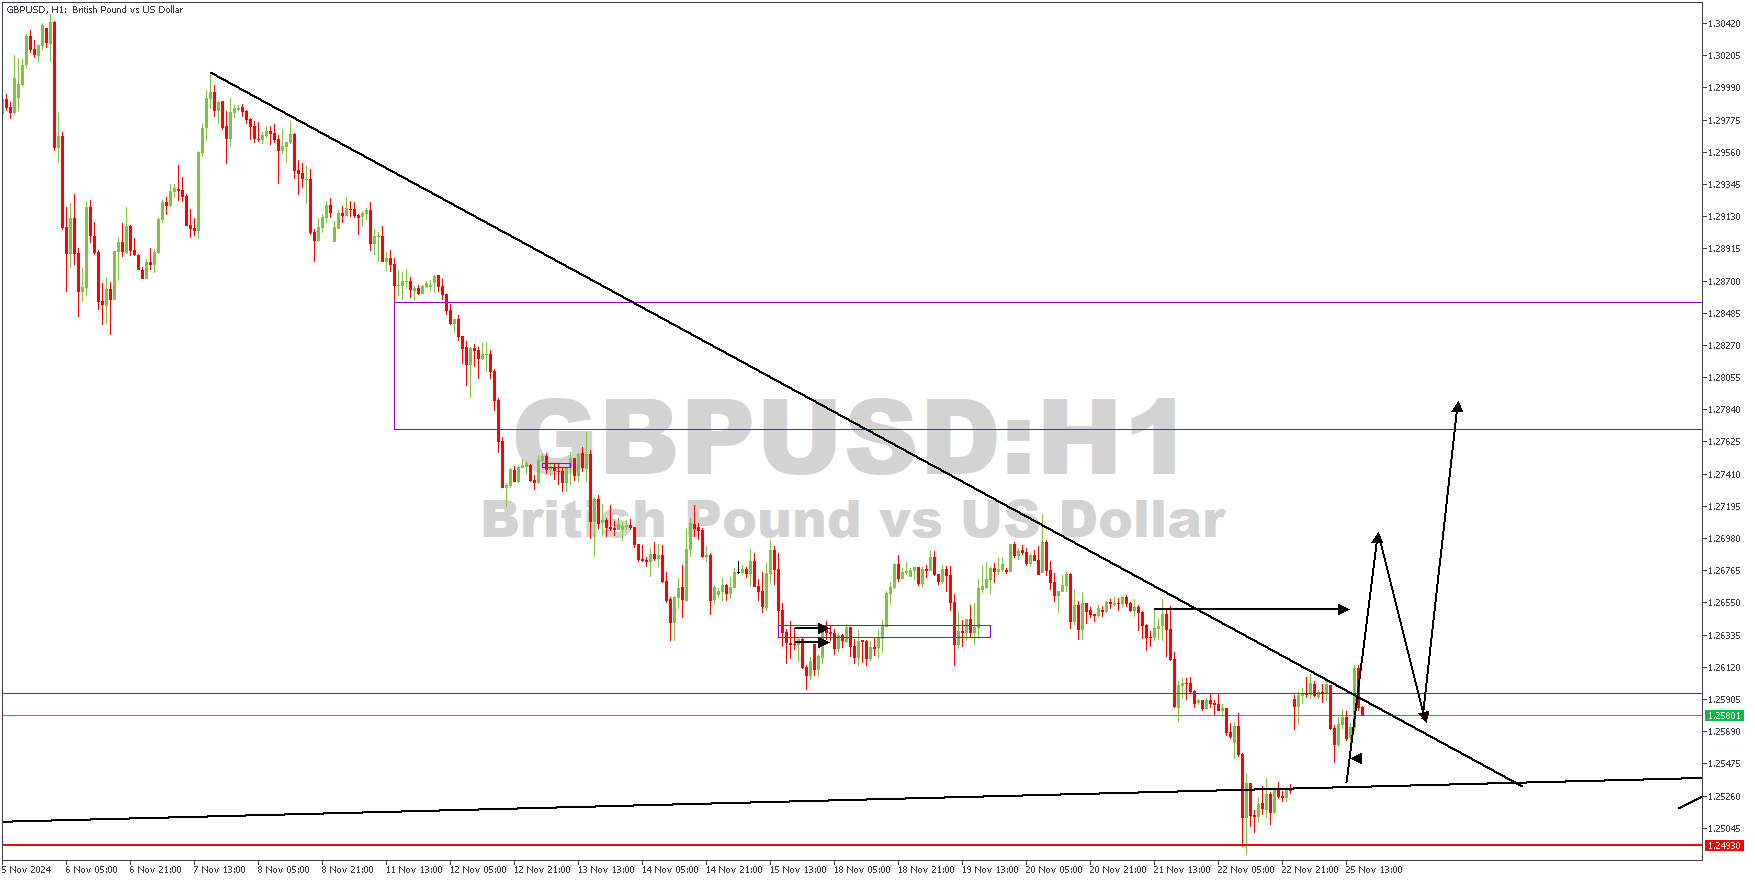
GBPUSD: Weekly Market Review
The US dollar strengthened following Trump's victory, pushing the GBPUSD currency pair down to 1.2487, its lowest level in six months, before closing at 1.2528. The pound has dropped 2.86% this month and 1.59% since the start of 2024, with its performance under pressure due to the more robust US economy. In contrast, the UK faces challenges like stagnant productivity, rising inflation (up 2.3% in October), and higher energy bills. Investors now expect the Bank of England to make three rate cuts in 2025, with a February cut fully priced. Until the UK economy improves, the pound's struggle against the dollar will likely continue. Here is a breakdown of the analysis performed on GBPUSD during our weekly market review session on the Telegram channel.
GBPUSD – D1 Timeframe
On the daily timeframe chart of GBPUSD, we see the price being rejected off the confluence region of the trendline support and the drop-base-rally demand zone. There is also a daily timeframe pivot zone on the scene, as highlighted by the two horizontal red lines. Let's dive into the 1-hour timeframe to recount the required entry confirmation.
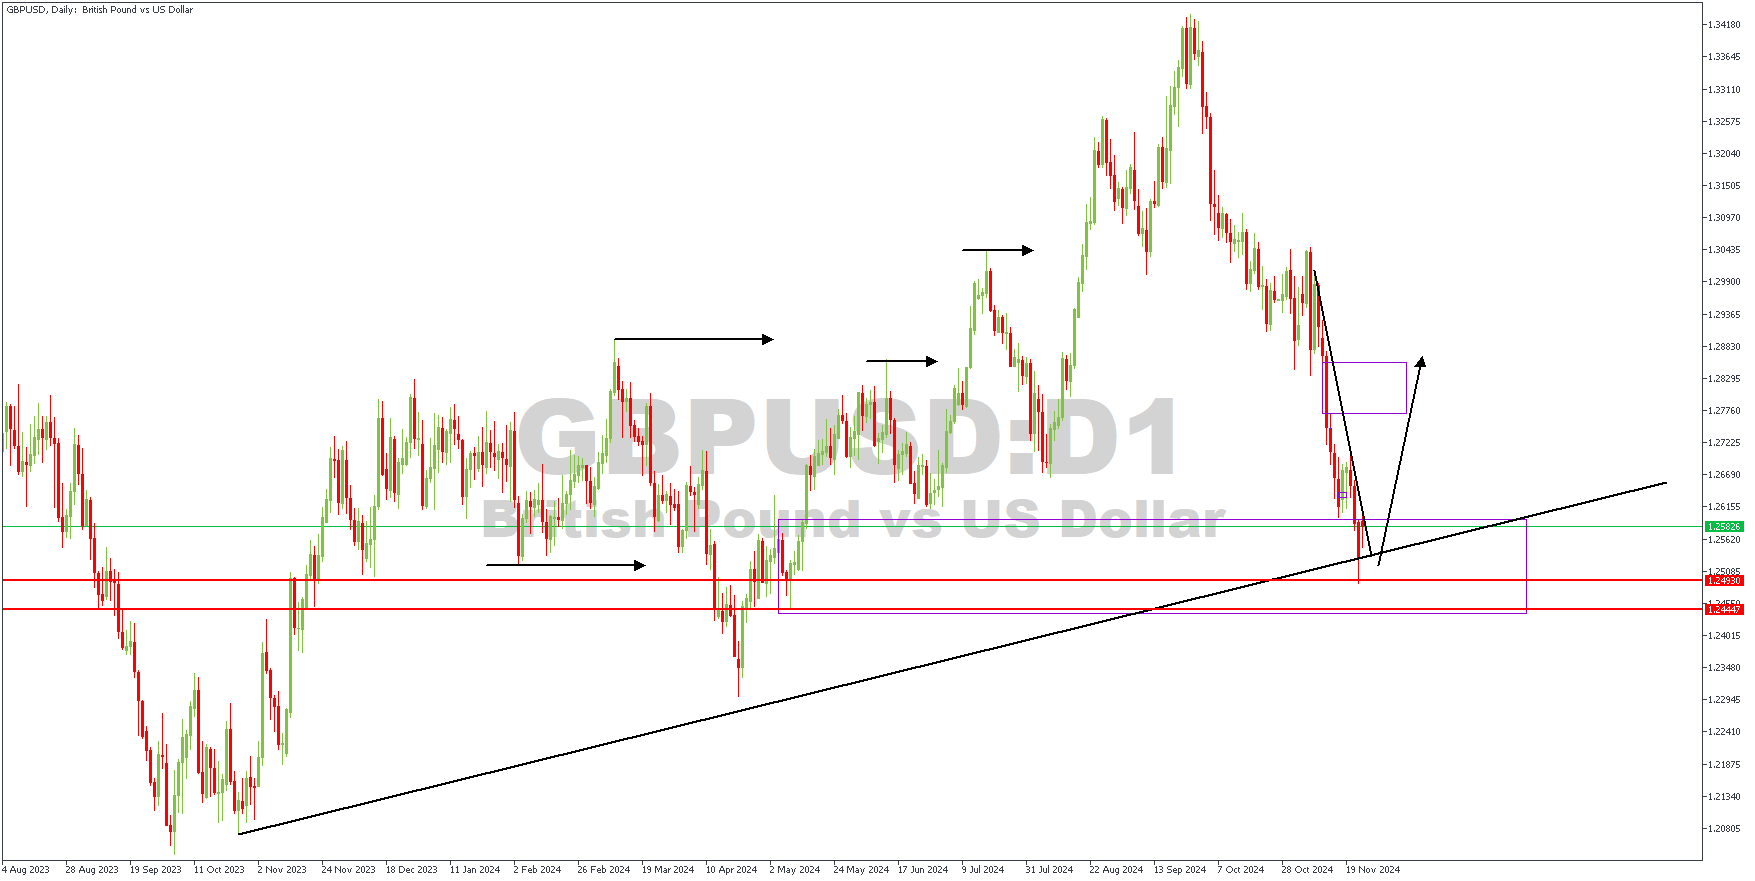
H1 Timeframe
The required trigger for the buy on the 1-hour chart of GBPUSD would be a break above the previous high and the trendline resistance. The arrowed lines indicate the path I expect the price to take to complete the required confirmation.
Analyst's Expectations:
- Direction: Bullish
- Target:1.27676
- Invalidation: 1.24381