Sample Category Title
Yen Edges Higher After Mixed Inflation Data
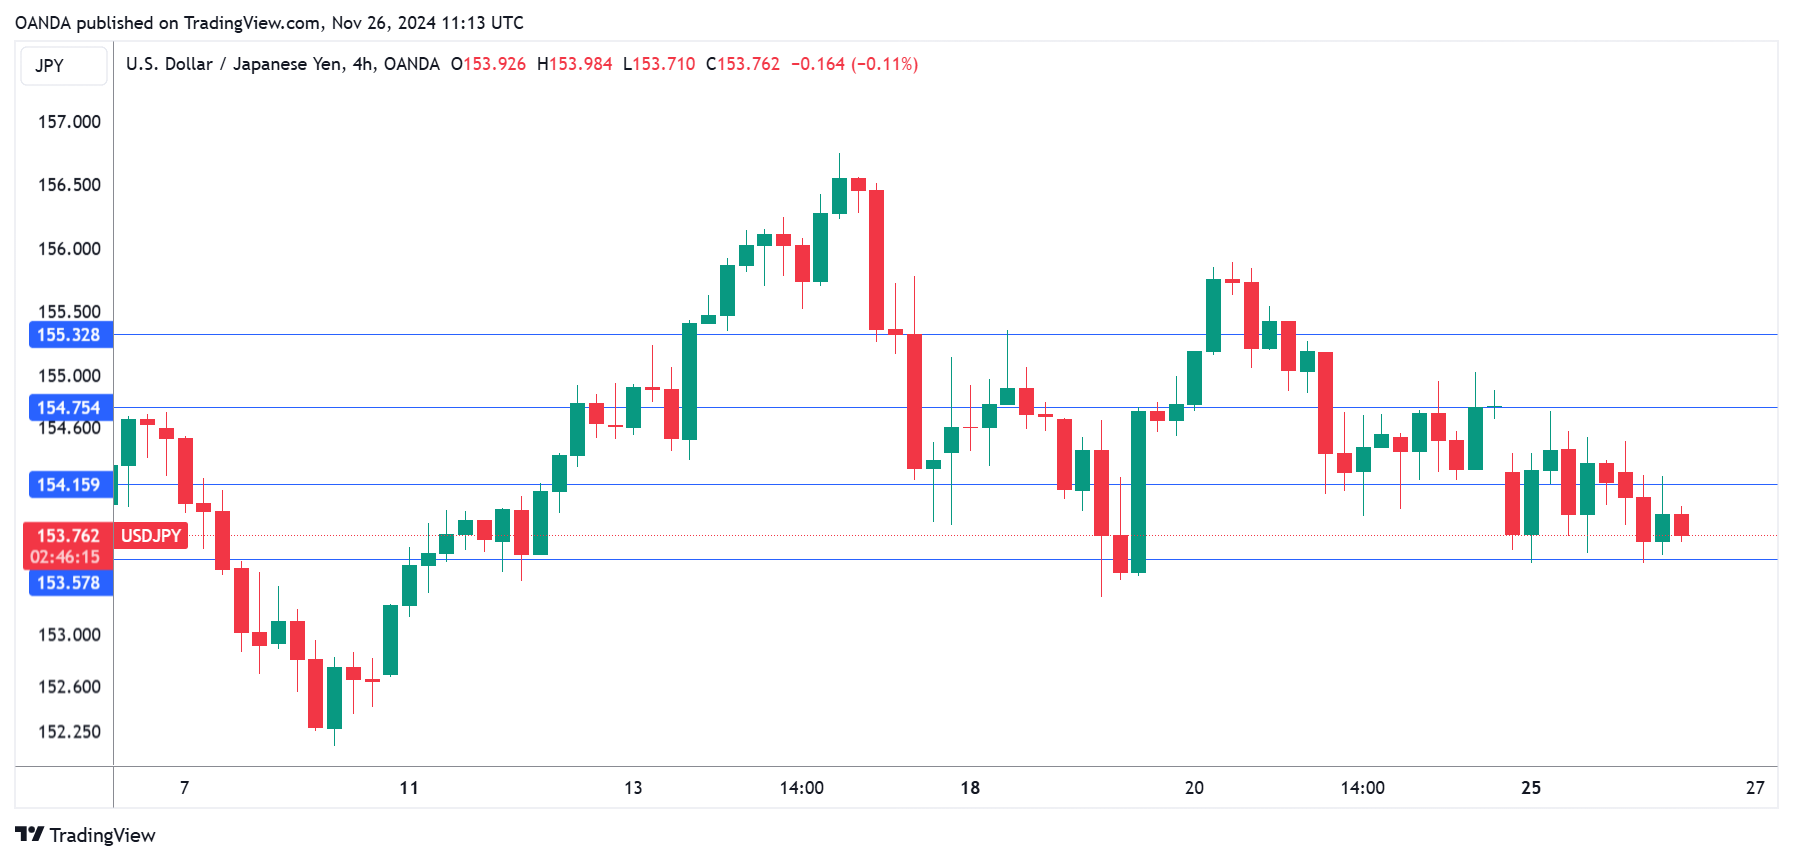
The Japanese yen has been relatively quiet for over a week and the trend has continued on Tuesday. In the European session, USD/JPY is trading at 153.79, down 0.25% on the day.
BoJ Core CPI dips, services inflation ticks higher
Japan release mixed inflation numbers on Tuesday. The Bank of Japan Core CPI, a preferred inflation indicator of the central bank, surprised on the downside with a 1.5% gain in October. This was lower than the 1.7% gain in September and shy of the market estimate of 1.8%. The services producer price index, however, inched upwards to 2.9% in October, up from 2.8% in September and above the market estimate of 2.5%.
The Bank of Japan is keeping a close eye on the rise in services inflation, as it supports the central bank’s view that stronger wage growth is leading to higher service inflation, which is key to keeping inflation sustainable. Will the rise in services inflation translate into an interest rate hike at the Dec. 19 meeting? The BoJ isn’t about to tip its hand, but if Friday’s Tokyo Core CPI release accelerates, as is expected, there would be further pressure on the BoJ to raise rates at the December meeting.
The BoJ is keeping an anxious eye on the US, with President-elect Trump taking over in January. Trump hasn’t wasted any time and posted a threat on Monday to slap tariffs on Mexico, China and Canada. Although Japan wasn’t included in the post, Trump has previously said that he would impose tariffs of 10% to 20% on all imported goods, which could badly hurt the Japanese auto industry.
USD/JPY Technical
- USD/JPY has pushed below support at 154.15 and tested support at 153.58 earlier.
- 154.75 and 155.32 are the next resistance lines
Crypto Market Deepens Correction
Market Picture
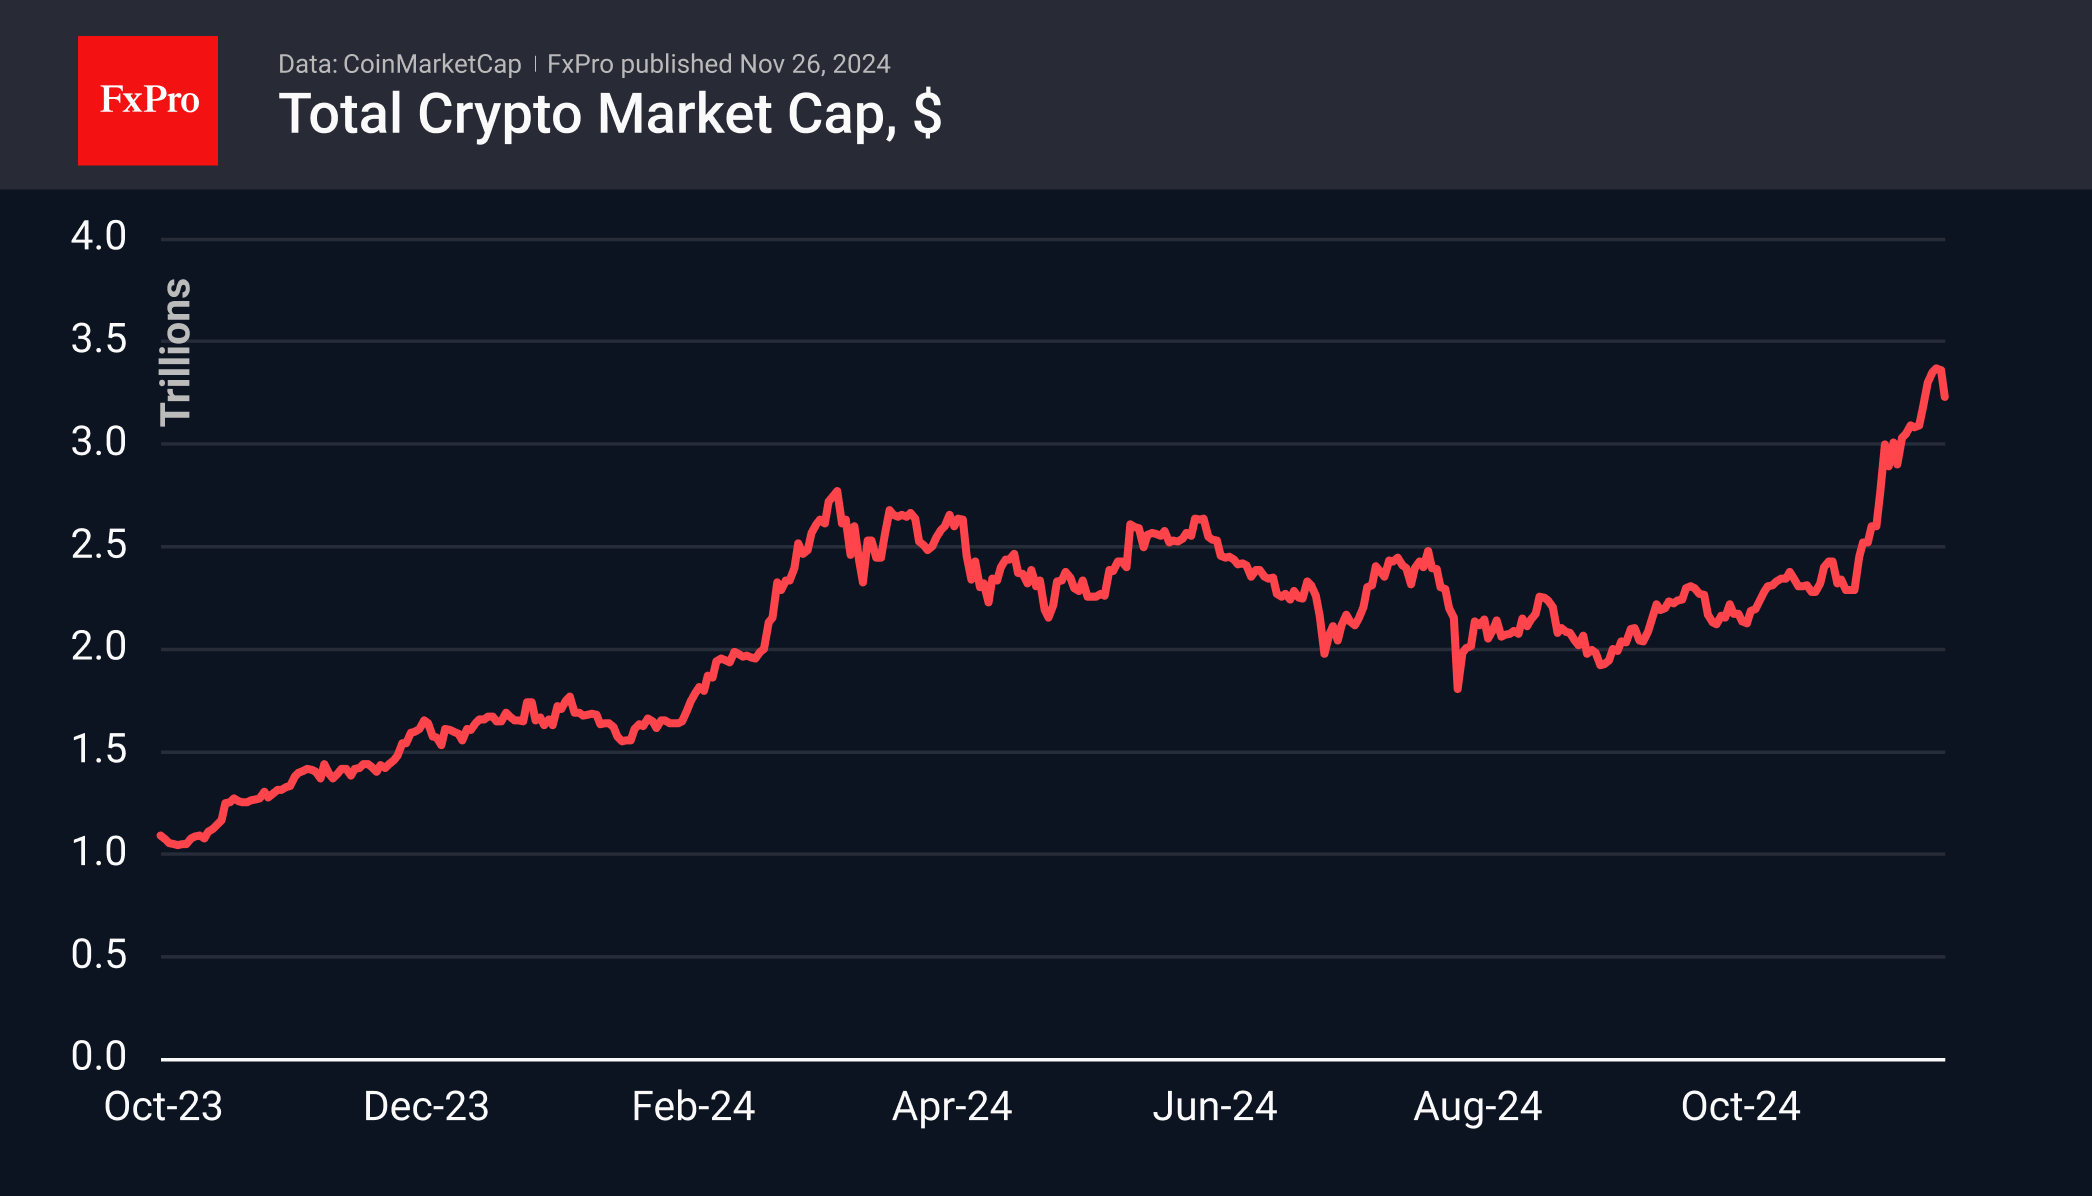
The cryptocurrency market is under pressure, losing about 4.6% in 24 hours to $3.2 trillion by the start of active trading in Europe. These are five-day lows, with the crypto market driven by a sell-off in safe havens such as Bitcoin and Gold in hopes of deescalating tensions between Lebanon and Israel. Separately, Trump’s tariff threats are playing against stock indices and weighing on equities.
The Cryptocurrency Fear and Greed Index fell to 79. That is still extreme greed, but the index’s lowest level in two weeks.
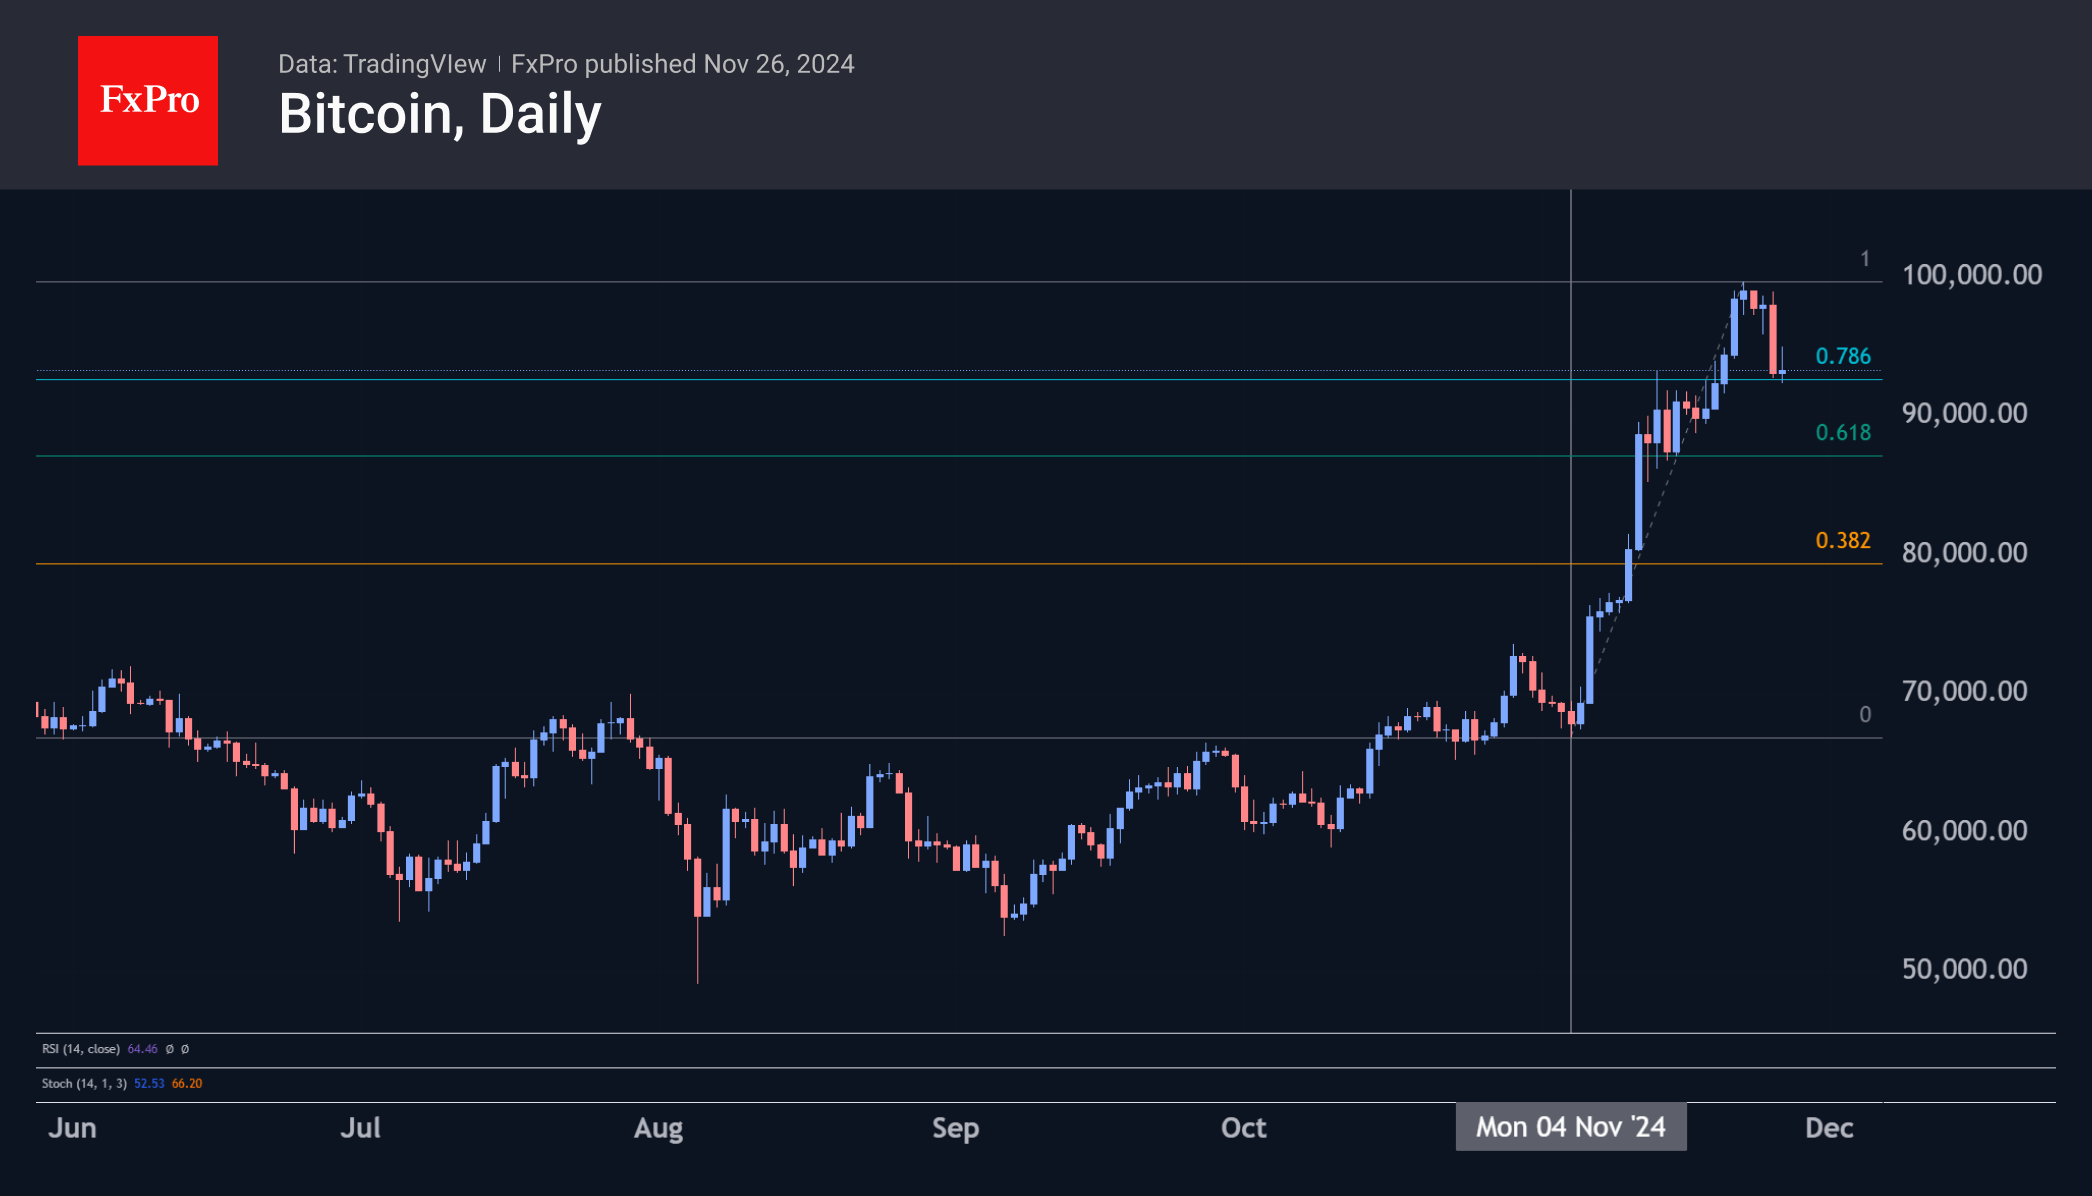
Bitcoin fell below $93K on Tuesday morning, deepening its corrective pullback and falling for the fourth consecutive day. On Monday, there was a renewed attempt to take the price above $99K, which turned into more selling. This is due to the geopolitical pullback, which has turned into a broader profit-taking scenario, looking at the entire rally since November 4th. This means that traders should pay more attention to BTC’s momentum around $91.8K (76.4% of the rally). Without proper support in this area, the bears’ next target could be the $87K area (61.8%).
News Background
According to CoinShares, global crypto fund investments rose to an all-time high of $3.124 billion last week, following inflows of $2.193 billion the week before. Investments in Bitcoin rose by $3.078 billion, Ethereum by $3 million, Solana by $16 million, and XRP by $15 million. Investments in funds that allow shorting bitcoin increased by $10 million.
FalconX noted that the relative dominance of bullish orders in the bitcoin market has weakened, and the growth momentum is not supported by new buying interest. It warned that minor negative news could lead to a noticeable correction in BTC.
According to CryptoQuant calculations, unrealised gains in Bitcoin have reached 57%, signalling an increased likelihood of a correction. This was preceded by a jump in daily realised gains to a record $443 million.
Despite bitcoin’s rapid rally, the likelihood of a flash crash in the cryptocurrency is higher than ever, according to Michael van de Poppe, founder of MN Trading. He noted classic signs of overheating in Crypto as the volume of margin positions and the overall volatility increased.
On November 25th, MicroStrategy founder Michael Saylor announced the purchase of an additional 55,500 BTCs at a price of ~$97,862. The company now controls 386,700 BTC at an average price of $56,761.
The SEC set a new financial record for fines on crypto companies last fiscal year (ended September 30th) with $8.2 billion, more than half of which ($4.47 billion) came from a settlement with Terraform Labs (TFL).
EUR/USD Outlook: Bullish Signal Developing on Daily Chart But Needs More Evidence for Confirmation
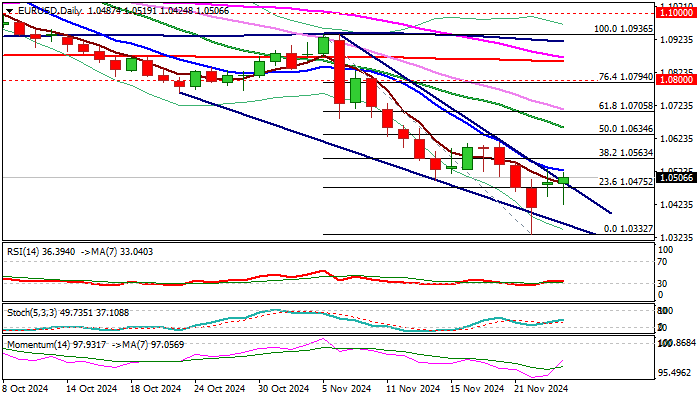
EUR/USD remains in a narrow-range sideways mode in early Tuesday’s trading, in extension of Monday’s action, shaped in Doji candle and signaling indecision
Initial positive signal is developing on daily chart following last Friday’s strong downside rejection which left a bear trap under 1.0405 Fibo support (50% retracement of 0.9535/1.1275 rally (Sep 2022/July 2023).
Also, fresh recovery probe above the upper borderline of falling wedge pattern, with firm break to boost the signal.
However, more work at the upside will be required to confirm signal (break through 1.0525/63 pivots – falling 10DMA / Fibo 38.2% of 1.0936/1.0327) and open way for stronger recovery.
Caution on still weak technical studies (14-d momentum is still deeply in the negative territory, although heading north and DMA’s in bearish setup) and predominantly euro-negative fundamentals, which may deflate recovery attempts.
Res: 1.0525; 1.0563; 1.0609; 1.0634.
Sup: 1.0475; 1.0424; 1.0705; 1.0332.
NZDUSD Falls to 1-Year Low Ahead of RBNZ
- NZDUSD hits fresh lows on US tariff threats
- Technical outlook remains gloomy
- RBNZ rate decision due on Wednesday at 01:00 GMT
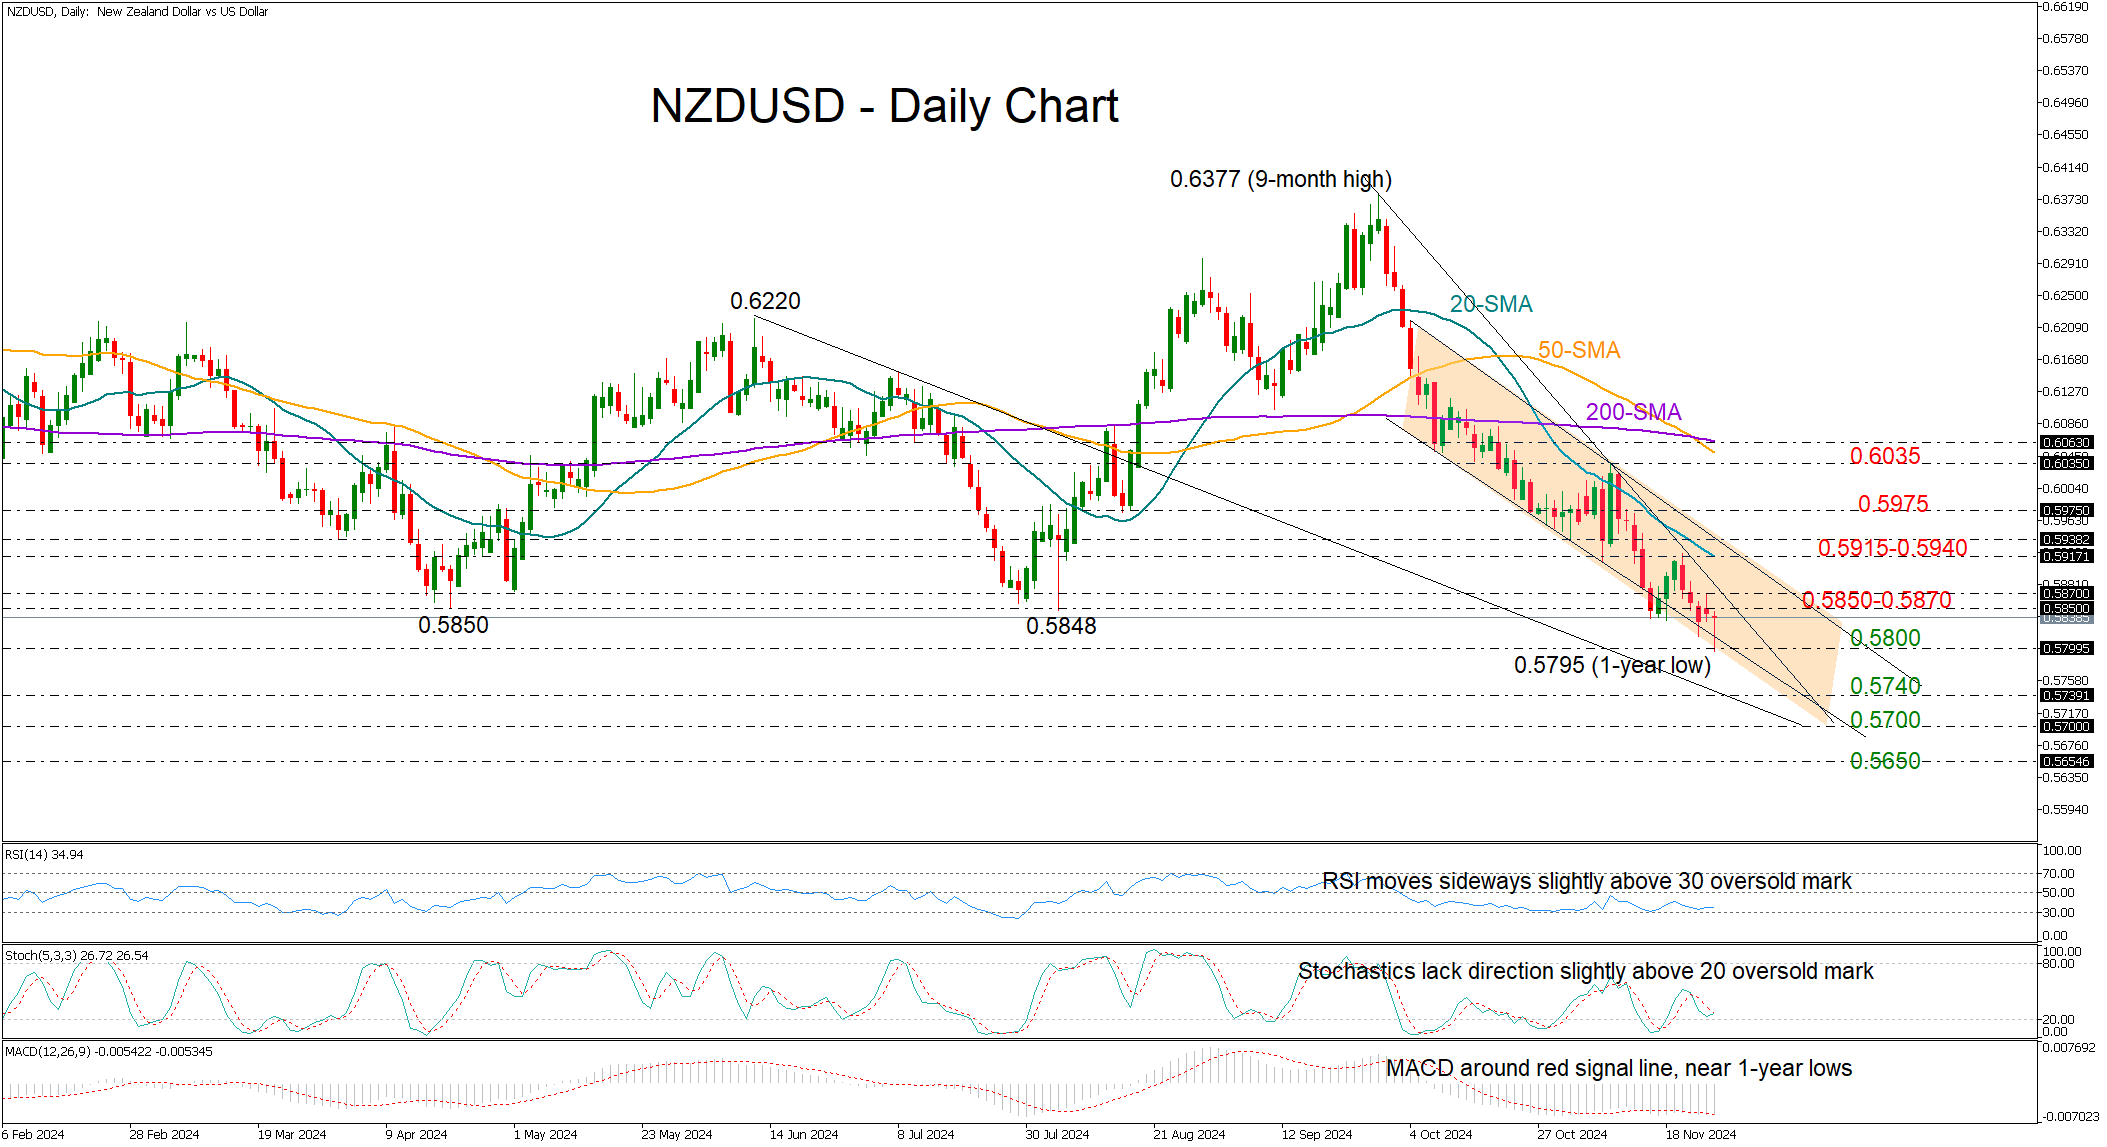
NZDUSD plunged to a one-year low of 0.5795 early on Tuesday following Trump's renewed tariff warnings against Canada, Mexico, and China, but it soon managed to recoup its losses and return above the 0.5800 level.
The short-term outlook remains negative. The pair is trading below the 0.5850 support area for the second consecutive day, increasing the risk of further declines. While the RSI and stochastic indicators are near oversold levels, they keep moving sideways.
A close below the 0.5800 psychological mark, which triggered an impressive bull wave a year ago, could dampen market sentiment, squeezing the price toward the 0.5740 region taken from November 2022. If the 0.5700 round level proves fragile too, the decline could stretch toward the 0.5650 constraining zone last seen in October 2022.
Otherwise, an upside reversal could immediately halt near the steep resistance trendline at 0.5870. The 20-day simple moving average (SMA) at 0.5915 will be closely watched as well following the defeat near the line last month. Should the bulls surge higher, they may initially test the barrier of 0.5975 before advancing toward the previous high of 0.6035.
Overall, NZDUSD remains in a bearish trend, within a broad range that has held since the start of 2023. While short-term stability is possible, a significant rally seems unlikely. The Reserve Bank of New Zealand's (RBNZ) rate decision on Wednesday could add further volatility, with a potential 50bps rate cut on the table.
ECB’s de Guindos: Inflation easing, focus shifts to fragile growth
In an interview with Helsingin Sanomat, ECB Vice President Luis de Guindos acknowledged the shifting priorities of the ECB as inflation continues to decline.
Inflation is expected to return to the medium-term target of 2% by 2025. At the same time, economic growth remains very weak. So "concerns about high inflation have shifted to economic growth". he said.
Additionally, he highlighted the rising challenges posed by "geopolitical risks" and uncertainty surrounding US. trade and fiscal policies, which could have broader implications for the Eurozone economy.
Looking ahead, ECB’s December projections will offer further clarity, but De Guindos reiterated that if current forecasts hold, the central bank will "continue making our monetary policy stance less restrictive."
De Guindos stressed the importance of a cautious, data-driven approach in such uncertain conditions, noting that "it’s difficult to make predictions about the specific number and size of rate cuts." However, with inflation moving closer to the medium-term target, ECB appears set to maintain its easing bias.
GBP/JPY Daily Outlook
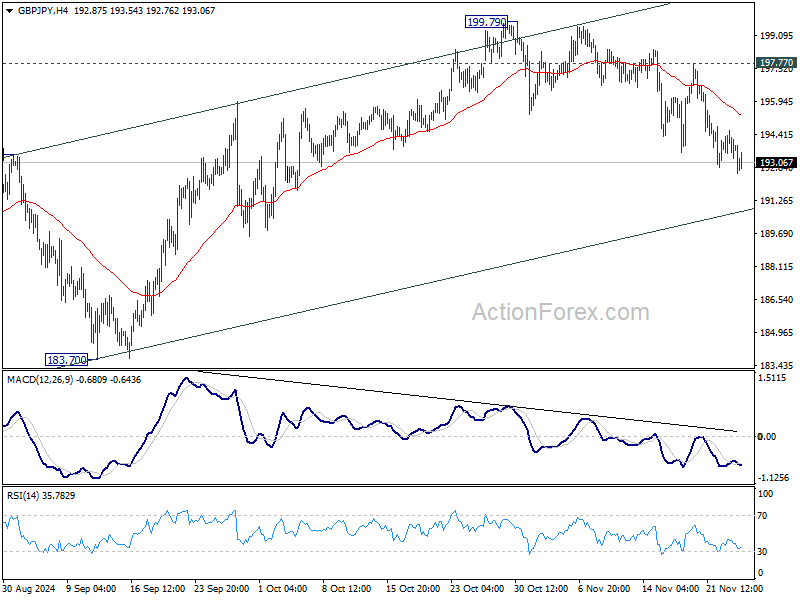
Daily Pivots: (S1) 193.16; (P) 193.89; (R1) 194.51; More...
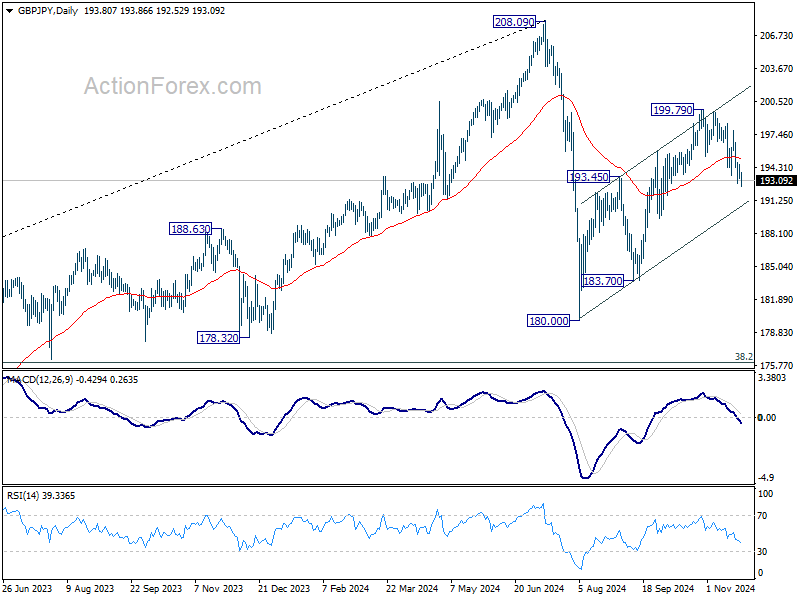
No change in GBP/JPY's outlook and intraday bias stays on the downside. Corrective rise from 180.00 could have completed with three waves up to 199.79. Deeper fall would be seen to 183.70 support. For now, risk will stay on the downside as long as 197.77 resistance holds, in case of recovery.
In the bigger picture, price actions from 208.09 are seen as a correction to whole rally from 123.94 (2020 low). The range of consolidation should be set between 38.2% retracement of 123.94 to 208.09 at 175.94 and 208.09. However, decisive break of 175.94 will argue that deeper correction is underway.
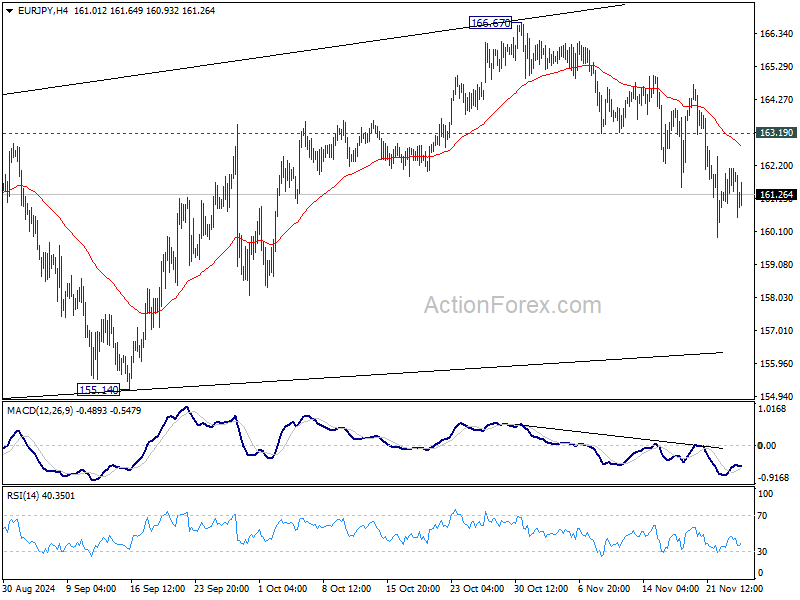
EUR/JPY Daily Outlook
Daily Pivots: (S1) 161.17; (P) 161.64; (R1) 162.30; More....
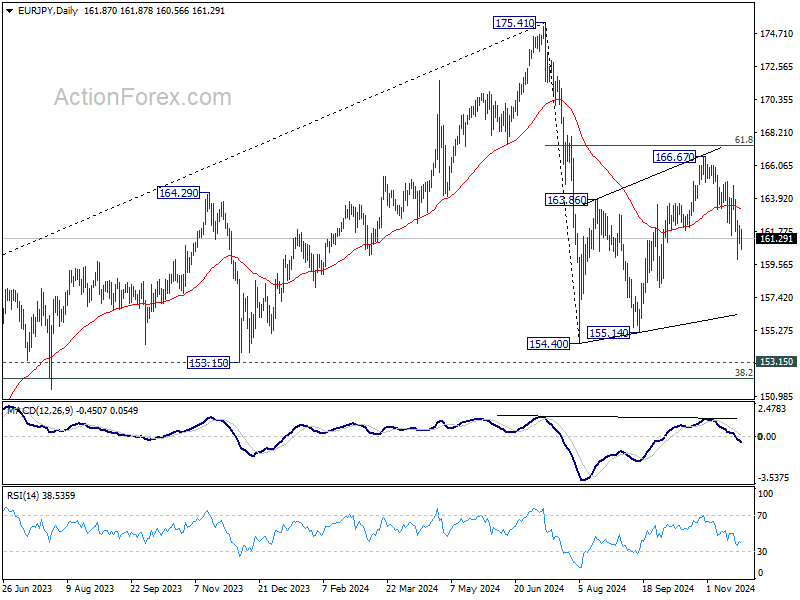
Further decline is expected in EUR/JPY with 163.19 support turned resistance intact. Corrective rebound from 154.40 could have completed with three waves up to 166.67. Deeper fall would be seen to 155.14 support next. Nevertheless, firm break of 163.19 will bring retest of 166.67 high instead.
In the bigger picture, price actions from 175.41 are seen as correction to rally from 114.42 (2020 low). The range of consolidation should have been set between 38.2% retracement of 114.42 to 175.41 at 152.11 and 175.41 high. However, decisive break of 152.11 would argue that deeper correction is underway.
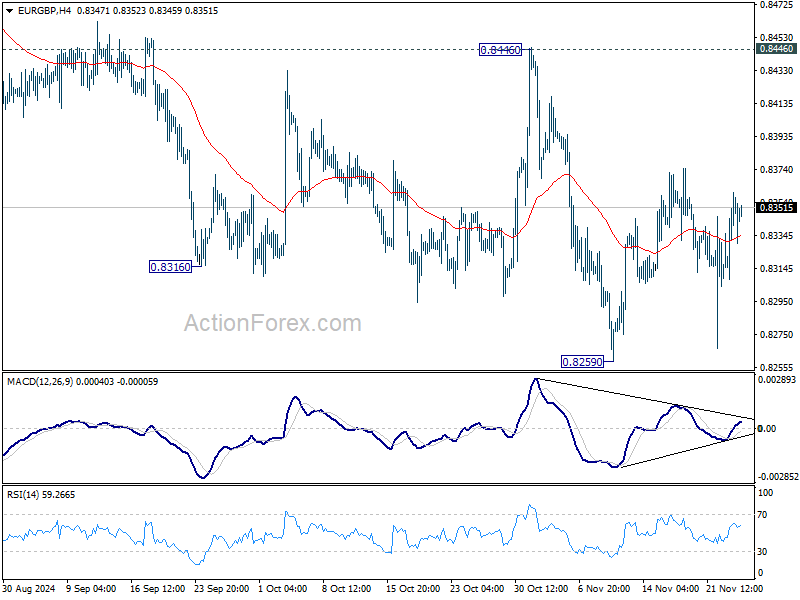
EUR/GBP Daily Outlook
Daily Pivots: (S1) 0.8319; (P) 0.8341; (R1) 0.8372; More...
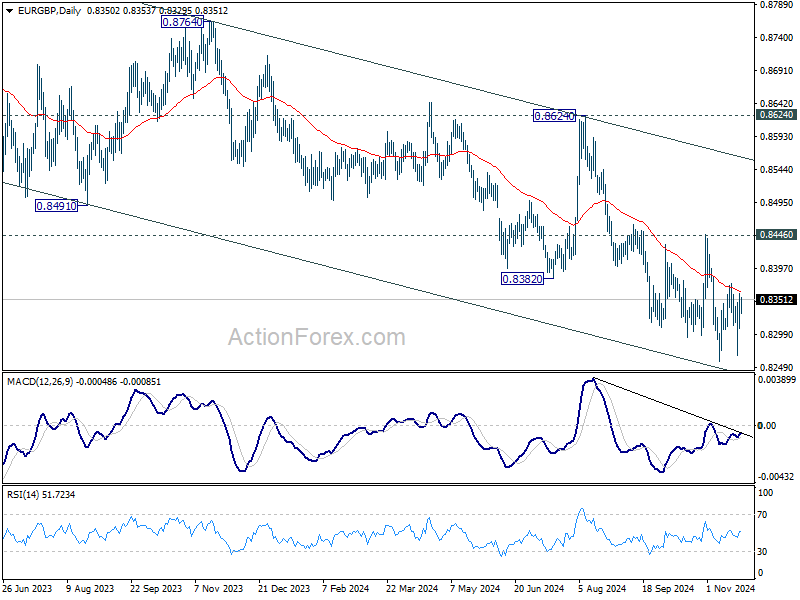
EUR/GBP is staying in range trading above 0.8259 and intraday bias remains neutral. Outlook stays bearish with 0.8446 resistance intact. On the downside, decisive break of 0.8259 will resume larger down trend to 0.8201 key support.
In the bigger picture, down trend from 0.9267 (2022 high) is in progress. Next target is 0.8201 (2022 low), but strong support should be seen there to bring rebound. However, outlook will remain bearish as long as 0.8624 resistance holds even in case of strong rebound. Decisive break of 0.8201 will indicate long term bearish reversal.
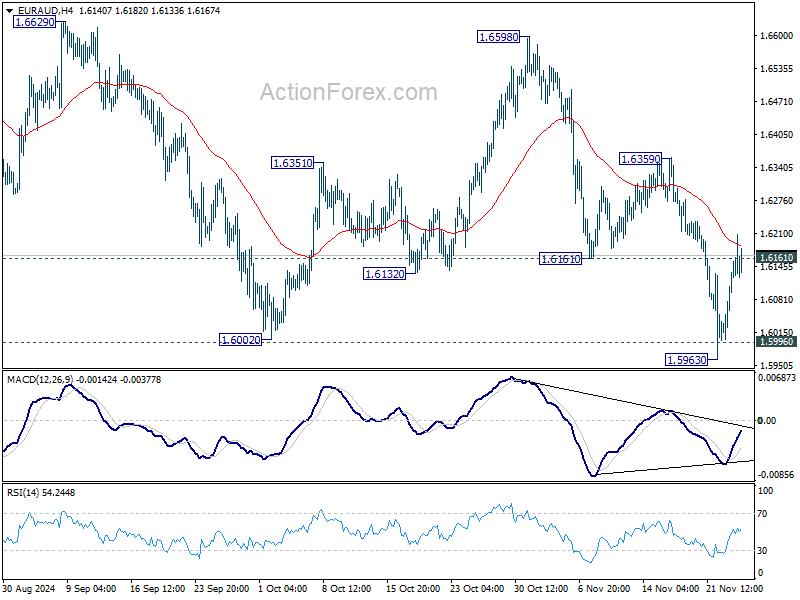
EUR/AUD Daily Outlook
Daily Pivots: (S1) 1.5948; (P) 1.6041; (R1) 1.6117; More...
EUR/AUD's rebound from 1.5963 extend higher and the break of 1.6161 support turned resistance delays the bearish case. Intraday bias is turned neutral first. Further fall would remain in favor as long as 1.6359 resistance holds. Sustained break of 1.5996 key support will carry larger bearish implications. However, break of 1.6359 will be the first sign of bullish reversal and target 1.6598 resistance for confirmation.
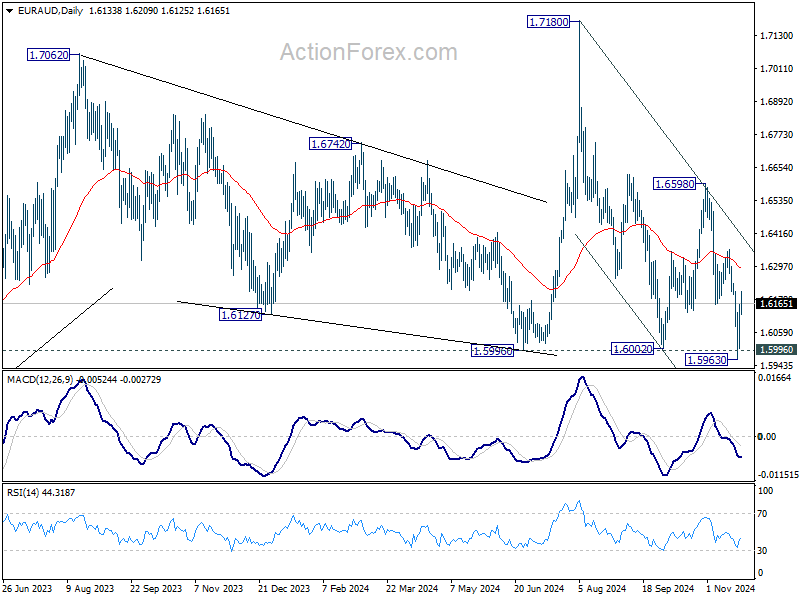
In the bigger picture, immediate focus is now on 1.5996 key support level. Sustained break there will argue that whole up trend from 1.4281 (2022 low) is already reversing. Deeper decline would be seen to 61.8% retracement of 1.4281 to 1.7180 at 1.5388, even as a correction. Nevertheless, strong rebound from current level, followed by break of 1.6359 resistance, will keep medium term outlook neutral at worst.
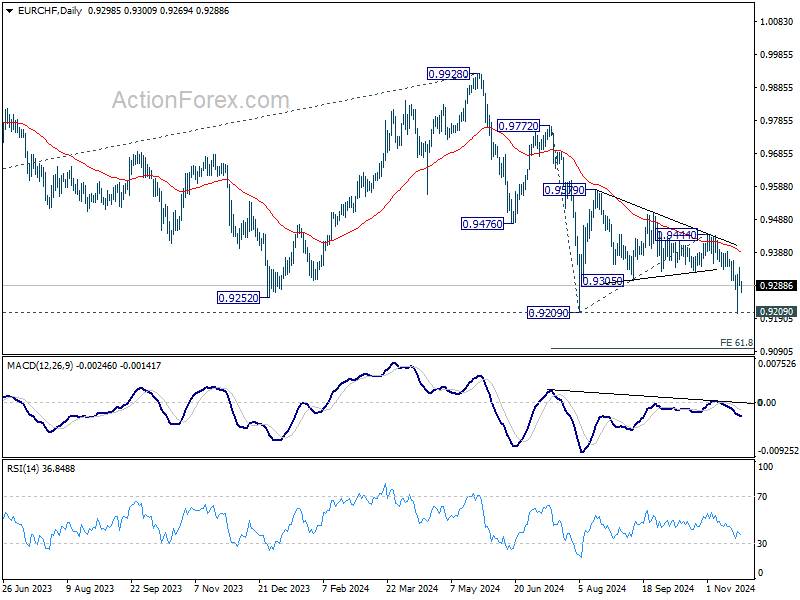
EUR/CHF Daily Outlook
Daily Pivots: (S1) 0.9281; (P) 0.9313; (R1) 0.9334; More....
With break of 0.9294 minor support, rebound from 0.9204 could have completed after rejection by 55 4H EMA. Intraday bias is back on the downside for retesting 0.9204/9 support zone. Decisive break there will indicate larger down trend resumption. For now, outlook will stay bearish as long as 0.9364 resistance holds.
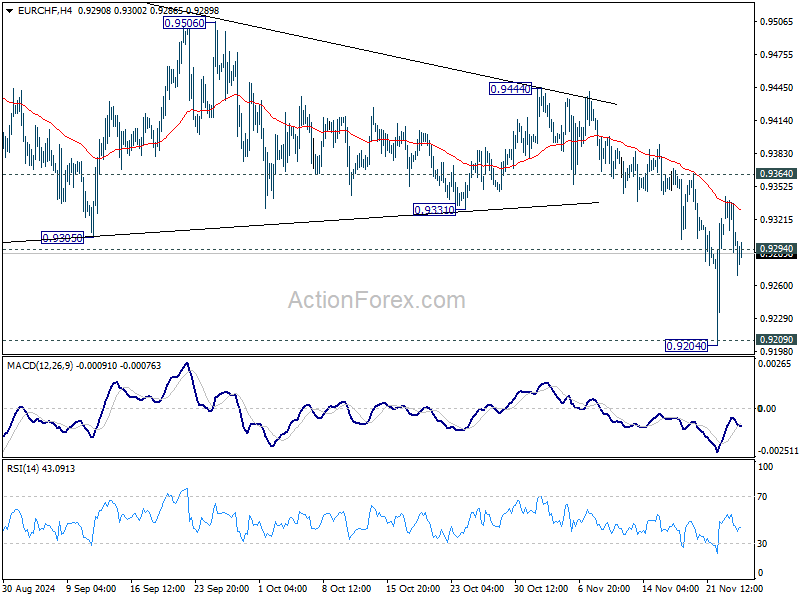
In the bigger picture, outlook will now stay bearish as long as 0.9444 resistance holds. Decisive break of 0.9209 low will resumed long term down trend to 61.8% projection of 0.9772 to 0.9209 from 0.9444 at 0.9096 next.