
Sample Category Title
GBP/USD Mid-Day Outlook
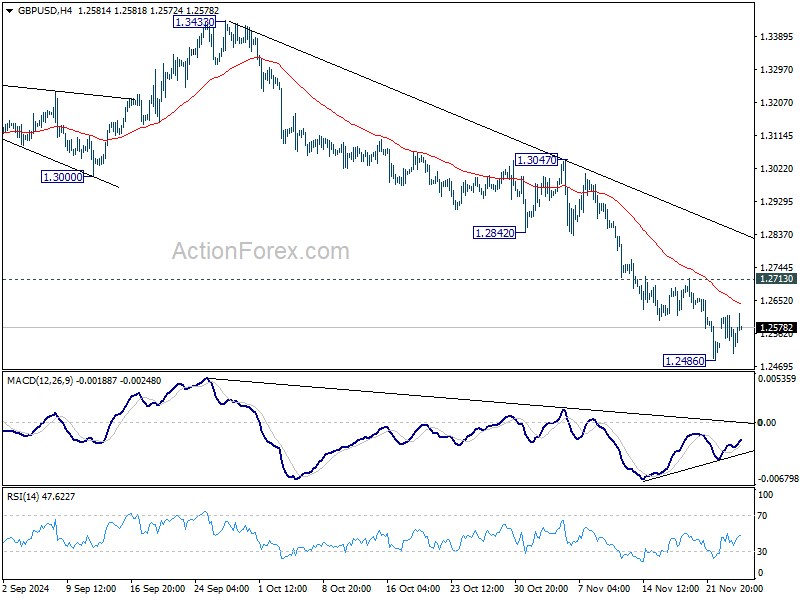
Daily Pivots: (S1) 1.2536; (P) 1.2575; (R1) 1.2608; More...
Intraday bias in GBP/USD remains neutral and more consolidations would be seen above 1.2486. Further decline is expected as long as 1.2713 resistance holds. On the downside, break of 1.2486 will resume the fall from 1.3433 to 1.2298 cluster support zone.
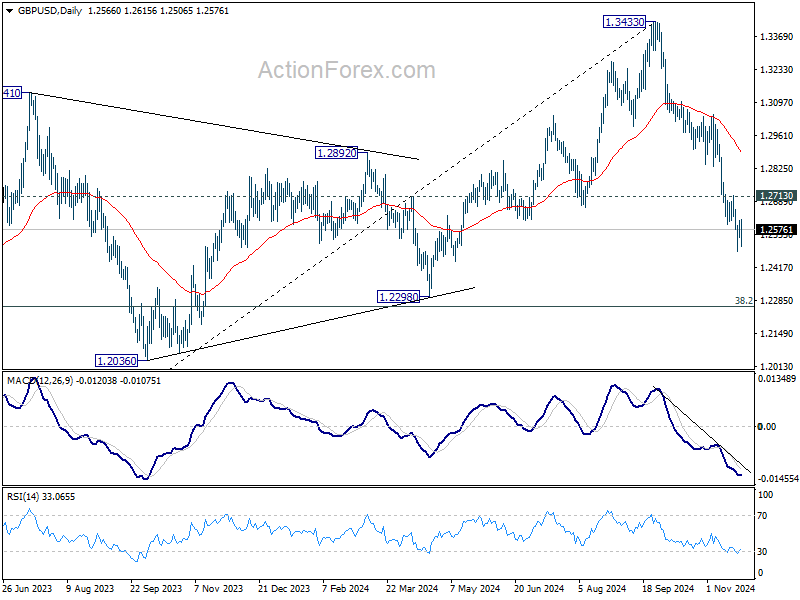
In the bigger picture, a medium term top should be in place at 1.3433, and price actions from there are correcting whole up trend from 1.0351 (2022 low). Deeper decline is now expected as long as 55 D EMA (now at 1.2893) holds, to 38.2% retracement of 1.0351 to 1.3433 at 1.2256, which is close to 1.2298 structural support. Strong support should be seen there to bring rebound.
USD/CHF Mid-Day Outlook
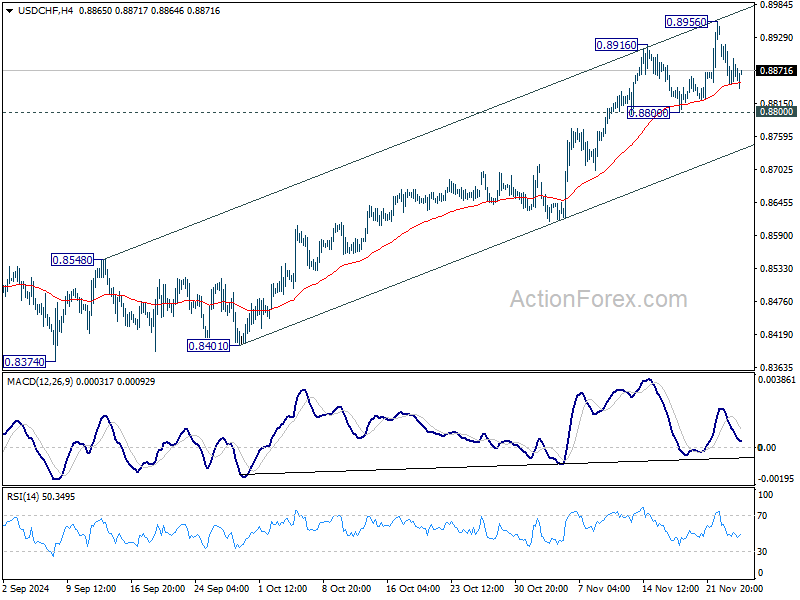
Daily Pivots: (S1) 0.8835; (P) 0.8877; (R1) 0.8905; More…
Intraday bias in USD/CHF stays neutral and more consolidations would be seen below 0.8956. Outlook will continue to stay bullish as long as 0.8800 support holds, in case of retreat. Break of 0.8956 will resume the rally from 0.8374, and target 0.9223 key resistance next.
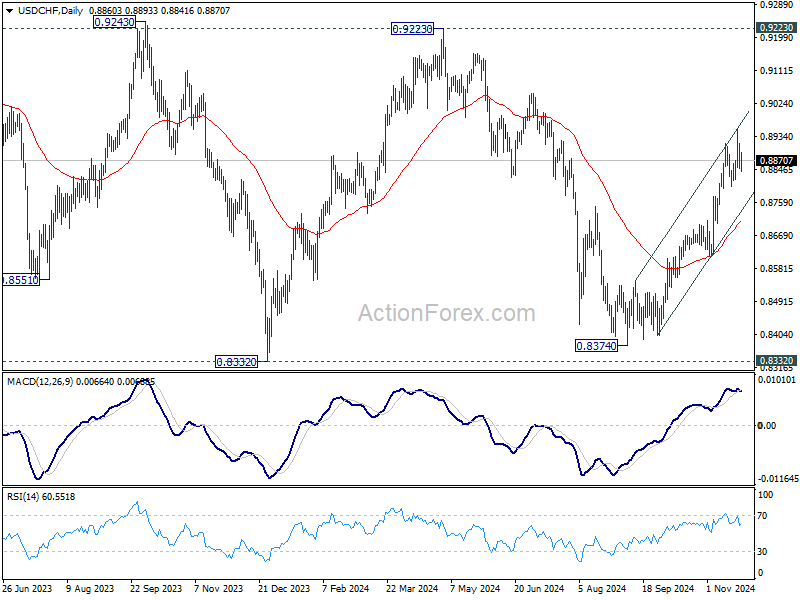
In the bigger picture, price actions from 0.8332 (2023 low) are currently seen as a medium term corrective pattern. Rise from 0.8374 is seen as the third leg. Overall outlook will continue to stay bearish as long as 0.9223 resistance holds. Break of 0.8332 low is in favor at a later stage when the consolidation completes.
USD/JPY Mid-Day Outlook
Daily Pivots: (S1) 153.58; (P) 154.15; (R1) 154.75; More...
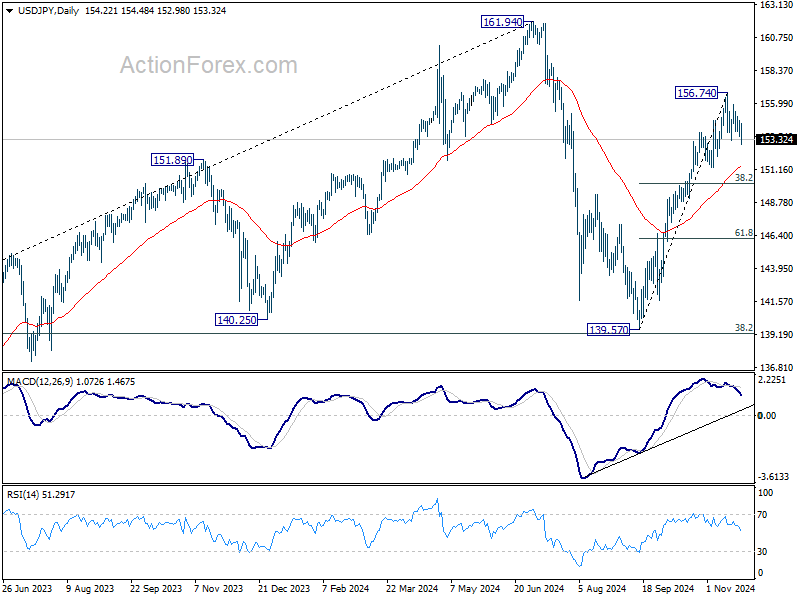
USD/JPY's break of 153.27 minor support suggests that correction from 156.74 is extending lower. Intraday bias is back on the downside for 38.2% retracement of 139.57 to 156.74 at 150.18. For now, risk will stay on the downside as long as 156.74 resistance holds, in case of recovery.
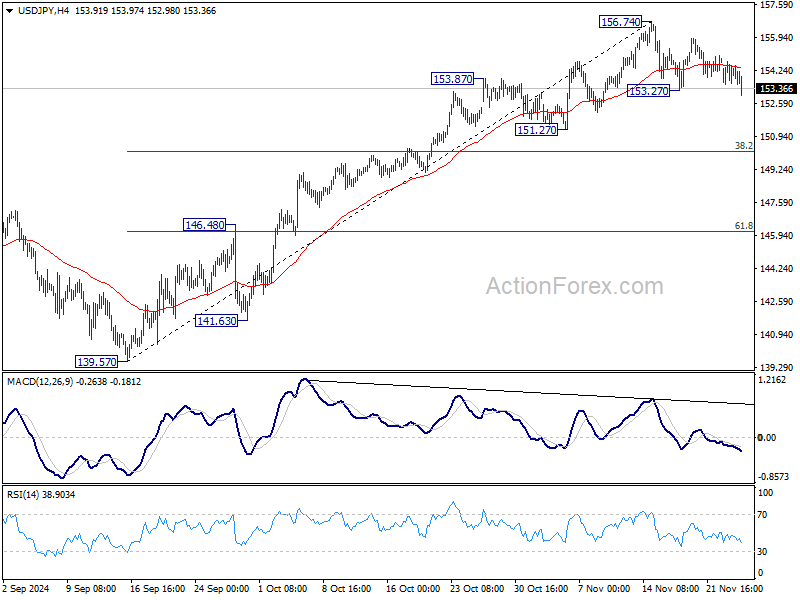
In the bigger picture, price actions from 161.94 are seen as a corrective pattern to rise from 102.58 (2021 low). The range of medium term consolidation should be set between 38.2% retracement of 102.58 to 161.94 at 139.26 and 161.94. Nevertheless, sustained break of 139.26 would open up deeper medium term decline to 61.8% retracement at 125.25.
Dollar Weakens as Tariff Boost Fades; FOMC Minutes and RBNZ in the Spotlight
Dollar is losing some ground as markets enter into US session, as the initial support from US President-elect Donald Trump’s tariff announcement dissipated. Although the greenback softened broadly, it is still holding onto gains against Loonie and Aussie, with traders as Trump’s tariffs are targeting Canada, China, alongside Mexico.
Market focus now turns to FOMC minutes, with traders eager to gauge sentiment among policymakers ahead of December’s rate decision. Currently, Fed fund futures indicate a 60% probability of a 25bps rate cut, but recent commentary from Fed officials has left room for doubt. The minutes may provide insight into how aligned policymakers are on easing monetary policy further or maintaining caution.
In terms of currency performance, Yen leads as the strongest performer of the day. Sterling and Euro also showed some mild strength. Meanwhile, Loonie is the weakest, pressured by trade concerns, followed by Aussie and Dollar. Swiss Franc and Kiwi are holding relatively neutral positions.
Looking ahead, the Asian session will bring two key events: RBNZ rate decision and Australia’s monthly CPI release.
RBNZ is widely expected to implement another 50bps rate cut, bringing the policy rate to 4.25%. Traders will closely examine the updated economic projections, particularly regarding additional policy easing in 2025.
On the other hand, the expected rebound in October CPI reading in Australia could reinforce RBA's stance to delay its first rate cut from February to May next year.
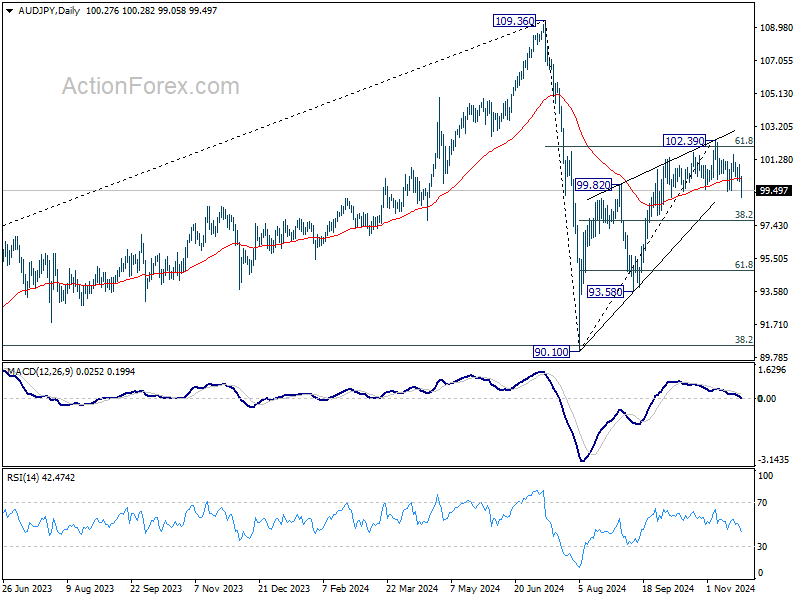
Technically, AUD/JPY's strong break of 55 EMA should confirm short term topping at 102.39. Deeper decline is now in favor back to 38.2% retracement of 90.10 to 102.39 at 97.69. Firm break there should indicate that corrective rebound from 90.10 has completed with three waves up to 102.39. In this bearish case, deeper fall should be seen to 61.8% retracement at 94.79 and below.
In Europe, at the time of writing, FTSE is down -0.12%. DAX is down -0.27%. CAC is down -0.25%. CAC is down -0.26%. UK 10-year yield is up 0.004 at 4.351. Germany 10-year yield is down -0.011 at 2.200. Earlier in Asia, Nikkei fell -0.87%. Hong Kong HSI rose 0.04% China Shanghai SSE fell -0.12%. Singapore Strait Times fell -0.51%. Japan 10-year JGB yield fell -0.0038 to 1.070.
BoC’s Mendes signals further rate cuts, data-dependent approach
BoC Deputy Governor Rhys Mendes said in a speech today that “We no longer need interest rates to be as restrictive as they were,” which justified the larger rate reduction of 50 bps at this month's meeting.
Inflation data for October came in at 2%, matching expectations, while preferred core inflation measures edged up to approximately 2.5%. Mendes noteds that key upcoming data points, including third-quarter GDP and November employment figures, will play a critical role in shaping the BoC’s December rate decision.
“If the economy evolves broadly in line with our forecast,” Mendes stated, “then it’s reasonable to expect further cuts to our policy rate.”
However, he emphasized that the timing and pace of any additional easing will depend on incoming data and its implications for the inflation outlook.
ECB’s de Guindos: Inflation easing, focus shifts to fragile growth
In an interview with Helsingin Sanomat, ECB Vice President Luis de Guindos acknowledged the shifting priorities of the ECB as inflation continues to decline.
Inflation is expected to return to the medium-term target of 2% by 2025. At the same time, economic growth remains very weak. So "concerns about high inflation have shifted to economic growth". he said.
Additionally, he highlighted the rising challenges posed by "geopolitical risks" and uncertainty surrounding US. trade and fiscal policies, which could have broader implications for the Eurozone economy.
Looking ahead, ECB’s December projections will offer further clarity, but De Guindos reiterated that if current forecasts hold, the central bank will "continue making our monetary policy stance less restrictive."
De Guindos stressed the importance of a cautious, data-driven approach in such uncertain conditions, noting that "it’s difficult to make predictions about the specific number and size of rate cuts." However, with inflation moving closer to the medium-term target, ECB appears set to maintain its easing bias.
ECB’s Villeroy expects limited inflation impact in Europe from Trump policies
French ECB Governing Council member Francois Villeroy de Galhau highlighted the global economic risks stemming from US President-elect Donald Trump’s plans to increase tariffs and implement tax cuts. Speaking at a retail investor conference in Paris, Villeroy noted that these policies could raise inflation in the US while dampening growth internationally.
While Villeroy acknowledged that the inflationary impact on Europe would likely be “relatively limited,” he emphasized the influence on European long-term interest rates.
“Long-term interest rates set by the market have a certain tendency to cross the Atlantic,” he remarked, suggesting that US policy changes could indirectly affect Eurozone markets.
"I don't think it changes much for European short-term rates, but long-term rates could see a transition effect," he noted.
USD/JPY Mid-Day Outlook
Daily Pivots: (S1) 153.58; (P) 154.15; (R1) 154.75; More...
USD/JPY's break of 153.27 minor support suggests that correction from 156.74 is extending lower. Intraday bias is back on the downside for 38.2% retracement of 139.57 to 156.74 at 150.18. For now, risk will stay on the downside as long as 156.74 resistance holds, in case of recovery.
In the bigger picture, price actions from 161.94 are seen as a corrective pattern to rise from 102.58 (2021 low). The range of medium term consolidation should be set between 38.2% retracement of 102.58 to 161.94 at 139.26 and 161.94. Nevertheless, sustained break of 139.26 would open up deeper medium term decline to 61.8% retracement at 125.25.
BoC’s Mendes signals further rate cuts, data-dependent approach
BoC Deputy Governor Rhys Mendes said in a speech today that “We no longer need interest rates to be as restrictive as they were,” which justified the larger rate reduction of 50 bps at this month's meeting.
Inflation data for October came in at 2%, matching expectations, while preferred core inflation measures edged up to approximately 2.5%. Mendes noteds that key upcoming data points, including third-quarter GDP and November employment figures, will play a critical role in shaping the BoC’s December rate decision.
“If the economy evolves broadly in line with our forecast,” Mendes stated, “then it’s reasonable to expect further cuts to our policy rate.”
However, he emphasized that the timing and pace of any additional easing will depend on incoming data and its implications for the inflation outlook.
Australian Dollar Under Pressure, CPI Next
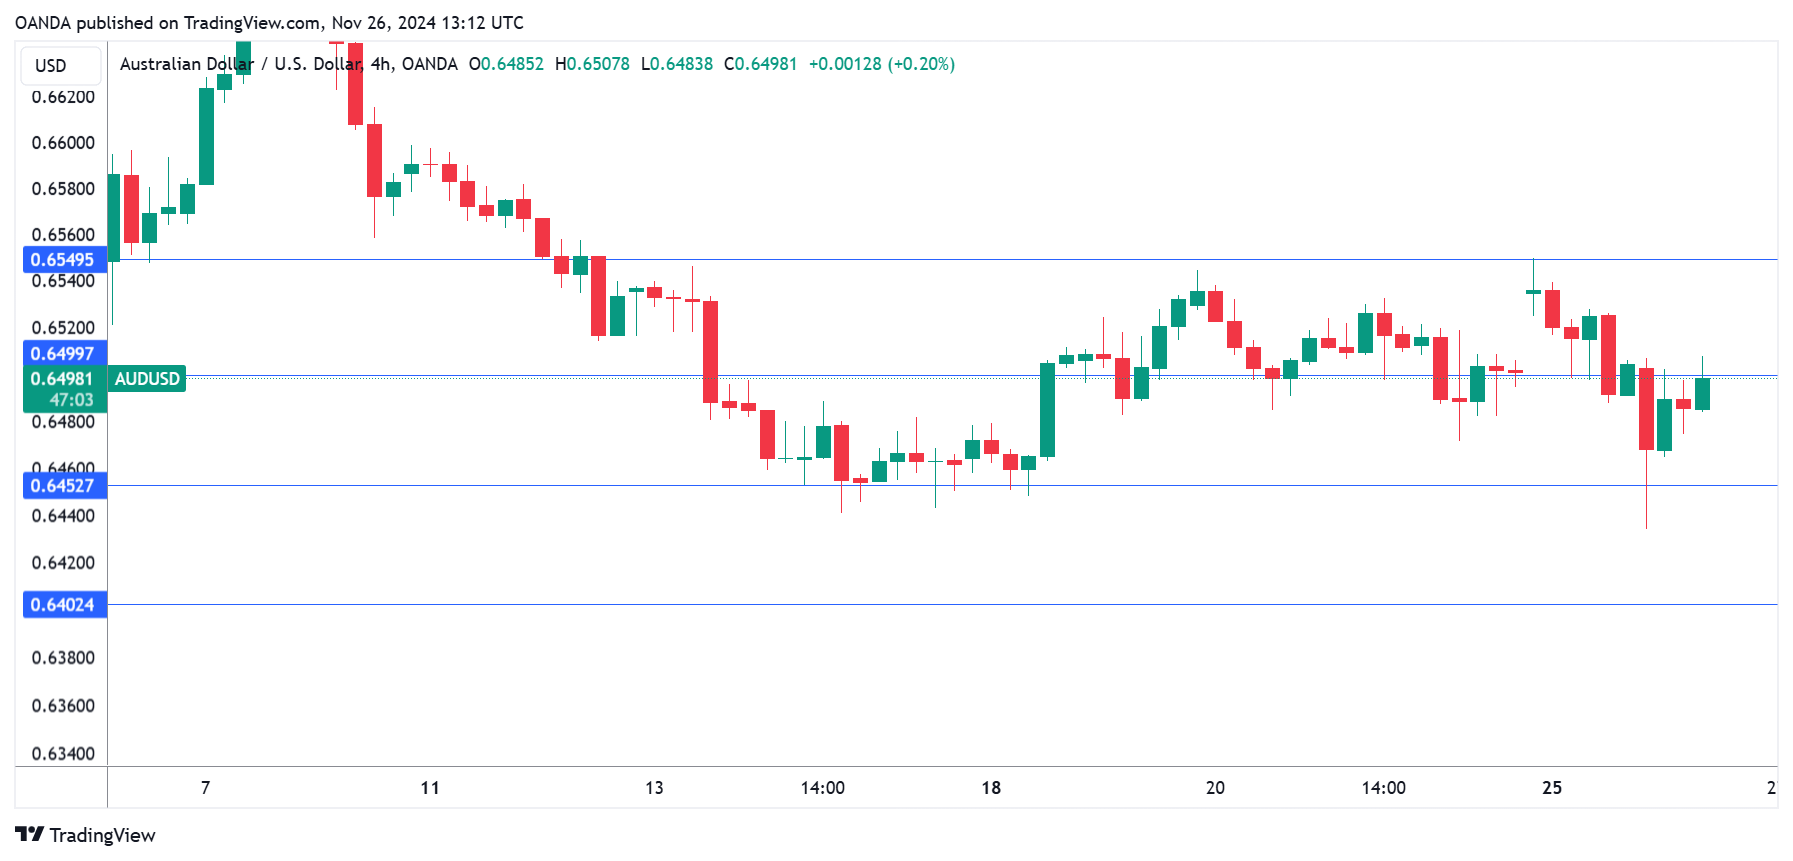
The Australian dollar declined as much as 1% on Tuesday before recovering these losses. In the European session, AUD/USD is trading at 0.6497, down 0.1% on the day. Earlier, the Aussie dropped to low of 0.6433, its lowest level since August.
Australian inflation expected to rise
Australia releases the inflation report early on Wednesday. The inflation rate is expected to rise in October to 2.3% y/y, after a 2.1% gain in September. Investors are keeping a close eye on the release, which could play a factor in the Reserve Bank of Australia next rate announcement on Dec. 10.
The RBA has held interest rates at a 12-year high of 4.35% for over a year. The central bank has become an outlier among other major banks, which are in an easing cycle in response to falling inflation. Australia’s inflation rate is moving in the right direction and dropped to 2.8% in October, within the central bank’s target of 2% to 3%.
The RBA has remained hawkish, saying that underlying inflation is too high. The central bank hasn’t ruled out a rate hike, stating at the meeting earlier this month that “it was not possible to rule anything in or out in relation to future changes in the cash rate target”. The RBA isn’t in any rush to lower rates, and can be expected to continue to hold rates until inflation falls further or the labor market weakens.
Still, a rate hike isn’t likely as it would be an extremely unpopular move. Australian home owners are chafing under high rates but aren’t likely to get any rate relief until next year.
AUD/USD Technical
- AUD/USD tested support at 0.6489 earlier. Below, there is support at 0.6467
- 0.6530 and 0.6552 are the next resistance lines
ECB’s Villeroy expects limited inflation impact in Europe from Trump policies
French ECB Governing Council member Francois Villeroy de Galhau highlighted the global economic risks stemming from US President-elect Donald Trump’s plans to increase tariffs and implement tax cuts. Speaking at a retail investor conference in Paris, Villeroy noted that these policies could raise inflation in the US while dampening growth internationally.
While Villeroy acknowledged that the inflationary impact on Europe would likely be “relatively limited,” he emphasized the influence on European long-term interest rates.
“Long-term interest rates set by the market have a certain tendency to cross the Atlantic,” he remarked, suggesting that US policy changes could indirectly affect Eurozone markets.
"I don't think it changes much for European short-term rates, but long-term rates could see a transition effect," he noted.
USDCAD Falls from 4½-Year High
- USDCAD declines from 1.4100 again
- RSI moves horizontally below 70
- MACD still in bullish momentum
USDCAD has successfully broken the 1.4100 psychological mark earlier today, taking the market towards a fresh four-and-a-half-year high of 1.4176. The price rose around 1.5% only in just one 4-hour session but is currently turning lower.
The RSI indicator is mirroring the latest pullback, flattening beneath the 70 level; however, the MACD oscillator is still extending its bullish momentum above its trigger and zero lines.
If the pair continues to head south, the first restrictive region to meet is the 1.4020-1.4035 area. Slightly lower, the 50- and the 20-period simple moving averages (SMAs) at 1.4010 and 1.4000 may pause the declining move.
On the other hand, a rally could open the door of a retest of today’s top at 1.4176 ahead of the 1.4300 round number.
In brief, USDCAD has experienced a notable bullish move earlier but will it remain above 1.4100?

AUD/JPY Technical: Trump Trade Tariffs Tantrum May Spark a Sell-off Yen Cross Pairs
- US President-elect Trump used his Truth Social network to announce his latest tariff threats.
- Trump vowed to impose 10% additional tariffs on China exports to the US and 25% tariffs on all products from Mexico and Canada.
- The recent two-month rally seen in AUD/JPY has flashed out bearish technical elements.
The financial market has managed to breathe a “sign of relief” on Monday, 25 November after the incoming Trump administration announced Scott Bessent as the US Treasury Secretary nominee last Friday.
Bessent, a Wall Street veteran is being viewed as a more pragmatic person who may favour pro-growth policies (an advocate of Trump’s corporate tax cuts and deregulation policies) over anti-growth initiatives such as steep trade tariffs on China and the rest of the world’s products as part of President-elect Trump’s flagship “American First” policy.
Trade tariffs tantrum déjà vu vibes are back
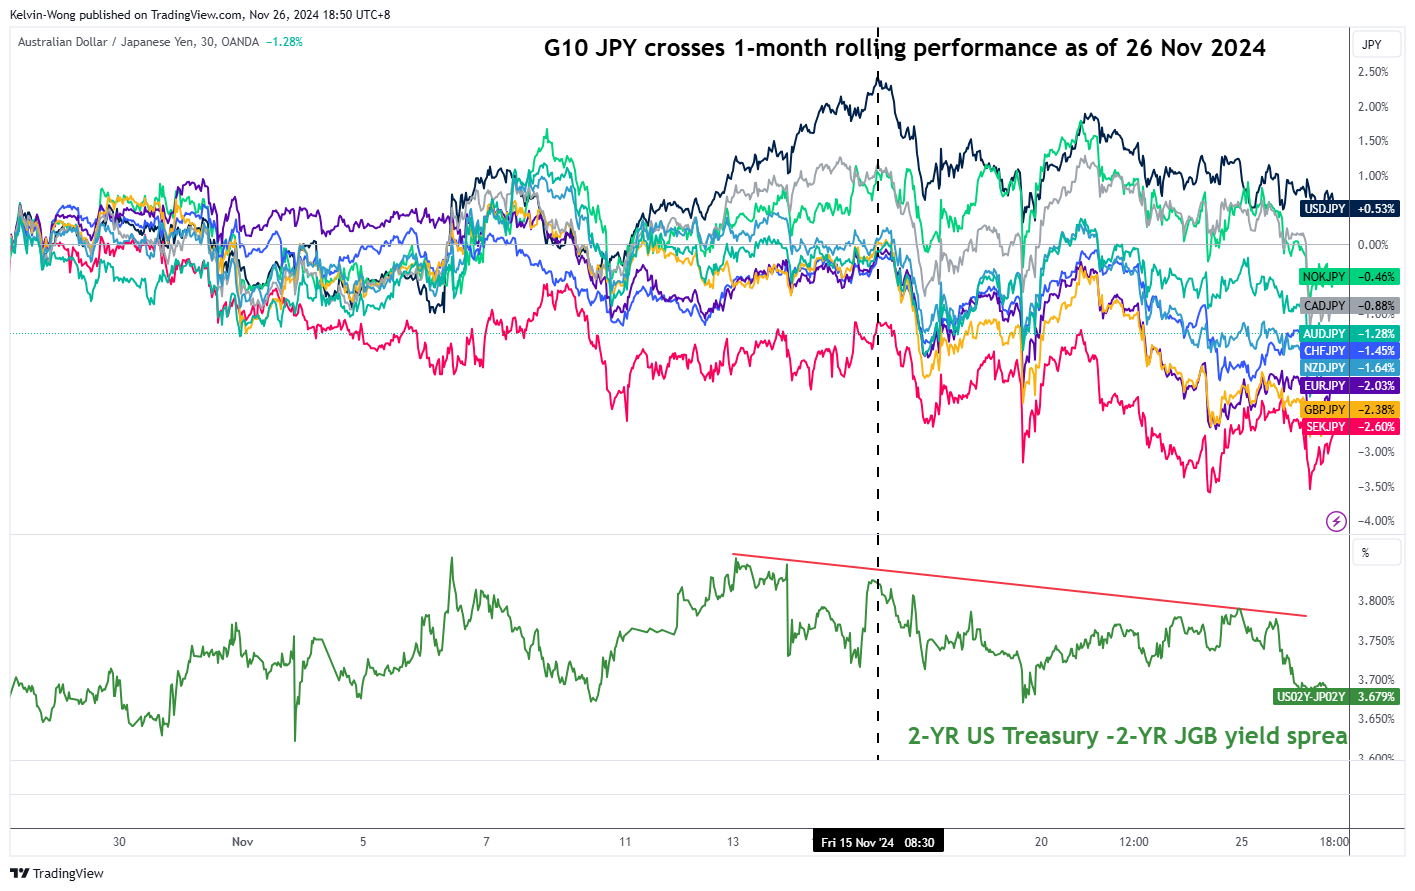
Fig 1: G10 JPY cross pairs one-month rolling performance as of 26 Nov 2024 (Source: TradingView, click to enlarge chart)
Ironically such optimistic viewpoints are being put to a challenge today as “trade tariffs tantrum” déjà vu vibes from Trump remerged. The US President-elect said that he would impose additional 10% tariffs on goods from China and 25% tariffs on all products from Mexico and Canada in social media posts on his Truth Social network to clamp down on migrants and illegal drugs flowing across borders.
These tariff threat comments from Trump roiled the risk-sensitive yen crosses as they traded lower from their respective 15 November peaks (see Fig 1).
A potential bearish reversal looms for AUD/JPY

Fig 2: AUD/JPY medium-term & major trends as of 26 Nov 2024 (Source: TradingView, click to enlarge chart)
In the lens of technical analysis, the recent two-monthly rally seen in the AUD/JPY from its 11 September 2024 swing low area of 93.65 has started to display inherent technical weakness before this latest bout of Trump’s tariff threat news flow.
Since its 5 August 2024 low of 90.14, the price actions of the AUD/JPY have evolved into a potential bearish “Ascending Wedge” configuration which suggests a potential corrective rally (dead cat bounce) rather than the start of an impulsive upmove sequence (see Fig 2).
Also, the price actions of the AUD/JPY from 3 October to 25 November have stalled at around the key 200-day moving average which suggests hesitation by the bulls.
In addition, the daily RSI indicator has also flashed out a bearish momentum condition since 7 November 2024.
Intermarket analysis also suggests a potential bearish reversal of the AUD/JPY as the yield spread between the 2-year Australian Government Bonds and Japanese Government Bonds has continued to narrow since 31 October 2023 and its recent rebound has been rejected around the 3.70% key resistance level on 1 November.
Watch the 98.20 intermediate support on the AUD/JPY, and a break below it may expose the major support of 93.65 defined by the lower boundary of the long-term secular ascending channel from the March 2020 low.
In the next step, a weekly close below 93.65 may trigger the start of a potential multi-week corrective decline sequence to expose the next support at 87.00 in the first step.
On the other hand, clearance above the 104.95 key medium-term pivotal resistance invalidates the bearish tone for a retest on the major resistance zone of 107.85/109.40.
Brent Crude – Oil Eyes Recovery as OPEC + Deliberate Oil Cut Rollover
- Oil prices rose in early European trade following a drop on Monday.
- OPEC+ is set to meet on December 1st to discuss a potential oil cut rollover into 2025.
- Technically, Brent Crude has been in a tight range, with key support and resistance levels identified.
Oil prices have risen in early European trade following a 2.7% drop on Monday. Hopes of a ceasefire in the Middle East helped push Oil price lower as markets focus shifted back toward supply demand dynamics.
Adding to Brent Crude’s challenges was rumors that Donald Trump may slash the red tape around oil drilling on Federal lands. There are also rumors that Trump may confront the IEA around their focus on green energy. This was another factor in the possible drop in oil prices.
OPEC + to Consider Oil Cut Rollover in December
OPEC + are set to meet on December 1 in what has been confirmed to be an online meeting. Rumors have begun to do the rounds that the Oil cartel will debate and confirm an Oil cut rollover into 2025.
Azerbaijan Energy Minister Parviz Shahbazov confirmed as much, stating that “OPEC+ could or couldn’t discuss oil output rollover at its next meeting. It is difficult to prejudge”. Three OPEC+ sources familiar with the discussions told Reuters last week that it may push back output increases again when it meets on Dec. 1 due to weak global oil demand.
OPEC + and the IEA continue to have differing views on Oil demand moving forward. Today we heard comments from the head of the International Energy Agency (IEA) Fatih Birol. Mr Birol stated that the supply of oil and gas will be plentiful, with oil markets being “comfortable” this year and next unless major geopolitical escalation happens.
Of course as things are shaping up this may be a real reality as the Russia-Ukraine conflict heats. At the same time there are murmurs that the US may look to confront Iran head on during the Trump Presidency.
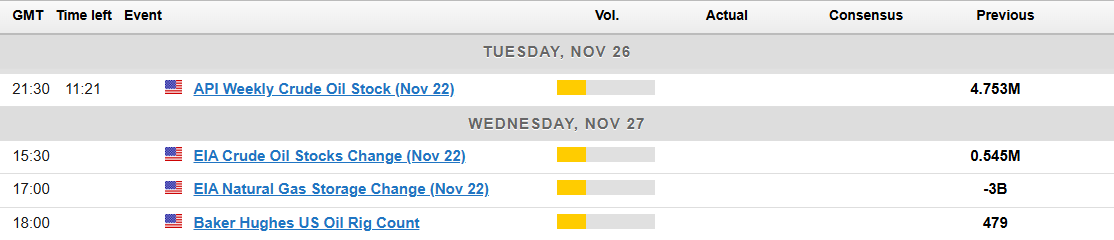
Oil Inventory Data Ahead
The upcoming API and EIA oil inventory data releases on November 26 and 27, 2024 will provide critical insights into U.S. crude supply levels, helping traders and analysts gauge the balance between supply and demand.
If the data reveals a larger-than-expected inventory build, it may signal weaker demand or oversupply, likely putting downward pressure on oil prices. Conversely, a substantial draw in inventories could highlight tighter supply conditions and potentially trigger a price rally.
Either way the bigger question on my mind is whether either move will be sustainable.
Technical Analysis
From a technical perspective, Oil has been stuck in a tight range over the six weeks. The range between 76.35 and the 71.00 handle continues to hold firm.
Yesterday’s selloff found support just shy of the key level around 72.38 before bouncing and moving higher in the European session. Immediate resistance rests around the psychological 75.00 handle before the range high at 76.35 comes into focus. If the range breaks we have the 100-day MA resting at 76.83.
Should the selloff resume today, immediate support rests at 72.38 before the 71.00 handle comes into focus. A break of the range low at 71.00 could lead to a sharp decline toward the psychological 70.00 handle and beyond.
Brent Crude Oil Daily Chart, November 26, 2024
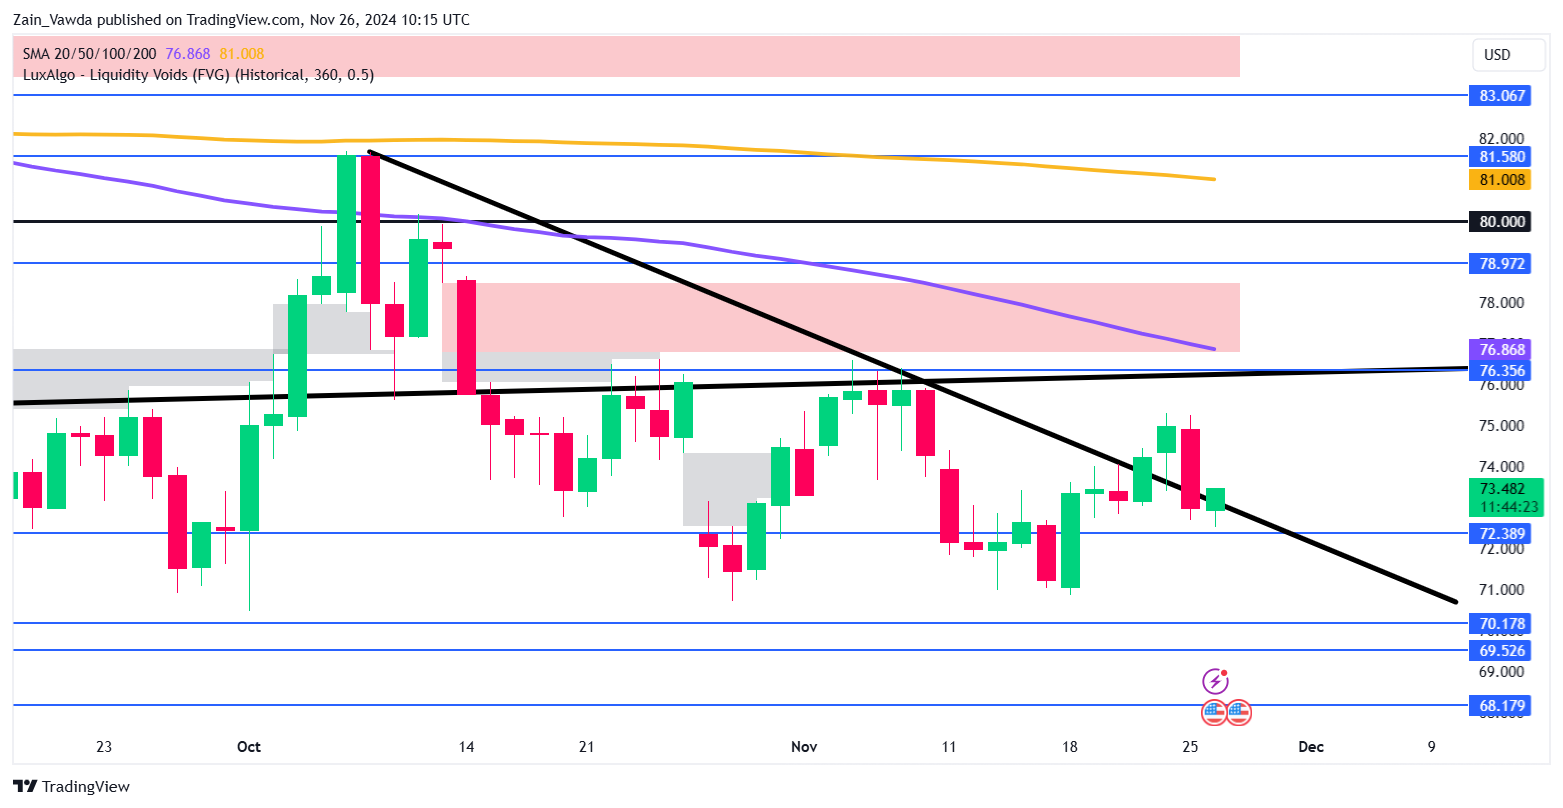
Source: TradingView (click to enlarge)
Support
- 72.83
- 71.00
- 70.00 (key area of confluence)
Resistance
- 75.00
- 76.35
- 76.83