Sample Category Title
(FED) Minutes of the Federal Open Market Committee
November 6–7, 2024
A joint meeting of the Federal Open Market Committee and the Board of Governors of the Federal Reserve System was held in the offices of the Board of Governors on Wednesday, November 6, 2024, at 10:00 a.m. and continued on Thursday, November 7, 2024, at 9:00 a.m.1
Developments in Financial Markets and Open Market Operations
The manager turned first to a review of developments in financial markets. Nominal Treasury yields rose notably over the period; factors driving the increases in yields included stronger-than-expected data releases and monetary policy communications that were interpreted as signaling a more gradual pace of policy easing than previously thought. The rise at short maturities reflected increases in both real yields and inflation compensation, while the rise at longer maturities was primarily driven by increases in real yields. Broad equity prices also rose over the period, likely reflecting in part the solid incoming data and consequent lower odds of a weakening in the economic outlook. The VIX, which measures 30-day option-implied volatility of broad equity prices, had moved higher in the period leading up to the November elections and then decreased following Election Day.
The manager noted that the federal funds rate path had shifted up notably over the period, as measured by both the options-implied modal path and the futures-implied average path. Although the futures-implied path remained below the options-implied path at longer horizons, the gap between the two paths narrowed, likely reflecting market participants' judgment that risks had become less skewed toward the downside. In the Open Market Desk's Survey of Primary Dealers and Survey of Market Participants, a large majority of respondents had a modal expectation of a 25 basis point cut at this meeting and another 25 basis point cut at the December meeting. Further out, there was considerably more uncertainty. For example, although the mean of the average respondent's probability distribution for the federal funds rate at the trough of this easing cycle was close to the average respondent's expected longer-run level of the federal funds rate, respondents placed substantial weight on a wide range of outcomes.
The manager also discussed balance sheet policy expectations. The average of the survey responses indicated that the modal expectation regarding the timing of the end of balance sheet runoff had shifted a bit later, to May 2025. These responses remained dispersed, though roughly two-thirds of respondents expected an end to runoff in either the first or the second quarter of 2025. Survey results indicated that respondents expected balance sheet runoff to continue alongside rate cuts for several more months; the surveys therefore suggested that the Committee's two policy tools—the policy rate and the balance sheet—were not seen as working at cross-purposes.
Regarding international developments, the manager noted that policy rate expectations for the year-end declined in most advanced foreign economies (AFEs), with the exception of Australia and the U.K. The widening of differentials with U.S. interest rates had likely contributed to an increase in the trade-weighted dollar index, which reached its highest level this year.
The manager then turned to money markets and Desk operations. Unsecured overnight rates remained stable over the intermeeting period. In secured funding markets, rates on overnight repurchase agreements (repo) increased sharply and were volatile around the September quarter-end but, on other dates, generally stayed just above the rate offered at the overnight reverse repurchase agreement (ON RRP) facility. Market contacts attributed the pressures seen around the quarter-end to a combination of typical balance sheet constraints associated with financial reporting dates and a large net settlement of Treasury coupon securities that took place on the same day. Overall, developments in the repo market at the end of September and in early October appeared to conform with the typical quarter-end pattern, although the spike in repo rates observed on those days was the largest in the post-pandemic period.
The September quarter-end also saw the first non-test use of the standing repo facility (SRF), with two counterparties borrowing $2.6 billion. The manager noted that the relatively small utilization was not surprising, as repo rates in the noncentrally cleared segment of the triparty repo market—in which the facility operates—did not exceed the SRF rate for the most part. The manager also observed that there was a substantial volume of trades taking place above the SRF rate around quarter-end in other segments of the repo market. The manager indicated that, with dealers typically earning a spread in their intermediation activity, this outcome was not surprising. The manager suggested that considerations related to market structure also helped explain why repo rates were above the SRF rate in those segments at quarter-end. Overall, the manager judged that the SRF performed about in line with the Desk's expectations.
Usage of the ON RRP facility declined about $140 billion over the intermeeting period. This decline appeared to be driven primarily by additional net Treasury bill supply in recent weeks, which made Treasury bill yields more attractive. The manager also noted that, of late, the largest ON RRP participants had substantially reduced their participation at the facility, leading to a less concentrated configuration of ON RRP take-up than had been the case for some time.
Over the intermeeting period, pricing in the federal funds market continued to be insensitive to day-to-day changes in the supply of reserves. The manager noted that this outcome was consistent with reserves remaining abundant and that various other indicators pointed to the same conclusion.
The staff also provided an informational briefing to the Committee on two considerations related to the management of the balance sheet over the near term. The first consideration focused on the possibility of a technical adjustment to the ON RRP offering rate. The staff reviewed developments with respect to the usage of the ON RRP facility. The staff also noted that lowering the ON RRP offering rate 5 basis points would align the ON RRP offering rate with the bottom of the target range for the federal funds rate and would probably put some downward pressure on other money market rates.
The second consideration focused on the possible implications for the composition of Federal Reserve liabilities stemming from the federal debt limit potentially being reinstated in 2025. The staff presentation highlighted the fact that, should this event occur, a drawdown in the Treasury General Account (TGA) balances would increase the sum of reserves and ON RRP balances, and that a subsequent rebuilding of TGA balances would have the reverse effect. The staff noted that these substantial shifts could mask the effects of ongoing balance sheet runoff on money market conditions and pose challenges in assessing reserve conditions.
By unanimous vote, the Committee ratified the Desk's domestic transactions over the intermeeting period. There were no intervention operations in foreign currencies for the System's account during the intermeeting period.
Staff Review of the Economic Situation
The information available at the time of the meeting indicated that real gross domestic product (GDP) had expanded solidly so far this year. The pace of job gains had moderated since the beginning of the year, and the unemployment rate had moved up, on net, but remained low. Consumer price inflation was well below its year-earlier pace.
Consumer price inflation—as measured by the 12-month change in the price index for personal consumption expenditures (PCE)—had moved lower in August and September. Total PCE price inflation was 2.1 percent in September, and core PCE price inflation—which excludes changes in energy prices and many consumer food prices—was 2.7 percent.
Recent data suggested that labor market conditions remained solid. Average monthly nonfarm payroll gains in the third quarter were similar to those seen in the second quarter. October job gains were held down noticeably by the effects of strikes and hurricanes. The unemployment rate had edged down slightly since August and was 4.1 percent in October; the labor force participation rate also ticked down over this period, and the employment-to-population ratio was unchanged on net. The unemployment rates for African Americans and for Hispanics moved down; both rates were above those for Asians and for Whites. The ratio of job vacancies to unemployment was 1.1 in October, slightly lower than its level just before the pandemic. Average hourly earnings for all employees rose 4 percent over the 12 months ending in October, down 0.3 percentage point relative to a year earlier, and the 12-month change in the employment cost index of hourly compensation for private industry workers was 3.6 percent in September, down 0.7 percentage point from its year-earlier pace.
According to the advance release, real GDP posted a solid gain in the third quarter that was similar to its second-quarter pace. Real private domestic final purchases—which comprises PCE and private fixed investment and which often provides a better signal than GDP of underlying economic momentum—rose slightly faster than real GDP in the third quarter. Net exports were a drag on third-quarter real GDP growth, as a brisk rise in exports was outpaced by even faster import growth.
Real GDP growth in foreign economies picked up somewhat in the third quarter, including in the euro area and, especially, Mexico. In China, growth also firmed in the third quarter, and there were signs that recent fiscal stimulus measures were starting to shore up confidence. That said, more recent indicators, such as purchasing managers indexes (PMIs), continued to suggest ongoing weakness in foreign manufacturing, in part due to monetary policies still being restrictive.
Inflation abroad continued to ease. In the advanced AFEs excluding Japan, 12-month headline inflation slowed to near or below target levels, mainly reflecting the rapid pass-through of lower energy prices earlier this year. At the same time, services inflation remained high in these economies. In China, core inflation fell to its lowest level since the Global Financial Crisis. By contrast, in some Latin American countries, notably Brazil, inflation increased, partly because of renewed food price pressures.
Many foreign central banks eased policy during the intermeeting period, including the Bank of Canada and the European Central Bank among the AFEs and the central banks of Colombia, Mexico, Korea, the Philippines, and Thailand among the emerging market economies.
Staff Review of the Financial Situation
The expected path of the federal funds rate implied by financial market quotes increased notably over the intermeeting period amid stronger-than-expected data releases pertaining to economic activity, somewhat higher-than-expected readings on inflation, and comments by some FOMC participants that were interpreted as signaling a more gradual approach to recalibrating the stance of monetary policy. Consistent with a higher expected path of the federal funds rate and a shift in investors' perceptions of the balance of risks, nominal Treasury yields across the maturity spectrum increased significantly. The increase in longer-term yields appeared to be mostly attributable to higher term premiums—consistent with investors' perceived shift in the balance of risks away from outcomes characterized by slower real GDP growth and lower inflation. Market-based measures of inflation compensation moved up over the period from relatively low levels, while survey-based measures of longer-term inflation expectations were little changed. These measures continued to suggest an expectation that inflation would return over time to the Committee's 2 percent objective.
Despite higher yields, and amid greater confidence about the growth outlook and somewhat better-than-expected corporate earnings reports, broad equity price indexes increased notably, on net, over the intermeeting period, and credit spreads for both corporate and municipal bonds narrowed. The VIX rose appreciably, reportedly reflecting uncertainty about the outcome of the U.S. presidential election and escalating tensions in the Middle East. However, it subsequently more than retraced those increases, ending the period moderately lower and slightly below the median of its historical distribution.
Conditions in U.S. short-term funding markets remained generally stable over the intermeeting period, with the lowering of the target range for the federal funds rate in September fully passing through to both secured and unsecured reference rates. Rates in secured markets exhibited significant but temporary upward pressure around the September quarter-end, driven by typical quarter-end dynamics and a large net Treasury coupon settlement. Over the intermeeting period, government money market funds (MMFs) continued to increase allocations to Treasury bills and private repo in light of the generally favorable rates on these instruments; usage of the ON RRP facility declined significantly over the period.
Over the intermeeting period, foreign financial markets were driven by greater investor confidence in the U.S. economic outlook, foreign economic data releases, and political developments. Higher U.S. Treasury yields spilled over to foreign yields across the curve, though softer-than-expected inflation and PMI survey data weighed on short-term yields in the euro area. In the U.K., yields increased following the release of the new government's budget as market participants processed the budget's impact on projected inflation and gilt issuance. The broad dollar index increased significantly, as U.S. interest rates rose more than foreign rates. In China, the announcement of new policy stimulus measures boosted domestic risky asset prices, with limited spillovers to other markets; the announcements also drove notable flows into China-focused investment funds. Most European equity price indexes decreased somewhat, while Japanese and Canadian equity markets rose moderately.
In domestic credit markets, borrowing costs for households and most businesses rose over the intermeeting period from already elevated levels, primarily reflecting increases in longer-term Treasury yields. Rates on 30-year fixed-rate conforming residential mortgages rose, while interest rates on credit cards remained relatively unchanged at near historical highs. By contrast, interest rates on new auto loans edged down but remained elevated. Meanwhile, interest rates on commercial and industrial (C&I) loans and small business loans continued to be elevated. Yields also rose on an array of fixed-income securities, including commercial mortgage-backed securities (CMBS), investment- and speculative-grade corporate bonds, and residential mortgage-backed securities.
Over the intermeeting period, financing through capital markets and nonbank lenders remained broadly available for public corporations and for large and midsize private corporations. For smaller firms, however, credit availability remained relatively tight. In the October Senior Loan Officer Opinion Survey on Bank Lending Practices (SLOOS), banks, on net, reported maintaining their lending standards and most terms basically unchanged for C&I loans.2 Meanwhile, net growth in C&I loan balances remained subdued in August and September. With respect to commercial real estate (CRE) loans, banks in the October SLOOS reported, on balance, basically unchanged lending standards for all categories of CRE loans, the first survey since early 2022 in which standards on CRE loans of every category have not tightened. Bank CRE loan balances were flat in the third quarter, partly reflecting lending standards staying on the tighter end of the range prevailing since 2005.
Credit remained available for most consumers, although consumer credit availability continued to tighten moderately through September. Credit card balances expanded modestly in the third quarter, while auto credit growth continued to slow through August. In the October SLOOS, respondents, on net, indicated that standards for credit cards tightened, but most of them reported no change in lending standards for auto loans. Access to credit in the residential mortgage market was little changed, on balance, and continued to depend on borrowers' credit risk attributes. In the October SLOOS, banks, on net, moderately eased residential lending standards.
Credit quality remained solid in the cases of large and midsize firms, most home mortgage borrowers, and municipalities, but it continued to deteriorate in other sectors. The credit quality of nonfinancial firms borrowing in the corporate bond and leveraged loan markets remained stable. Delinquency rates on loans to small businesses remained modestly above pre-pandemic levels. Credit quality in the CRE market deteriorated further, with the average delinquency rate on loans in CMBS pools rising further in September, driven largely by office loans. Regarding household credit quality, delinquency rates on most residential mortgages were largely unchanged in September at about their historical low. Delinquency rates for credit cards increased a bit further in the third quarter, while delinquency rates on auto loans inched down.
The staff provided an update on its assessment of the stability of the U.S. financial system and, on balance, continued to characterize the system's financial vulnerabilities as notable. The staff judged that asset valuation pressures were elevated, with estimates of risk premiums across key markets low by historical standards. House prices remained elevated relative to fundamentals such as rents. Although the pace of decline in CRE prices slowed, fundamentals continued to deteriorate across multiple categories.
Vulnerabilities associated with business and household debt were characterized as moderate. Nonfinancial business leverage was elevated by historical standards, but the ability of publicly traded firms to service their debt remained strong, supported by robust earnings and the low interest rates that firms continued to enjoy on the portion of fixed-rate debt issued early in the pandemic. That said, the fraction of private firm debt having very low interest coverage ratios continued to increase, pointing to further deterioration in the balance sheets of riskier firms. Household balance sheets remained solid overall, as aggregate home equity remained high and delinquencies on mortgage loans continued to be low.
Vulnerabilities associated with leverage in the financial sector were characterized as notable. Regulatory capital ratios in the banking sector remained high; however, banks continued to hold large quantities of long-duration assets, leaving them more exposed than usual to an unexpected rise in longer-term interest rates. In the nonbank sector, leverage at hedge funds remained high, partly on account of the prevalence of the Treasury cash–futures basis trade. Life insurers' leverage remained somewhat elevated, and they continued to maintain large holdings of risky and illiquid securities. By contrast, broker-dealer leverage remained low, as their capital increased in line with their assets. Vulnerabilities associated with funding risks were also characterized as notable. Assets in prime MMFs and other runnable cash-management vehicles remained near historical highs. Life insurers' greater reliance on nontraditional liabilities suggested that adverse shocks to the industry could trigger substantial funding pressures at these firms.
Staff Economic Outlook
The staff forecast at the November meeting called for economic conditions to remain solid. Relative to September, the real GDP growth projection for 2024 as a whole was higher, reflecting stronger-than-expected spending and labor market indicators. The staff had revised up their assessment of potential output growth in light of the upward revisions to productivity implied by the recent annual update of the national income and product accounts. From 2025 to 2027, real GDP growth was expected to be slightly slower than potential output growth, resulting in a very small increase in the unemployment rate.
The staff's inflation forecast for 2024 was slightly higher than the one prepared for the previous meeting, reflecting incoming data. Thereafter, the outlook was similar to the previous projection: Both total and core PCE price inflation were expected to decline further as supply and demand in labor and product markets continued to move into better balance; by 2026, total and core inflation were expected to be 2 percent.
The staff continued to view the uncertainty around the baseline projection as close to the average over the past 20 years. The staff had reduced its assessment of the downward risks to the baseline forecast for economic activity in light of incoming data. Nevertheless, the staff judged that these risks were somewhat skewed to the downside: Although current labor market conditions remained solid, it was possible that the easing in the labor market seen over the past two years could give way to a more pronounced slowdown in economic activity. The risks around the inflation forecast were seen as roughly balanced.
Participants' Views on Current Conditions and the Economic Outlook
In their discussion of inflation developments, participants continued to observe that inflation had eased substantially from its peak, although core inflation remained somewhat elevated. Almost all participants judged that, though month-to-month movements would remain volatile, incoming data generally remained consistent with inflation returning sustainably to 2 percent. Participants commented that disinflationary progress had been seen across a broad range of core goods and services prices. Notably, in both the core goods and nonhousing services categories, prices were now increasing at rates close to those seen during earlier periods of price stability. Many participants noted that the slowing in these components of core inflation corroborated reports received from their business contacts that firms were more reluctant to increase prices, as consumers appeared to be more price sensitive and were increasingly seeking discounts. Some participants remarked that although increases in housing services prices remained somewhat elevated, they continued to expect that these increases would slow, as the more subdued pace of rent increases faced by new tenants would eventually be reflected further in housing services prices.
With regard to the outlook for inflation, participants indicated that they remained confident that inflation was moving sustainably toward 2 percent, although a couple noted the possibility that the process could take longer than previously expected. A few participants remarked that insofar as recent robust increases in real GDP reflected favorable supply developments, the strength of economic activity was unlikely to be a source of upward inflation pressures. Participants cited various factors likely to put continuing downward pressure on inflation, including waning business pricing power, the Committee's still-restrictive monetary policy stance, and well-anchored longer-term inflation expectations. Several participants noted that nominal wage growth had continued to move down and that the wage premium available to job switchers had diminished. In addition, some participants observed that, with supply and demand in the labor market being roughly in balance and in light of recent productivity gains, wage increases were unlikely to be a source of inflationary pressure in the near future.
In discussing labor market developments, participants generally viewed recent readings as consistent with labor market conditions remaining solid, although labor strikes and the devastating hurricanes had been important sources of temporary fluctuations in the employment data. Participants continued to cite declines in job vacancies, the quits rate, and turnover as consistent with a gradual easing in labor demand. Some participants reported that businesses were becoming more selective in hiring as they faced larger pools of more qualified job applicants, and job applicants were more willing to accept less accommodative work arrangements and more moderate wage offers. Participants generally noted, however, that there was no sign of rapid deterioration in labor market conditions, with layoffs remaining low. A few participants cited business contacts who were using attrition, instead of layoffs, to manage the size of their workforce. Some participants observed that the evaluation of underlying trends in labor market developments had continued to be challenging— with difficulties in measuring the effects of immigration on labor supply, revisions to data, and the effects of natural disasters and labor strikes among the factors cited as complicating this evaluation—and that assessments of the outlook for the labor market were associated with considerable uncertainty. Participants generally judged that current labor market conditions were broadly consistent with the Committee's longer-run goal of maximum employment.
With regard to the outlook for the labor market, participants generally anticipated that with an appropriate recalibration of the Committee's monetary policy stance over time, the labor market would remain solid. Participants generally agreed that labor market indicators merited close monitoring. Some participants still saw elevated risks that the labor market could deteriorate, though many participants saw the risk of an excessive cooling in the labor market as having diminished somewhat since the Committee's September meeting.
Participants observed that recent data on economic activity and consumer spending were largely stronger than anticipated, and they assessed that economic activity had continued to expand at a solid pace and consumer spending remained strong. Participants remarked that consumption had been supported by a solid labor market, rising real wages, and elevated household wealth. Many participants observed that recent upward revisions in data on household income and the saving rate had made these series' behavior more consistent with the strength in consumer spending. However, several participants cautioned that low- and moderate-income households continued to experience financial strains, which could damp their spending. A couple of participants cited recent increases in rates of delinquencies on credit card borrowing and automobile loans as signs of such strains.
Regarding the business sector, a few participants noted that favorable aggregate supply developments—including increases in labor supply, business investment, and productivity—continued to support solid expansion of business activity. A couple of participants remarked that there was considerable uncertainty about the durability of recent rates of increase in productivity. Although a few participants attributed some of the productivity gains to potentially transitory factors—such as one-time efficiency gains in response to earlier labor shortages—or the possible underestimation of labor inputs, some participants highlighted more durable factors, such as new business formation and investment, as well as the integration into the workplace of technological advances. A couple of participants discussed some of these recent trends, noting especially possible implications of the expanded use of artificial intelligence in the workplace. Several participants indicated that their District contacts reported larger corporations and firms in sectors like financial services, construction, professional services, and technology as having a generally more optimistic outlook than smaller businesses or firms in the manufacturing sector. Several participants remarked that the agricultural sector continued to face significant strains due to low crop prices and high input costs.
In participants' evaluation of the risks and uncertainties associated with the economic outlook, upside risks to the inflation outlook were seen as little changed, while downside risks to employment and growth were seen as having decreased somewhat. Among the upside risks to inflation cited by participants were the possibility of sudden disruptions in global supply chains due to geopolitical developments, a larger-than-anticipated easing in financial conditions, stronger-than-expected consumption, more-persistent shelter price increases, or sharp rises in insurance charges for health, autos, or homes. Some participants pointed to various downside risks to economic activity and employment, including weaker global growth, sharply worsening financing conditions due to an escalation of geopolitical tensions or a sizable asset price correction, or an unwelcome weakening of the labor market. Almost all participants judged the risks to the attainment of their dual-mandate objectives of maximum employment and price stability to be roughly in balance.
In their discussion of financial stability, participants who commented noted vulnerabilities to the financial system that they assessed warranted monitoring. A couple of participants observed that the banking system was sound but that there continued to be potential risks associated with unrealized losses on bank assets. Many participants discussed vulnerabilities associated with CRE exposures, focusing on risks in the office sector. A few of these participants noted signs that the deterioration of conditions in this sector of the CRE market might be lessening. A couple of participants noted concerns about asset valuation pressures in other markets. Some participants commented on cyber risks that could impair the operation of financial institutions, financial infrastructure, and, potentially, the overall economy; these participants noted, in particular, vulnerabilities that could emanate from third-party service providers. A couple of participants also mentioned third-party service providers in the context of risks associated with brokered and reciprocal deposit arrangements. Several participants noted that leverage in the market for Treasury securities remained a risk and commented that it would be important to monitor developments regarding the market's resilience. A few participants discussed vulnerabilities posed by the growth of private credit and potential links to banks and other financial institutions. A couple of participants commented on the financial condition of low- and moderate-income households that have exhausted their savings and the importance of monitoring rising delinquency rates on credit cards and auto loans. A couple of participants remarked on the successful implementation of the Securities and Exchange Commission's money fund rules, noting that it would reduce financial stability risks posed by domestic MMFs.
In their consideration of monetary policy at this meeting, participants noted that inflation had made progress toward the Committee's objective but remained somewhat elevated. Participants also observed that recent indicators suggested that economic activity had continued to expand at a solid pace, labor market conditions had generally eased since earlier in the year, and the unemployment rate had moved up but remained low. Almost all participants judged that the risks to achieving the Committee's employment and inflation goals were roughly in balance. In support of the Committee's goals, all participants viewed it as appropriate to lower the target range for the federal funds rate by 25 basis points to 4-1/2 to 4-3/4 percent. Participants observed that such a further recalibration of the monetary policy stance would help maintain the strength in the economy and the labor market while continuing to enable further progress on inflation. Participants judged that it was appropriate to continue the process of reducing the Federal Reserve's securities holdings.
In discussing the outlook for monetary policy, participants anticipated that if the data came in about as expected, with inflation continuing to move down sustainably to 2 percent and the economy remaining near maximum employment, it would likely be appropriate to move gradually toward a more neutral stance of policy over time. Participants noted that monetary policy decisions were not on a preset course and were conditional on the evolution of the economy and the implications for the economic outlook and the balance of risks; they stressed that it would be important for the Committee to make this clear as it adjusted its policy stance. While emphasizing that monetary policy would be data dependent, many participants noted the volatility of recent economic data and highlighted the importance of focusing on underlying economic trends and the evolution of the outlook when assessing incoming information. Some participants remarked that, at a future meeting, there would be value in the Committee considering a technical adjustment to the rate offered at the ON RRP facility to set the rate equal to the bottom of the target range for the federal funds rate, thereby bringing the rate back into an alignment that had existed when the facility was established as a monetary policy tool.
In discussing risk-management considerations that could bear on the outlook for monetary policy, almost all participants agreed that risks to achieving the Committee's employment and inflation goals remained roughly in balance. Some participants judged that downside risks to economic activity or the labor market had diminished. Participants noted that monetary policy would need to balance the risks of easing policy too quickly, thereby possibly hindering further progress on inflation, with the risks of easing policy too slowly, thereby unduly weakening economic activity and employment. In discussing the positioning of monetary policy in response to potential changes in the balance of risks, some participants noted that the Committee could pause its easing of the policy rate and hold it at a restrictive level if inflation remained elevated, and some remarked that policy easing could be accelerated if the labor market turned down or economic activity faltered. Many participants observed that uncertainties concerning the level of the neutral rate of interest complicated the assessment of the degree of restrictiveness of monetary policy and, in their view, made it appropriate to reduce policy restraint gradually.
Committee Policy Actions
In their discussions of monetary policy for this meeting, members agreed that economic activity had continued to expand at a solid pace. Labor market conditions had generally eased since earlier in the year, and the unemployment rate had moved up but remained low. Members concurred that inflation had made progress toward the Committee's 2 percent inflation objective but that inflation remained somewhat elevated. In discussing the Committee's statement, members agreed that it was appropriate to omit the previous reference to their greater confidence that inflation was moving sustainably toward 2 percent, as this language had been specifically associated with the commencement of policy easing in September and therefore was no longer needed. Almost all members agreed that the risks to achieving the Committee's employment and inflation goals were roughly in balance. Members viewed the economic outlook as uncertain and agreed that they were attentive to the risks to both sides of the Committee's dual mandate.
In support of its goals, the Committee decided to lower the target range for the federal funds rate by 25 basis points to 4-1/2 to 4-3/4 percent. Members concurred that, in considering additional adjustments to the target range for the federal funds rate, they would carefully assess incoming data, the evolving outlook, and the balance of risks. Members agreed to continue to reduce the Federal Reserve's holdings of Treasury securities and agency debt and agency mortgage-backed securities. All members agreed that the postmeeting statement should affirm their strong commitment both to supporting maximum employment and to returning inflation to the Committee's 2 percent objective.
Members agreed that, in assessing the appropriate stance of monetary policy, they would continue to monitor the implications of incoming information for the economic outlook. They would be prepared to adjust the stance of monetary policy as appropriate if risks emerged that could impede the attainment of the Committee's goals. Members also agreed that their assessments would take into account a wide range of information, including readings on labor market conditions, inflation pressures and inflation expectations, and financial and international developments.
At the conclusion of the discussion, the Committee voted to direct the Federal Reserve Bank of New York, until instructed otherwise, to execute transactions in the System Open Market Account in accordance with the following domestic policy directive, for release at 2:00 p.m.:
"Effective November 8, 2024, the Federal Open Market Committee directs the Desk to:
- Undertake open market operations as necessary to maintain the federal funds rate in a target range of 4-1/2 to 4-3/4 percent.
- Conduct standing overnight repurchase agreement operations with a minimum bid rate of 4.75 percent and with an aggregate operation limit of $500 billion.
- Conduct standing overnight reverse repurchase agreement operations at an offering rate of 4.55 percent and with a per-counterparty limit of $160 billion per day.
- Roll over at auction the amount of principal payments from the Federal Reserve's holdings of Treasury securities maturing in each calendar month that exceeds a cap of $25 billion per month. Redeem Treasury coupon securities up to this monthly cap and Treasury bills to the extent that coupon principal payments are less than the monthly cap.
- Reinvest the amount of principal payments from the Federal Reserve's holdings of agency debt and agency mortgage‑backed securities (MBS) received in each calendar month that exceeds a cap of $35 billion per month into Treasury securities to roughly match the maturity composition of Treasury securities outstanding.
- Allow modest deviations from stated amounts for reinvestments, if needed for operational reasons.
- Engage in dollar roll and coupon swap transactions as necessary to facilitate settlement of the Federal Reserve's agency MBS transactions."
The vote also encompassed approval of the statement below for release at 2:00 p.m.:
"Recent indicators suggest that economic activity has continued to expand at a solid pace. Since earlier in the year, labor market conditions have generally eased, and the unemployment rate has moved up but remains low. Inflation has made progress toward the Committee's 2 percent objective but remains somewhat elevated.
The Committee seeks to achieve maximum employment and inflation at the rate of 2 percent over the longer run. The Committee judges that the risks to achieving its employment and inflation goals are roughly in balance. The economic outlook is uncertain, and the Committee is attentive to the risks to both sides of its dual mandate.
In support of its goals, the Committee decided to lower the target range for the federal funds rate by 1/4 percentage point to 4-1/2 to 4-3/4 percent. In considering additional adjustments to the target range for the federal funds rate, the Committee will carefully assess incoming data, the evolving outlook, and the balance of risks. The Committee will continue reducing its holdings of Treasury securities and agency debt and agency mortgage‑backed securities. The Committee is strongly committed to supporting maximum employment and returning inflation to its 2 percent objective.
In assessing the appropriate stance of monetary policy, the Committee will continue to monitor the implications of incoming information for the economic outlook. The Committee would be prepared to adjust the stance of monetary policy as appropriate if risks emerge that could impede the attainment of the Committee's goals. The Committee's assessments will take into account a wide range of information, including readings on labor market conditions, inflation pressures and inflation expectations, and financial and international developments."
Voting for this action:Jerome H. Powell, John C. Williams, Thomas I. Barkin, Michael S. Barr, Raphael W. Bostic, Michelle W. Bowman, Lisa D. Cook, Mary C. Daly, Beth M. Hammack, Philip N. Jefferson, Adriana D. Kugler, and Christopher J. Waller.
Voting against this action: None.
Consistent with the Committee's decision to lower the target range for the federal funds rate to 4-1/2 to 4-3/4 percent, the Board of Governors of the Federal Reserve System voted unanimously to lower the interest rate paid on reserve balances to 4.65 percent, effective November 8, 2024. The Board of Governors of the Federal Reserve System voted unanimously to approve a 1/4 percentage point decrease in the primary credit rate to 4.75 percent, effective November 8, 2024.3
It was agreed that the next meeting of the Committee would be held on Tuesday–Wednesday, December 17–18, 2024. The meeting adjourned at 10:20 a.m. on November 7, 2024.
Notation Vote
By notation vote completed on October 8, 2024, the Committee unanimously approved the minutes of the Committee meeting held on September 17–18, 2024.
Attendance
Jerome H. Powell, Chair
John C. Williams, Vice Chair
Thomas I. Barkin
Michael S. Barr
Raphael W. Bostic
Michelle W. Bowman
Lisa D. Cook
Mary C. Daly
Beth M. Hammack
Philip N. Jefferson
Adriana D. Kugler
Christopher J. Waller
Susan M. Collins, Austan D. Goolsbee, Alberto G. Musalem, and Jeffrey R. Schmid, Alternate Members of the Committee
Patrick Harker, Neel Kashkari, and Lorie K. Logan, Presidents of the Federal Reserve Banks of Philadelphia, Minneapolis, and Dallas, respectively
Matthew M. Luecke, Deputy Secretary
Brian J. Bonis, Assistant Secretary
Michelle A. Smith, Assistant Secretary
Mark E. Van Der Weide, General Counsel
Richard Ostrander, Deputy General Counsel
Trevor A. Reeve, Economist
Stacey Tevlin, Economist
Beth Anne Wilson, Economist
Shaghil Ahmed, James A. Clouse, Brian M. Doyle, Edward S. Knotek II, and William Wascher, Associate Economists
Roberto Perli, Manager, System Open Market Account
Julie Ann Remache, Deputy Manager, System Open Market Account
Stephanie R. Aaronson, Senior Associate Director, Division of Research and Statistics, Board
Jose Acosta, Senior System Engineer II, Division of Information Technology, Board
Andrea Ajello, Section Chief, Division of Monetary Affairs, Board
Gianni Amisano, Assistant Director, Division of Research and Statistics, Board
Sriya Anbil,4 Group Manager, Division of Monetary Affairs, Board
Roc Armenter, Executive Vice President, Federal Reserve Bank of Philadelphia
Alyssa Arute,5 Assistant Director, Division of Reserve Bank Operations and Payment Systems, Board
Alessandro Barbarino, Special Adviser to the Board, Division of Board Members, Board
David Bowman, Senior Associate Director, Division of Monetary Affairs, Board
Mark A. Carlson, Adviser, Division of Monetary Affairs, Board
Michele Cavallo, Special Adviser to the Board, Division of Board Members, Board
Kevin B. Clark,4 Capital Markets Trading Principal, Federal Reserve Bank of New York
Juan Carlos Climent, Special Adviser to the Board, Division of Board Members, Board
Stephanie E. Curcuru, Deputy Director, Division of International Finance, Board
Marco Del Negro, Economic Research Advisor, Federal Reserve Bank of New York
Andrew T. Foerster, Senior Research Advisor, Federal Reserve Bank of San Francisco
Jenn Gallagher, Assistant to the Board, Division of Board Members, Board
Peter M. Garavuso, Lead Information Manager, Division of Monetary Affairs, Board
Carlos Garriga, Senior Vice President, Federal Reserve Bank of St. Louis
Michael S. Gibson, Director, Division of Supervision and Regulation, Board
Jonathan E. Goldberg, Principal Economist, Division of Monetary Affairs, Board
Brian Gowen,4 Capital Markets Trading Principal, Federal Reserve Bank of New York
Joseph W. Gruber, Executive Vice President, Federal Reserve Bank of Kansas City
James Hebden, Principal Economic Modeler, Division of Monetary Affairs, Board
Valerie S. Hinojosa, Section Chief, Division of Monetary Affairs, Board
Jane E. Ihrig, Special Adviser to the Board, Division of Board Members, Board
Michael T. Kiley, Deputy Director, Division of Financial Stability, Board
Don H. Kim,4 Senior Adviser, Division of Monetary Affairs, Board
Kyungmin Kim,4 Principal Economist, Division of Monetary Affairs, Board
Elizabeth K. Kiser, Senior Associate Director, Division of Research and Statistics, Board
Anna R. Kovner, Executive Vice President, Federal Reserve Bank of Richmond
Andreas Lehnert, Director, Division of Financial Stability, Board
Kurt F. Lewis, Special Adviser to the Chair, Division of Board Members, Board
Dan Li, Assistant Director, Division of Monetary Affairs, Board
Laura Lipscomb, Special Adviser to the Board, Division of Board Members, Board
David López-Salido, Senior Associate Director, Division of Monetary Affairs, Board
Joshua S. Louria,4 Group Manager, Division of Monetary Affairs, Board
Byron Lutz, Deputy Associate Director, Division of Research and Statistics, Board
Benjamin W. McDonough, Deputy Secretary and Ombudsman, Office of the Secretary, Board
Ann E. Misback, Secretary, Office of the Secretary, Board
Linsey Molloy,4 Associate Director, Federal Reserve Bank of New York
Kevin B. Moore, Assistant Director, Division of Research and Statistics, Board
Kindra I. Morelock, Information Services Senior Analyst, Division of Monetary Affairs, Board, and Federal Reserve Bank of Chicago
Norman J. Morin, Associate Director, Division of Research and Statistics, Board
Michelle M. Neal, Head of Markets, Federal Reserve Bank of New York
Edward Nelson, Senior Adviser, Division of Monetary Affairs, Board
Marcelo Ochoa, Principal Economist, Division of Monetary Affairs, Board
Anna Paulson, Executive Vice President, Federal Reserve Bank of Chicago
Fabrizio Perri, Monetary Advisor, Federal Reserve Bank of Minneapolis
Eugenio P. Pinto, Special Adviser to the Board, Division of Board Members, Board
Andrea Prestipino, Principal Economist, Division of International Finance, Board
Odelle Quisumbing,4 Assistant to the Secretary, Office of the Secretary, Board
Christine Repper,5 Manager, Division of Reserve Bank Operations and Payment Systems, Board
Zeynep Senyuz,4 Deputy Associate Director, Division of Monetary Affairs, Board
Gustavo A. Suarez, Deputy Associate Director, Division of Research and Statistics, Board
Manjola Tase,4 Principal Economist, Division of Monetary Affairs, Board
Robert L. Triplett III, First Vice President, Federal Reserve Bank of Dallas
Clara Vega, Special Adviser to the Board, Division of Board Members, Board
Annette Vissing-Jørgensen, Senior Adviser, Division of Monetary Affairs, Board
Jeffrey D. Walker,5 Senior Associate Director, Division of Reserve Bank Operations and Payment Systems, Board
Jonathan Willis, Vice President, Federal Reserve Bank of Atlanta
Paul R. Wood, Special Adviser to the Board, Division of Board Members, Board
Egon Zakrajsek, Executive Vice President, Federal Reserve Bank of Boston
Rebecca Zarutskie, Senior Vice President, Federal Reserve Bank of Dallas
_______________________
Joshua Gallin
Secretary
1. The Federal Open Market Committee is referenced as the "FOMC" and the "Committee" in these minutes; the Board of Governors of the Federal Reserve System is referenced as the "Board" in these minutes. Return to text
2. The SLOOS results reported are based on banks' responses, weighted by each bank's outstanding loans in the respective loan category, and might therefore differ from the results reported in the published SLOOS, which are based on banks' unweighted responses. Return to text
3. In taking this action, the Board approved requests to establish that rate submitted by the Board of Directors of the Federal Reserve Banks of Boston, New York, Philadelphia, Cleveland, Richmond, Atlanta, Chicago, Minneapolis, Dallas, and San Francisco. The vote also encompassed approval by the Board of Governors of the establishment of a 4.75 percent primary credit rate by the remaining Federal Reserve Banks, effective on November 8, 2024, or the date such Reserve Banks inform the Secretary of the Board of such a request. (Secretary's note: Subsequently, the Federal Reserve Banks of St. Louis and Kansas City were informed of the Board's approval of their establishment of a primary credit rate of 4.75 percent, effective November 8, 2024.) Return to text
4. Attended through the discussion of developments in financial markets and open market operations. Return to text
5. Attended Tuesday's session only. Return to text
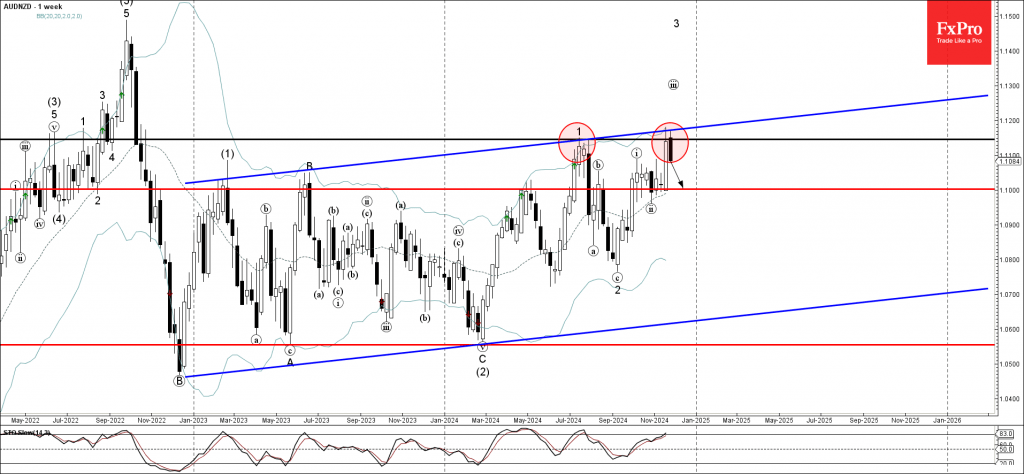
AUDNZD Wave Analysis
- AUDNZD reversed from resistance zone
- Likely to fall to support level 1.1000
AUDNZD currency pair recently reversed down from resistance area located at the intersection of the resistance level 1.1145 (former top of the weekly impulse wave 1) and the upper weekly Bollinger Band.
This resistance area was further strengthened by the resistance trendline of the weekly up channel from the end of 2022.
Given the strength of the resistance level 1.1145 and other overbought weekly Stochastic, AUDNZD currency pair can be expected to fall to the next support level 1.1000.
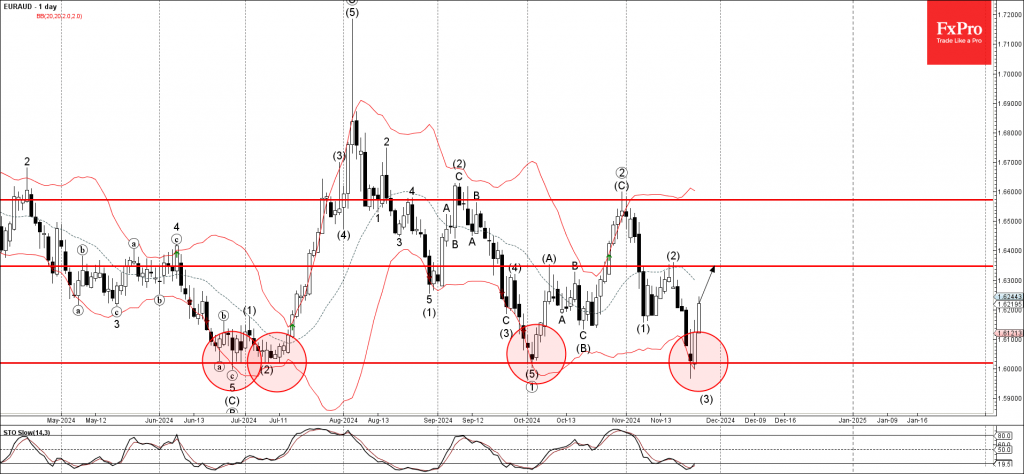
EURAUD Wave Analysis
- EURAUD reversed from support zone
- Likely to rise to resistance level 1.6350
EURAUD currency pair previously reversed from support area set between the pivotal support level 1.6020 (which has been reversing the pair from the end of June) and the lower daily Bollinger Band.
The upward reversal from this support zone created the daily Japanese candlesticks reversal pattern Morning Star Doji.
Given the oversold daily Stochastic, EURAUD currency pair can be expected to rise further to the next resistance level 1.6350 (top of the previous wave (2)).
Loonie’s Turbulent Times Have Just Begun
The Canadian dollar collapsed by more than 1.4% against the US dollar after Trump threatened to impose new 25% tariffs on goods from Mexico and Canada and to increase tariffs on China by 10% immediately after taking office.
Following the announcement, USDCAD jumped to 1.4170, a high since 23 April 2020. The context is interesting in this case, as a few days earlier, the price of oil went into negative territory for the first time in history. Previously, the highest price of the pair was recorded in early 2016, when oil fell below $30. So, these were periods of extremely low oil prices compared to current oil prices.
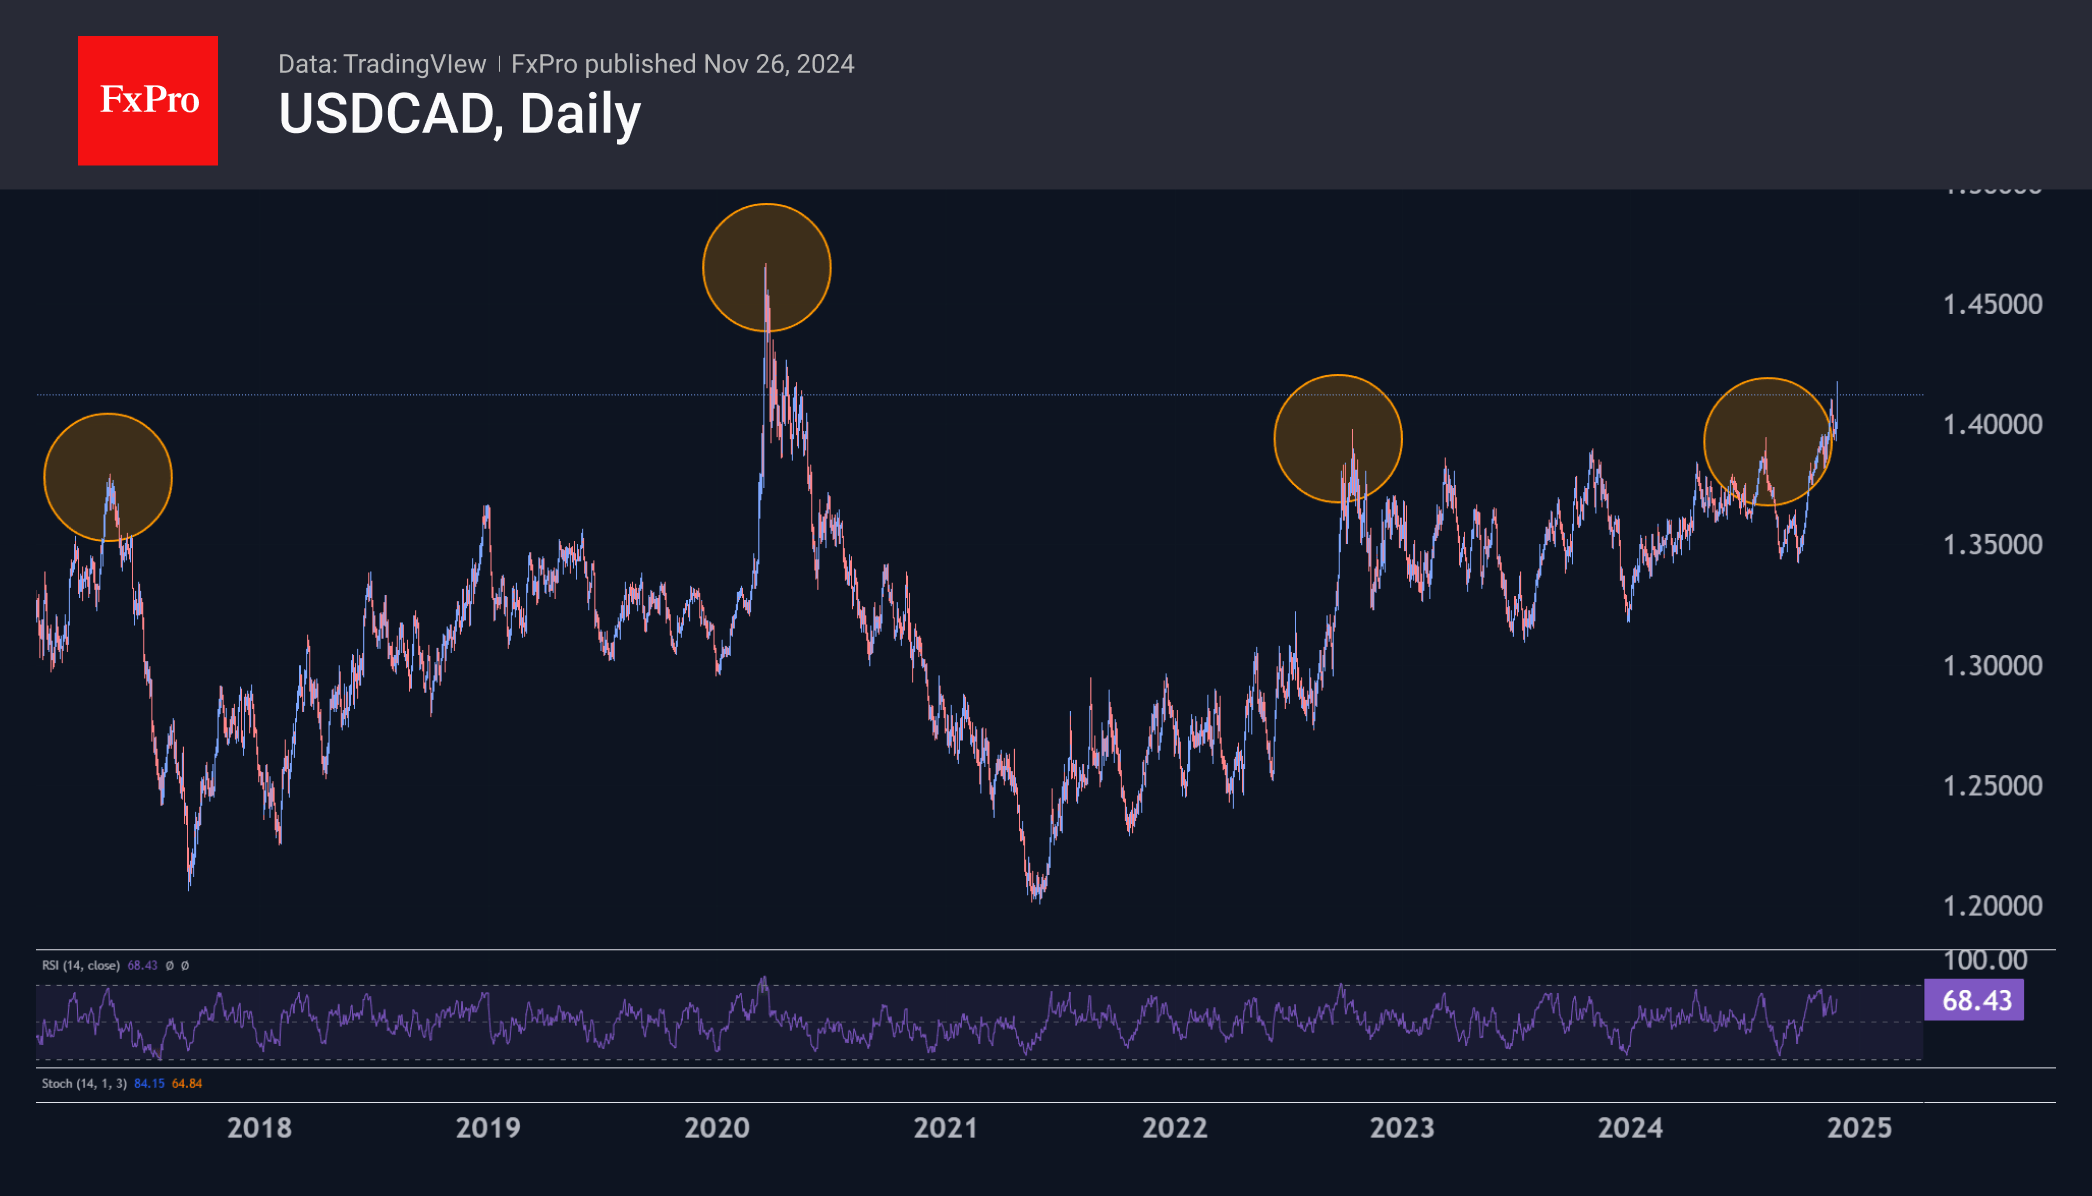
Over the past 20 years, USDCAD has only reached these levels during periods of turbulence, trading above 1.4100 for only a few dozen days cumulatively in the two episodes of 2016 and 2020. However, the phrase “period of turbulence” could well apply to the currency market for much of the Trump presidency, with sudden announcements and outbursts which are then dramatically reversed by periods of warming and de-escalation.
Historically, the Canadian dollar depreciated steadily against the US dollar between 1997 and 2003. This was also due to a period of extremely low energy prices caused by rising supply and the Asian crisis.
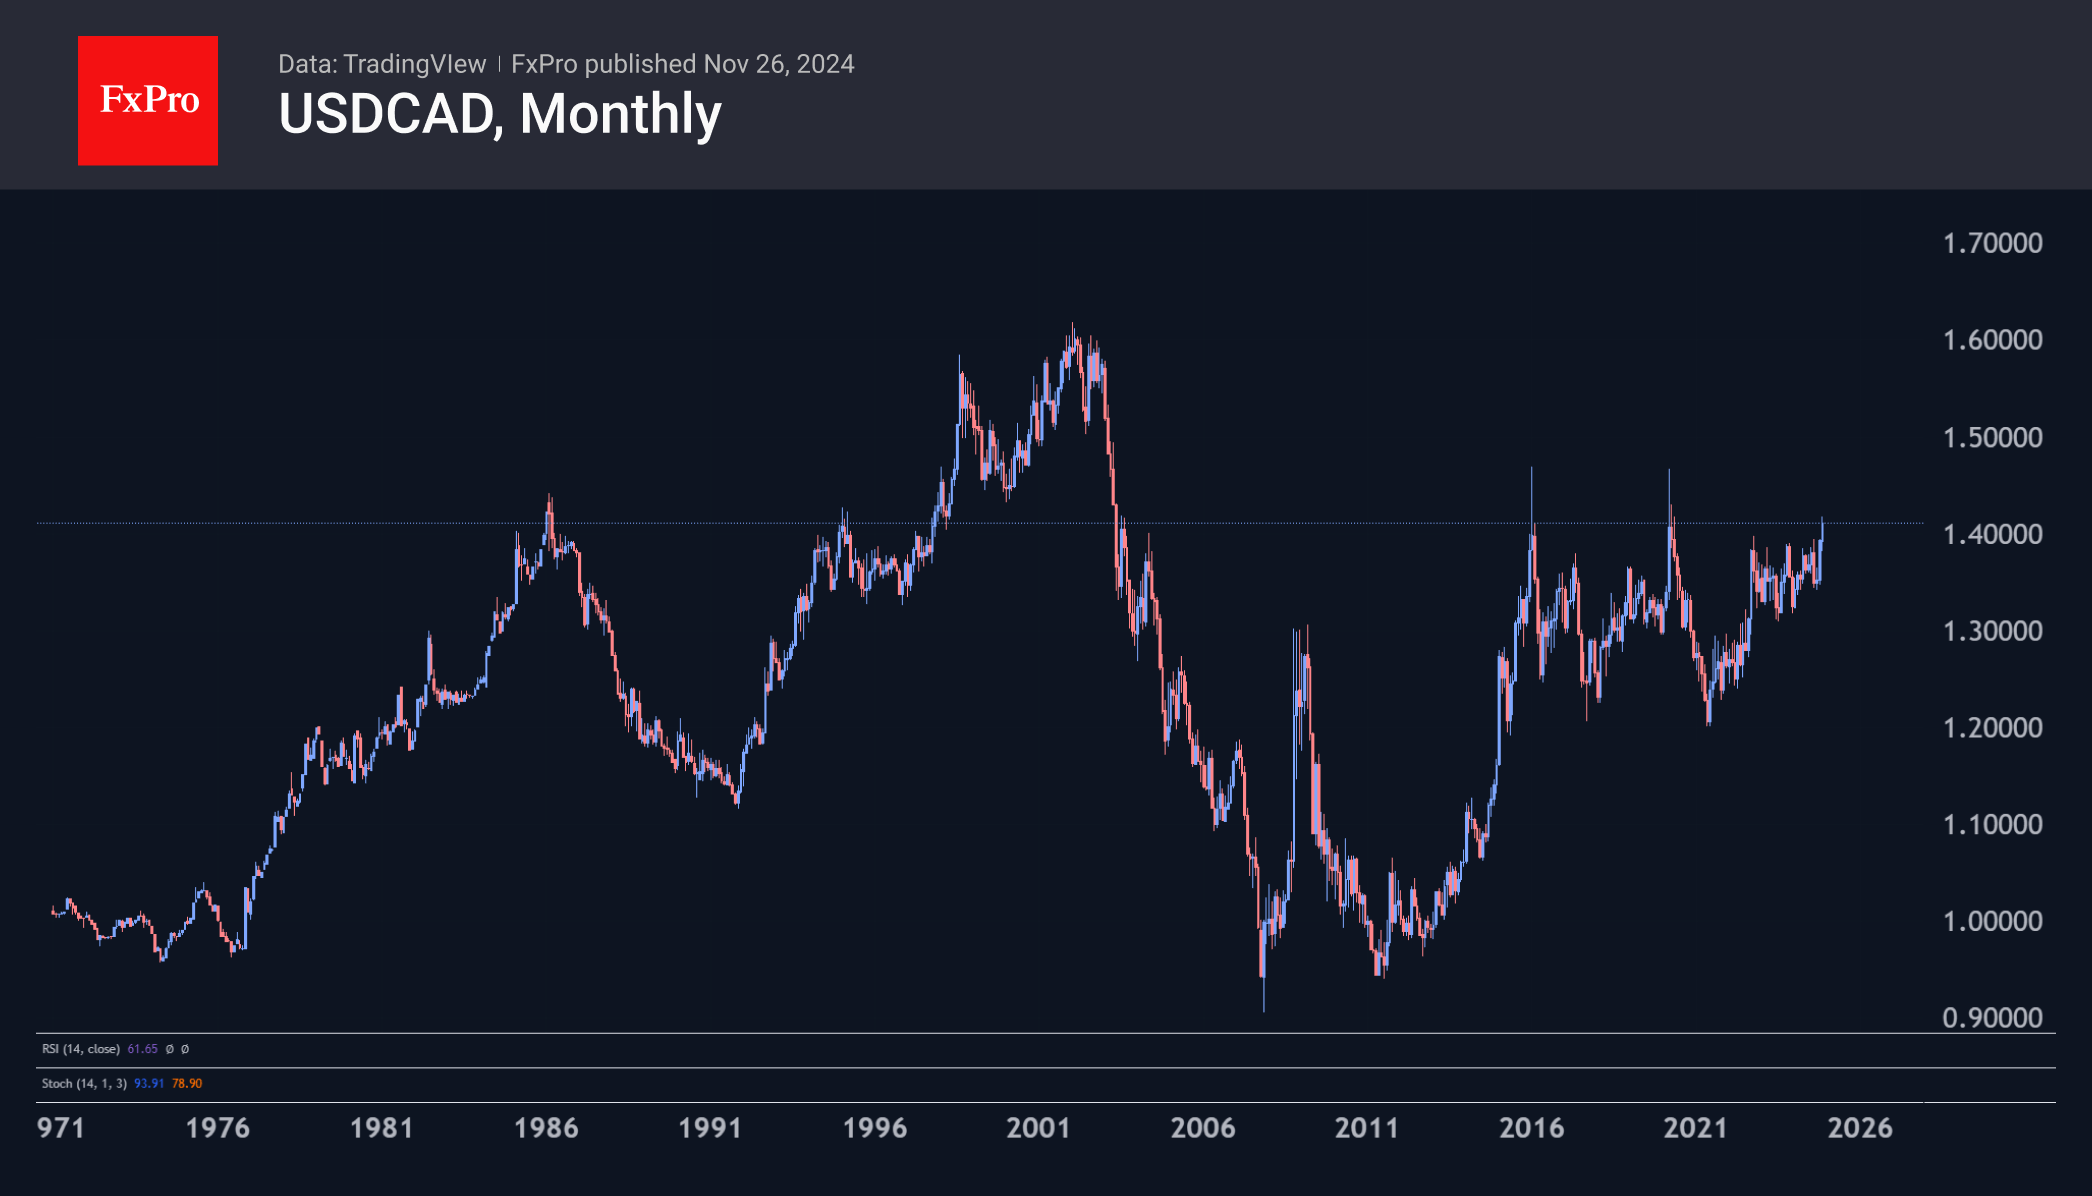
USDCAD has now reached levels above 1.4000, with oil prices much more comfortable. A further fall in ‘liquid gold’ prices could be the anchor that pulls the Canadian Loonie down. However, there is a positive side to this relationship: the Republican Party often supports the interests of companies involved in the production of conventional hydrocarbons.
Investors face a fork in the road here. The first path is to create the conditions for an increase in the price of oil. This could be done by increasing purchases into the Strategic Petroleum Reserve or by lobbying for the interests of US companies abroad through tariffs and sanctions.
The second way is to try to maximise overall profits by increasing production, the so-called “drill, baby, drill” that was so expected from Trump’s policy.
So far, we see more chances of the first scenario unfolding, which could be good news for the Canadian dollar in the long run. In the short term, however, the period of turbulence could continue, suggesting that the best time to open USDCAD shorts is yet to come.
On the daily timeframe, the pair is far from the overbought conditions that reversed the momentum earlier and could well slip into the 1.4500 area and higher before peaking.
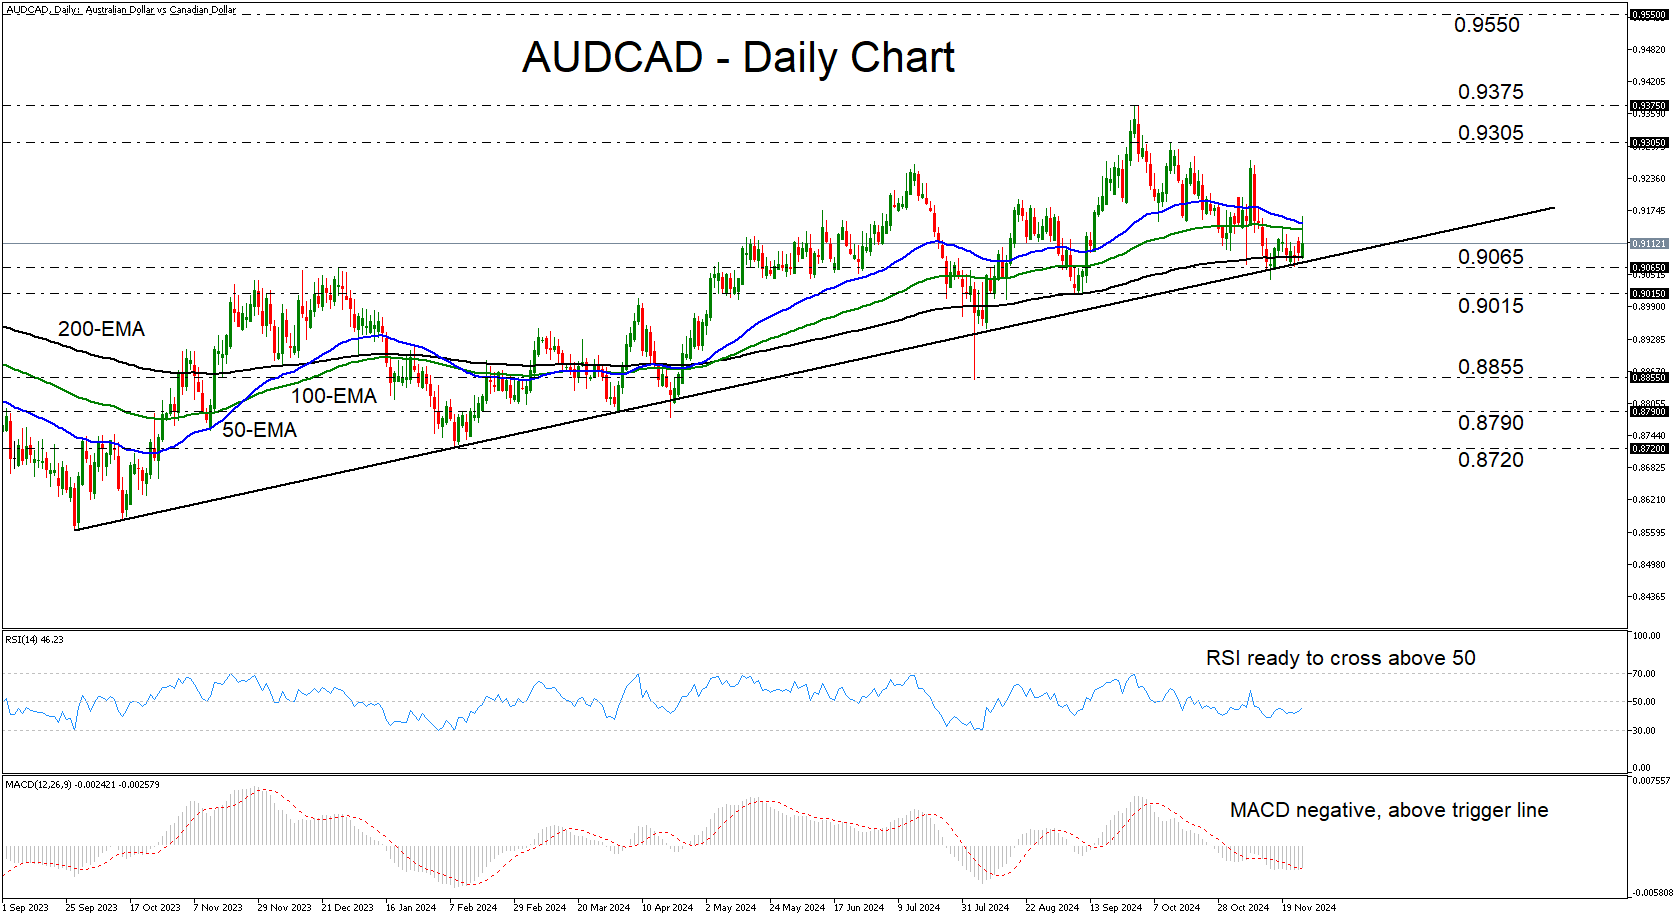
AUDCAD Rebounds from Near Key Uptrend Line
- AUDCAD rebounds after consolidating near key uptrend line
- RSI and MACD are suggesting that momentum may be turning positive
- A break above 50-day EMA could confirm more advances
- For the outlook to darken, a dip below 0.9015 may be needed
AUDCAD rebounded on Tuesday, after hitting support near the uptrend line drawn from the low of September 27, 2023, and the 200-day exponential moving average (EMA). Although the pair corrected decently after hitting a 21-month high of 0.9375 on September 30, the latest rebound keeps the broader uptrend intact.
The RSI and the MACD support the case for some more advances in the short run. The former has turned up and looks ready to cross above 50, while the latter, although negative, has already crossed above its trigger line.
If the bulls manage to climb above the 50-day EMA, they may feel confident to push the action towards the 0.9305 zone, or the 21-month high of 0.9375. That said, a break higher may be a stronger bullish signal as it would confirm a higher high on the weekly chart. Such a move could pave the way towards the 0.9550 zone, marked as resistance by the high of January 26, 2023.
For the outlook to turn bearish, the price may need to fall below 0.9015. Such a dip would not only solidify the break of the aforementioned uptrend line, but also confirm a lower low. The bears may then be encouraged to dive all the way down to the low of August 5 at 0.8855.
To recap, AUDCAD has been trading above a solid uptrend line since September 2023, and just this week, it rebounded after consolidating for a while near that zone. This keeps the broader outlook cautiously positive.
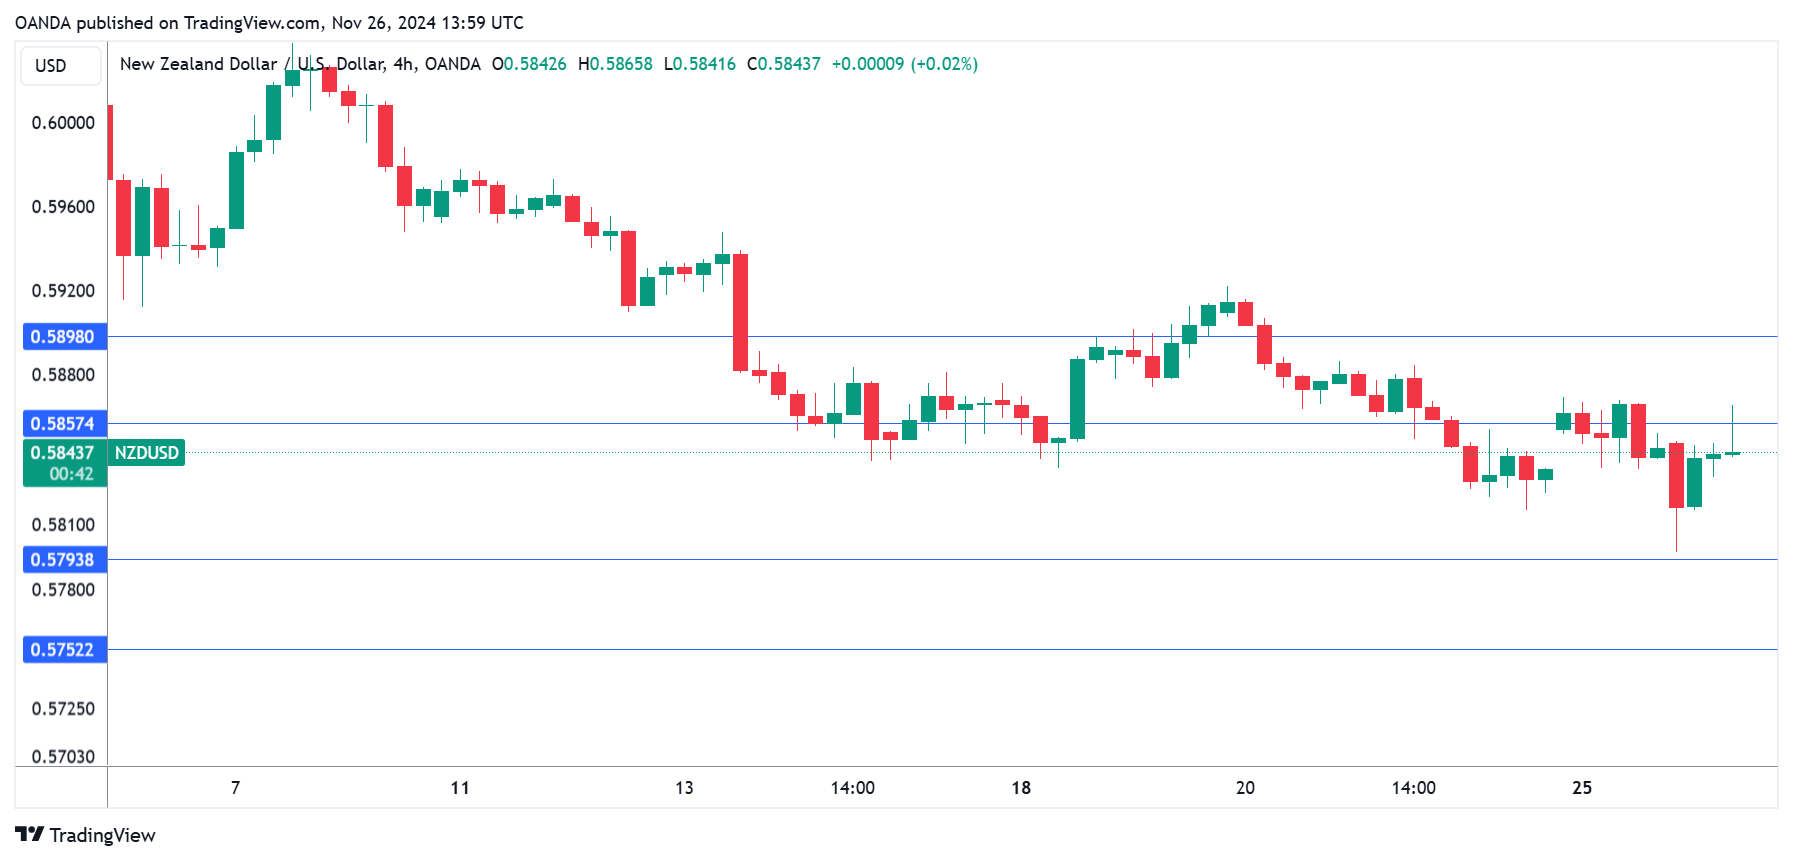
New Zealand Dollar Eyes RBNZ Rate Announcement
The New Zealand dollar is in positive territory on Tuesday, after a four-day losing streak. In the European session, NZD/USD is trading at 0.5850, up 0.09% on the day. Earlier, the New Zealand dollar fell as low as 0.5797, its lowest level since Nov. 1.
RBNZ expected to slash rates by 50 basis points
The Reserve Bank of New Zealand makes its rate announcement on Wednesday and the markets have priced in a jumbo rate cut of a 50 basis point for a second straight meeting. This would bring the cash rate to 4.25%, its lowest level since November 2022.
The RBNZ has done a good job of lowering inflation, which fell to 2.2% in the second quarter. This is the first time in over three years that inflation is within the target band of between 1 and 3 percent. Still, elevated rates have taken a heavy toll on the economy, as GDP declined 0.2% in the second quarter and likely fell in Q3 as well, which would mark a recession. The central bank’s aggressive rate-cutting is aimed at providing the economy with a much-needed boost.
The New Zealand dollar stands to be the big loser from an oversized rate cut. The currency plunged around 1% after the 50-bp chop in October and we could see another sharp drop on Wednesday if the central bank cuts again by 50 bp.
Will Fed minutes provide clues ahead of December meeting?
The Federal Reserve releases the minutes of the November meeting later today. At the meeting, the Fed lowered rates by 25 basis points. Investors will be looking for insights about what the Fed may have planned for the Dec. 18 meeting. A few weeks ago, a second straight 25-bp cut appeared likely but with the US economy remaining strong, the Fed may opt to pause. Interest-rate future markets are currently pricing in a cut at 59% and a pause at 41%, according to the CME’s Fed Watch.
NZD/USD Technical
- NZD/USD is testing resistance at 0.5857. Above, there is resistance at 0.5898
- There is support at 0.5793 and 0.5752
Sunset Market Commentary
Markets
This morning, (Asian) markets were ‘unsettled’ as US president-elect Trump via his ‘Truth’ social network announced additional tariffs on Canada and Mexico (25%) as he assesses they don’t do enough to stop what he calls the ‘invasion of drugs’ and ‘illegal aliens’ into the US. Also China will face an additional levy of 10% for not doing enough to stem the inflow of drugs and migrants to the US. At first instance, the announcement of these rather unexpected, basically non-economically driven tariffs firmly questioned yesterday’s market hope that the nomination Scott Bessent as US Treasury Secretary could be a harbinger of a more pragmatic approach from the Trump 2.0 administration. In a first reaction US yields and especially the dollar tried to reverse some of yesterday’s setback, but as was the case recently, the Trump trade (higher yields and higher dollar) failed to regain full momentum. US yields currently adds between 1.0/2.0 bps. In an interview on Bloomberg, Fed’s Kashkari indicated that tit-for-tat action on tariffs could be inflationary, but he still saw it reasonable to consider a December rate cut. Europe wasn’t directly affected by the Trump tariffs but he still has plenty of time to also reshape its trading relationship/practices with the EU. At least for now, further declines in EMU yields were limited. German currently show changes of less than 1 bp across the curve. European equities show most declines (EuroStoxx 50 -0.35%). US indices open mixed.
After finishing this report, the US consumer confidence (Conference Board) and the Minutes of the previous Fed meeting will be published. The US Treasury will sell $70 bln 5-y Notes.
On FX markets, the dollar failed to hold a brief ‘Trump-related’ spike higher at the opening. DYX trades little changed in a daily perspective (106.9) and this is also the case for EUR/USD (1.0495). The yen again outperforms with USD/JPY trading near 153.5 (from 154.23). The Canadian Loonie was hit the hardest by the Trump tariff announcement. USD/CAD is trading north of 1.41; at levels not seen since spring 2020. The Mexican peso (MXN) is also facing an uphill battle, but USD/MXN (20.583) for now holds just below the TYD top (20.8 area).
News & Views
Deputy governor of Sweden’s Riksbank Anna Seim touched on the topic of the neutral rate during a central bank seminar. Despite the inherent uncertainties associated with this theoretical construct, central banks use it as a gauge to help determine whether policy settings are either stimulative or restrictive. An update of the estimated level was due since the last one dated from 2017. Based on international studies, other central bank studies, pricing and surveys from financial markets and model-guesstimates, Seim concluded that “The long-term neutral interest rate, and thus the long-term normal policy rate, is probably between 1.5 and 3 per cent.” This is one percentage point lower than the 2017 range, meaning the Riksbank assumes it to remain near historically low levels. Seim’s message contrasts with the likes of the Bank of Canada, the Federal Reserve and the central bank of New Zealand. All of them raised their estimates. The deputy governor holds the view “that there is little to indicate that we are in a completely new world where the neutral interest rate has risen sharply, or will do so in the near future.” The implications for monetary policy are that policy rates around zero or even negative again cannot be ruled out in cases when inflation is far below target. Seim’s analysis paints a bleaker longer-term outlook for the Swedish krona as it offers the central quite some leeway to lower rates further from the current 2.75%. Money markets discount <100 bps of rate cuts over the next four meetings.
Hungary’s GKI business confidence index fell by more than 2 points in November to a 17-month low of -11.3. The outlook deteriorated in all four sectors surveyed, led by industry and construction. Trade remained the most pessimistic, services sector the least. The predictability of the business environment deteriorated to a 2-yr low. Price increase plans in the business sector increased noticeably compared to the previous month, rising to an 11-month high. The simultaneously published consumer confidence index decreased to a 12-month low on sharply increased dissatisfaction from households with their financial situation over the past 12 months. Views for the year ahead deteriorated somewhat, potentially on a significant uptick in inflation expectations. Perceptions of Hungary’s economy 12 months ahead were about the same. The economic sentiment indicator, which combines business and consumer confidence, dropped to the weakest level since October last year. A deteriorating (business) eco outlook and price rising expectations paints a stagflationary picture which may have originated from the recent sharp HUF depreciation. EUR/HUF today jumped to 411, matching the recent November 2-yr highs.
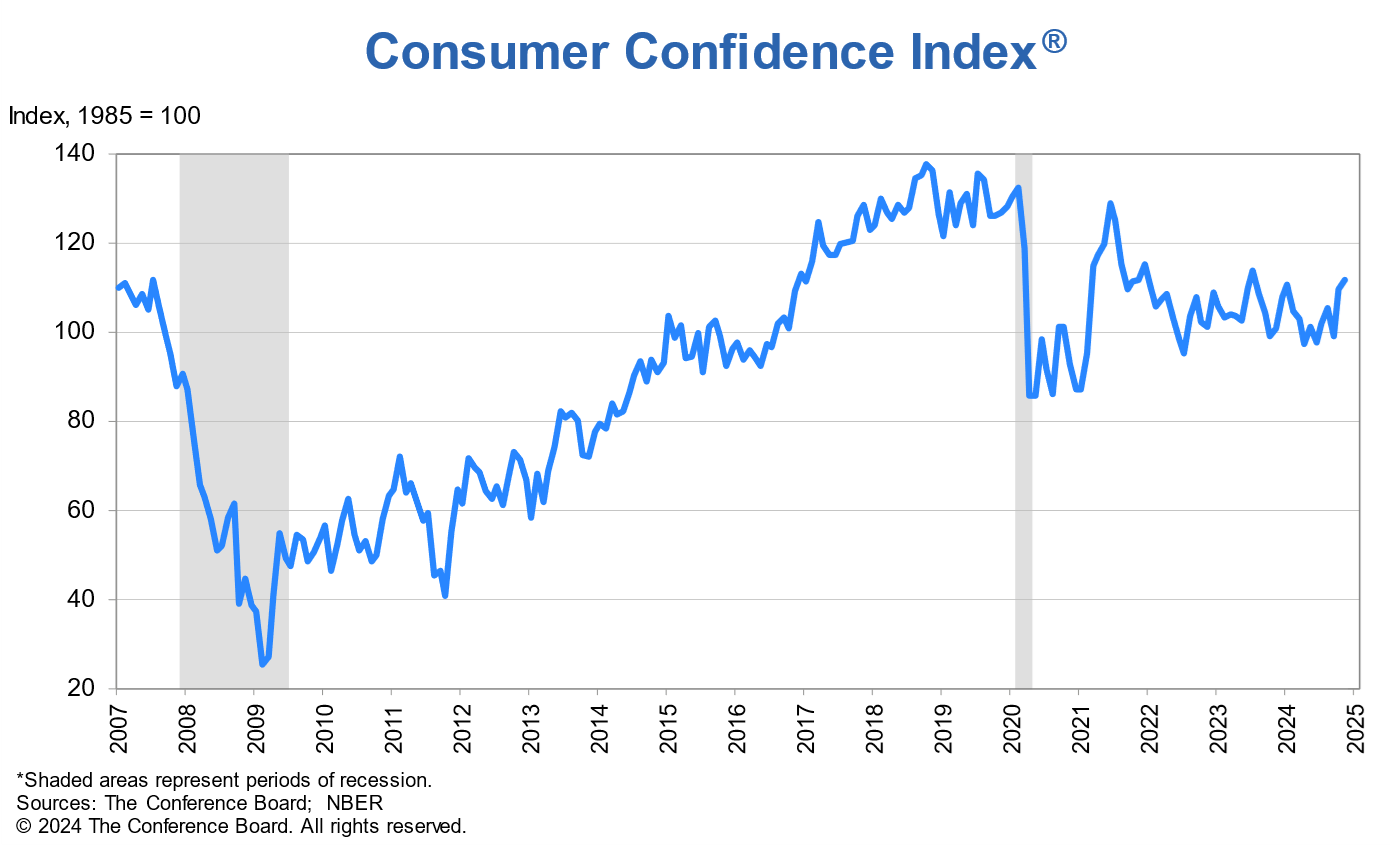
US consumer confidence rises to 111.7, driven by labor market optimism
US Conference Board Consumer Confidence Index increased to 111.7 in November, up from 109.6 in October, though slightly below the expected 112.0. Present Situation Index, which reflects consumers’ views on current economic conditions, saw a significant rise of 4.8 points to 140.9. Expectations Index, measuring consumer outlook for the next six months, inched up by 0.4 points to 92.3.
Dana M. Peterson, Chief Economist at The Conference Board, noted that “consumer confidence continued to improve in November and reached the top of the range that has prevailed over the past two years.”
The improvement was primarily driven by stronger consumer sentiment regarding the labor market, with future job availability optimism reaching its highest level in nearly three years.
However, expectations for future business conditions remained steady, and consumers were slightly less optimistic about future income prospects.
EUR/USD Mid-Day Outlook
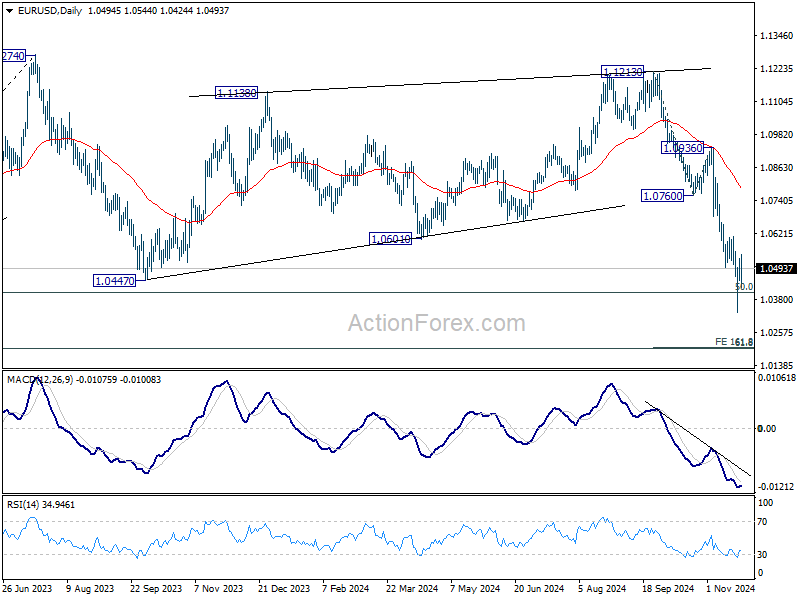
Daily Pivots: (S1) 1.0453; (P) 1.0492; (R1) 1.0534; More...
Intraday bias in EUR/USD remains neutral and outlook is unchanged. More consolidations could be seen above 1.0330 temporary low but further decline is expected as long as 1.0609 resistance holds. On the downside, sustained trading below 1.0404 key fibonacci level will carry larger bearish implication and target next level at 161.8% projection of 1.1213 to 1.0760 from 1.0936 at 1.0203. However, firm break of 1.0609 will confirm short term bottoming, and turn bias back to the upside for 1.0760 support turned resistance first.
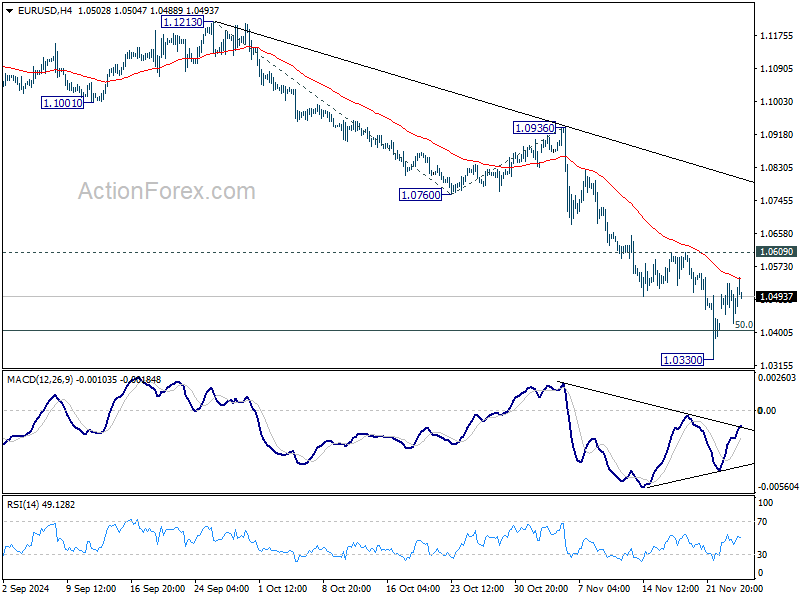
In the bigger picture, immediate focus is now on 50% retracement of 0.9534 (2022 low) to 1.1274 at 1.0404. Strong rebound from this level will keep price actions from 1.1273 (2023 high) as a medium term consolidation pattern only. However, sustained break of 1.0404 will raise the chance that whole up trend from 0.9534 has reversed. That would pave the way to 61.8% retracement at 1.0199 first. Firm break there will target 0.9534 low again.