Sample Category Title
GBP/USD Daily Outlook
Daily Pivots: (S1) 1.2480; (P) 1.2539; (R1) 1.2590; More...
Intraday bias in GBP/USD is turned neutral with current recovery and some consolidations could be seen above 1.2486. But outlook will stay bearish as long as 1.2713 resistance holds. Break of 12487 will resume the fall from 1.3433 to 1.2298 cluster support zone.
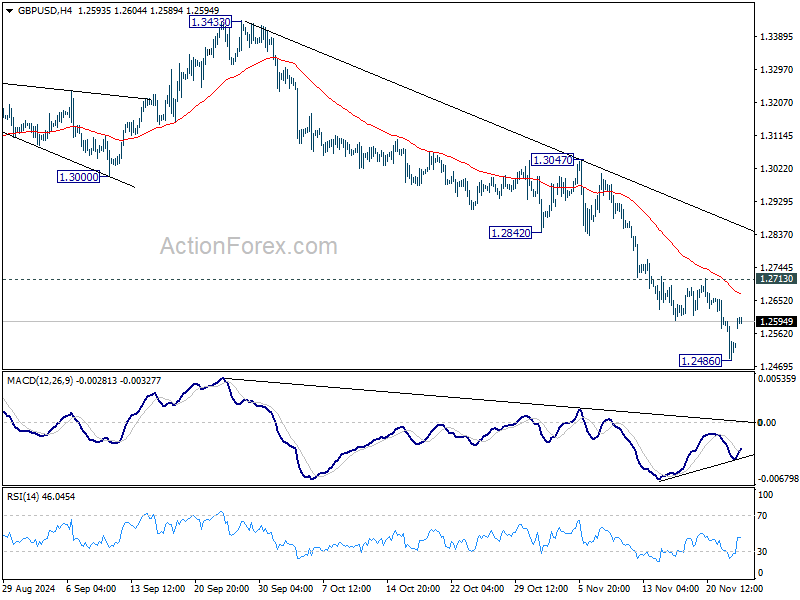
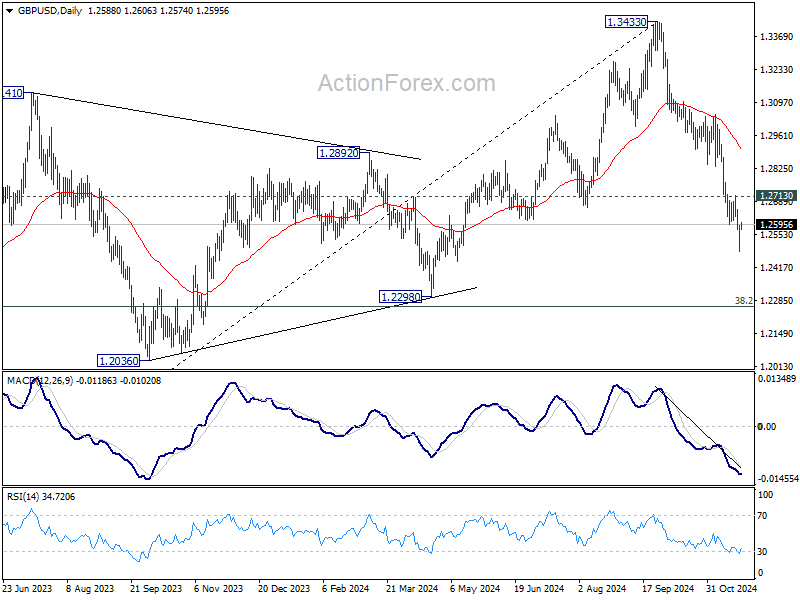
In the bigger picture, a medium term top should be in place at 1.3433, and price actions from there are correcting whole up trend from 1.0351 (2022 low). Deeper decline is now expected as long as 55 D EMA (now at 1.2918) holds, to 38.2% retracement of 1.0351 to 1.3433 at 1.2256, which is close to 1.2298 structural support. Strong support should be seen there to bring rebound.
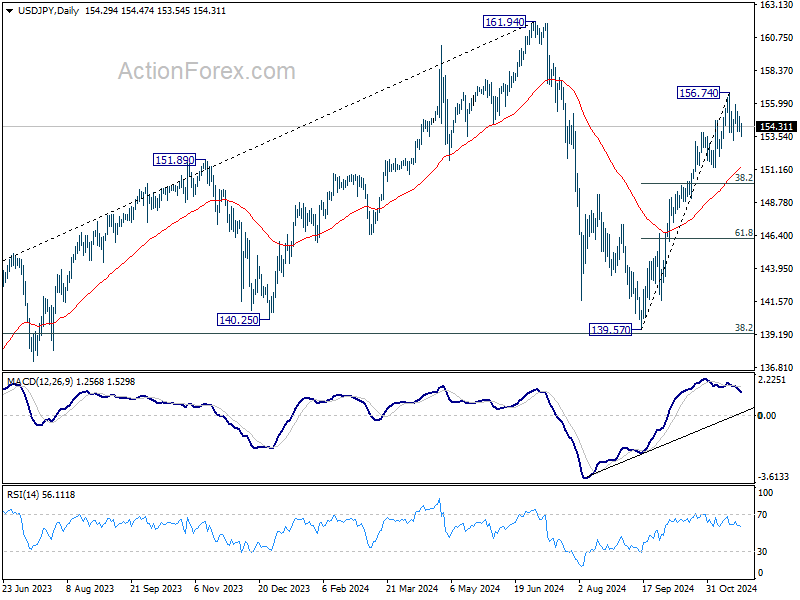
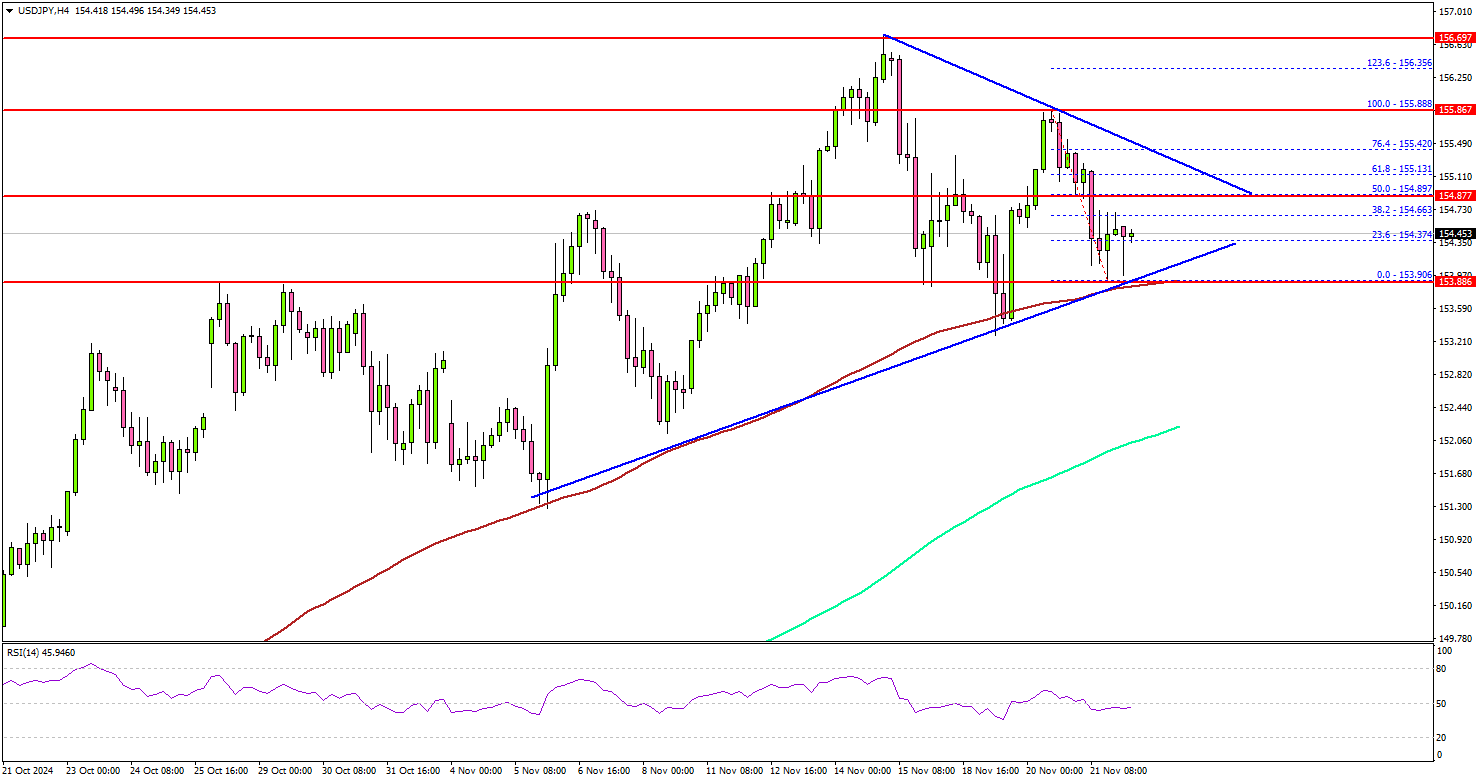
USD/JPY Daily Outlook
Daily Pivots: (S1) 153.82; (P) 154.64; (R1) 155.36; More...
Intraday bias in USD/JPY remains neutral as consolidations continue below 156.74. On the downside, break of 153.27 will bring deeper correction to 38.2% retracement of 139.57 to 156.74 at 150.18. Meanwhile, on the upside, firm break of 156.74 will resume the rally from 139.57 towards 161.95 high.
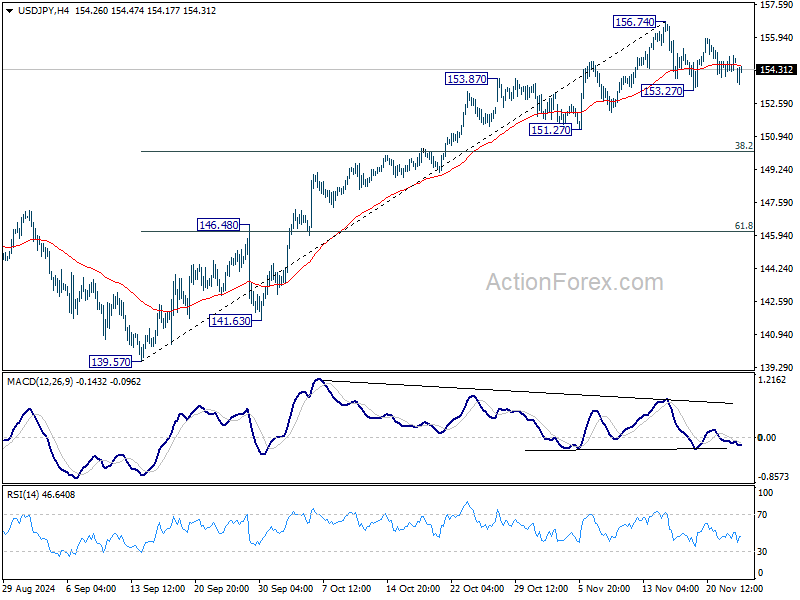
In the bigger picture, price actions from 161.94 are seen as a corrective pattern to rise from 102.58 (2021 low). The range of medium term consolidation should be set between 38.2% retracement of 102.58 to 161.94 at 139.26 and 161.94. Nevertheless, sustained break of 139.26 would open up deeper medium term decline to 61.8% retracement at 125.25.
ECB’s Lane warns against prolonged restrictive policy
In an interview with Les Echos, ECB Chief Economist Philip Lane highlighted that "monetary policy should not remain restrictive for too long".
He explained the challenges of maintaining restrictive monetary policy stance for an extended period, cautioning that it could stifle economic growth and lead to inflation falling below ECB’s 2% target.
However, while markets currently assign a 50% probability to a 50bps rate cut in December, Lane appeared to moderate these expectations by emphasizing that inflation remains above target in key areas, particularly services, and that much of the recent decline stems from easing energy costs rather than broad-based price adjustments.
"There is still some distance to go in terms of adjustment for inflation to return to the desired level in a more sustainable way," Lane noted.
USD/CHF Daily Outlook
Daily Pivots: (S1) 0.8877; (P) 0.8918; (R1) 0.8983; More…
Intraday bias in USD/CHF is turned neutral first with current dip and some consolidations could be seen first. But outlook will will stay bullish as long as 0.8800 support holds, in case of retreat. Break of 0.8956 will resume the rally from 0.8374, and target 0.9223 key resistance next.
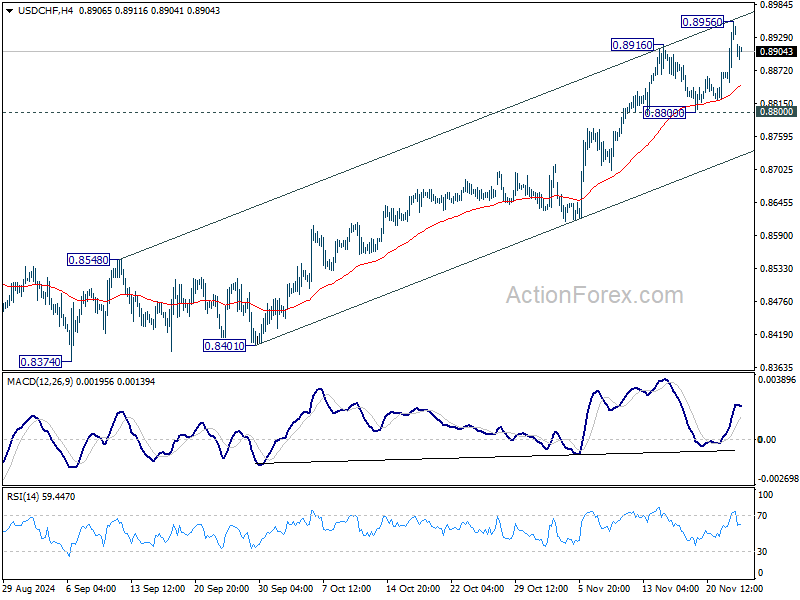
In the bigger picture, price actions from 0.8332 (2023 low) are currently seen as a medium term corrective pattern. Rise from 0.8374 is seen as the third leg. Overall outlook will continue to stay bearish as long as 0.9223 resistance holds. Break of 0.8332 low is in favor at a later stage when the consolidation completes.
Dollar Weakens Amid US Treasury Secretary Pick, But Resilience May Prevail
Dollar traded broadly lower in Asian session as markets reacted to President-elect Donald Trump’s appointment of Scott Bessent, a seasoned fund manager, as Treasury Secretary. Bessent’s stance aligns with Trump’s policies on tariffs, though his pragmatic approach has been perceived as a stabilizing factor. He advocates for tariffs to be introduced "gradually" and supports tax reforms, deregulation, and economic growth as pathways to address the US’s significant debt burden. These positions have led some to describe him as a "safe hand" for the role, offering reassurance to bond markets too.
However, Bessent’s favor for a strong Dollar and his endorsement of tariffs continue to generate debate. While his appointment may have triggered a temporary pullback in the greenback, analysts caution that his economic philosophies could ultimately reinforce Dollar strength, particularly if supported by broader economic fundamentals.
Despite the session’s softness, the Dollar remains the best-performing currency in November, bolstered by resilient U.S. economic data and expectations of a slower Fed easing path. Canadian Dollar ranks as the second strongest, followed by Australian Dollar. Conversely, Euro, British Pound, and Swiss Franc are the weakest performers. Japanese Yen and New Zealand Dollar are holding a middle-ground position.
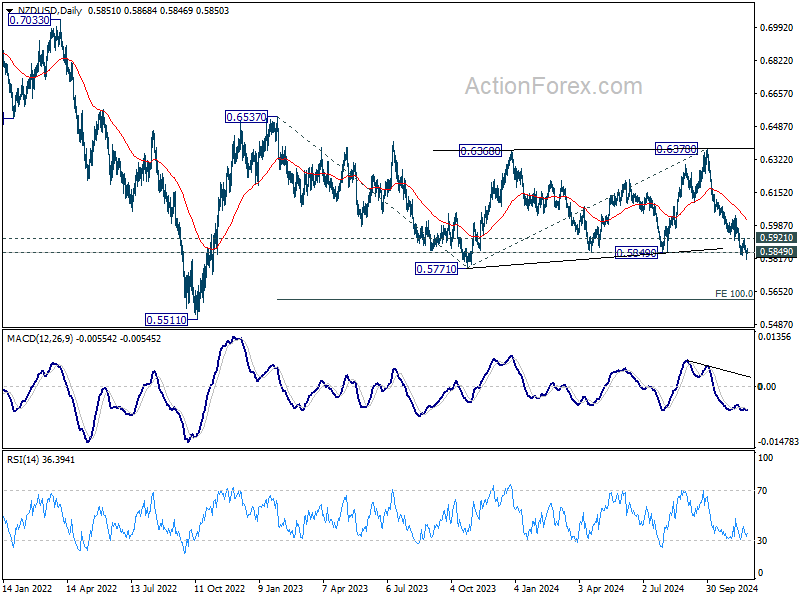
NZD/USD pair is drawing significant attention this week as RBNZ rate cut awaited. A key focus is whether RBNZ signals deeper monetary easing in its projections for 2025. Technically, NZD/USD is still struggling to break through 0.5849 decisively for now. But outlook will remain bearish as long as 0.5921 resistance zone. Firm break of 0.5771/5849 support zone will resume whole fall from 0.6537 to 100% projection of 0.6537 to 0.5771 from 0.6378 at 0.5612.
In Asia, at the time of writing, Nikkei is up 1.46%. Hong Kong HSI is down -0.44%. China Shanghai SSE is down 0.80%. Singapore Strait Times is up 0.13%. Japan 10-year JGB yield is flat at 1.080.
New Zealand's Q3 retail sales down -0.1% qoq, ex-auto sales slumps -0.8% qoq
New Zealand’s retail sales volume for Q3 showed a marginal decline of -0.1% qoq, a better outcome than the expected -0.5% qoq contraction. However, the data revealed underlying weakness, as retail sales excluding autos fell by a sharper-than-expected -0.8% qoq, missing the forecast of -0.3% qoq.
A breakdown of the data shows that 10 out of 15 retail industries experienced lower sales volumes during the quarter.
Meanwhile sales value dropped significantly by -0.7% qoq. Regionally, 15 of the 16 regions reported lower seasonally adjusted sales values, underscoring the broad-based nature of the decline.
As Michael Heslop, an economic indicators spokesperson, noted, “Retail activity was flat in the September 2024 quarter, with a decrease in spending in most retail industries being offset by an increase in motor vehicles and electrical and electronic goods.”
New Zealand's goods exports rises 7.5% yoy in Oct, goods imports up 3.0% yoy
New Zealand's goods exports increased by 7.5% yoy in October, reaching NZD 5.8B, while total goods imports rose by 3.0% yoy to NZD 7.3B. This resulted in a trade deficit of NZD -1.54B, which, although significant, was better than the expected deficit of NZD -1.76B.
Key export markets demonstrated robust growth, with exports to China rising by NZD 113m (8.4% yoy), Australia up by NZD 60m (8.3% yoy), the US surging NZD 90m (15% yoy), the EU increasing NZD 48m (18% yoy), and Japan gaining NZD 19m (6.7% yoy).
On the import side, trends were more mixed. Imports from China and the EU declined, falling NZD 42m (-2.7% yoy) and NZD 35m (-3.2% yoy) respectively. However, imports from the US surged by NZD 459m (79% yoy), while South Korea and Australia saw notable increases of NZD 148m (32% yoy) and NZD 58m (7.5% yoy) respectively.
RBNZ to cut 50bps, Fed minutes and inflation data watched
RBNZ is widely anticipated to lower the Official Cash Rate by additional 50bps to 4.25% this week. A key focus will be the new economic projections in the Monetary Policy Statement, which are expected to indicate further rate reductions in 2025.
Current market expectations suggest that RBNZ's OCR could decline to 3.50% by the end of next year, with a terminal rate projected between 3.00% and 3.50% in the following year. However, there is potential for more significant downside surprises in this outlook.
Also, Fed is set to release the minutes of November's FOMC meeting. Unlike the September meeting, which was marked by intense debate over a 50 bps rate cut, the atmosphere in November is expected to reflect greater consensus.
Two pressing questions face the Fed: first, whether it will implement another interest rate cut in December, with market odds currently split at approximately 50/50. It is unlikely that the minutes will provide substantial clues, as the decision will heavily depend on forthcoming employment data.
The second question concerns Fed's rate path for next year. Given the uncertainty surrounding Donald Trump's policies as he prepares to take office again next year, Fed officials are unlikely to have a definitive plan at this stage.
Inflation data will be a major focal point this week too, with key releases including the Eurozone's CPI flash estimate, US PCE index, and Australia's monthly CPI.
Eurozone's CPI is of particular importance; headline CPI is expected to rise back to 2.3%, while core CPI is anticipated to tick up to 2.8%. Markets are already betting on a December 50bps cut by ECB following last week's disappointing Eurozone PMI data. Any downside surprises in the inflation figures will reinforce this dovish outlook.
Additional data to monitor include GDP figures from Switzerland and Canada, as well as Germany's Ifo Business Climate Index.
Here are some highlights for the week:
- Monday: New Zealand retail sales, trade balance, Germany Ifo business climate.
- Tuesday: Japan SPPI; US house price index, consumer confidence, new home sales.
- Wednesday: Australia monthly CPI; RBNZ rate decision; Germany Gfk consumer sentiment; US GDP revision, jobless claims, durable goods orders, goods trade balance, Chicago PI, personal income and spending, PCE inflation, FOMC minutes.
- Thursday: New Zealand ANZ business confidence; Germany CPI flash; Eurozone M3 money supply.
- Friday: Japan Tokyo CPI, unemployment rate, industrial production, retail sales, consumer confidence, housing starts; Germany import prices, retail sales, unemployment rate; Swiss GDP; Eurozone CPI flash; Canada GDP.
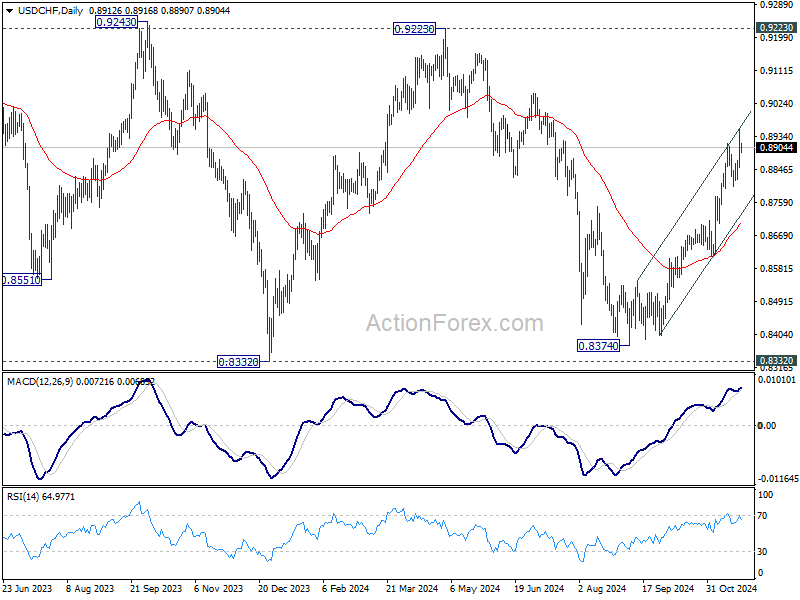
USD/CHF Daily Outlook
Daily Pivots: (S1) 0.8877; (P) 0.8918; (R1) 0.8983; More…
Intraday bias in USD/CHF is turned neutral first with current dip and some consolidations could be seen first. But outlook will will stay bullish as long as 0.8800 support holds, in case of retreat. Break of 0.8956 will resume the rally from 0.8374, and target 0.9223 key resistance next.
In the bigger picture, price actions from 0.8332 (2023 low) are currently seen as a medium term corrective pattern. Rise from 0.8374 is seen as the third leg. Overall outlook will continue to stay bearish as long as 0.9223 resistance holds. Break of 0.8332 low is in favor at a later stage when the consolidation completes.
New Zealand’s goods exports rises 7.5% yoy in Oct, goods imports up 3.0% yoy
New Zealand's goods exports increased by 7.5% yoy in October, reaching NZD 5.8B, while total goods imports rose by 3.0% yoy to NZD 7.3B. This resulted in a trade deficit of NZD -1.54B, which, although significant, was better than the expected deficit of NZD -1.76B.
Key export markets demonstrated robust growth, with exports to China rising by NZD 113m (8.4% yoy), Australia up by NZD 60m (8.3% yoy), the US surging NZD 90m (15% yoy), the EU increasing NZD 48m (18% yoy), and Japan gaining NZD 19m (6.7% yoy).
On the import side, trends were more mixed. Imports from China and the EU declined, falling NZD 42m (-2.7% yoy) and NZD 35m (-3.2% yoy) respectively. However, imports from the US surged by NZD 459m (79% yoy), while South Korea and Australia saw notable increases of NZD 148m (32% yoy) and NZD 58m (7.5% yoy) respectively.
New Zealand’s Q3 retail sales down -0.1% qoq, ex-auto sales slumps -0.8% qoq
New Zealand’s retail sales volume for Q3 showed a marginal decline of -0.1% qoq, a better outcome than the expected -0.5% qoq contraction. However, the data revealed underlying weakness, as retail sales excluding autos fell by a sharper-than-expected -0.8% qoq, missing the forecast of -0.3% qoq.
A breakdown of the data shows that 10 out of 15 retail industries experienced lower sales volumes during the quarter.
Meanwhile sales value dropped significantly by -0.7% qoq. Regionally, 15 of the 16 regions reported lower seasonally adjusted sales values, underscoring the broad-based nature of the decline.
As Michael Heslop, an economic indicators spokesperson, noted, “Retail activity was flat in the September 2024 quarter, with a decrease in spending in most retail industries being offset by an increase in motor vehicles and electrical and electronic goods.”
First Impressions: NZ Retail Trade, September Quarter 2024
Retail sales fell 0.1% in the September quarter, a smaller drop than we expected. Retail spending remains soft, but is likely to firm over the coming months.
- September quarter retail sales (volume of good sold): -0.1% (Prev: -1.2%)
- Westpac f/c: -0.5%, Market: -0.5%
- September quarter nominal retail sales: -0.7% (Prev: -1.4%)
While not quite as weak as expected, September was another soft quarter for New Zealand’s retail sector.
Nominal retail spending fell 0.7% in the September quarter, with the volume of goods purchased down 0.1% (we had expected a sharper 0.5% fall in the volume of goods sold).
Spending in the September quarter was boosted by a rise in vehicle purchases, which can be lumpy on a quarter-to-quarter basis (for instance, this month’s rise followed a sharp drop last quarter).
However, looking under the surface, the softness in New Zealanders’ spending appetites remains clear. Spending in core (excl. vehicles and fuel) categories was down 0.8% over the past three months and is down 2.8% over the past year.
Looking at the longer-term trends in the retail sector, sales have been trending down over the past year as households have wound back their spending in response to increases in living costs and high interest rates. There has been particular softness in discretionary spending areas, like purchases of household furnishings and spending in bars and restaurants.
What’s the outlook for Christmas and beyond?
We expect that the September quarter will be the low point for retail sales. Tax cuts were rolled out in late July. In addition, the financial headwinds that have squeezed household spending power over the past year are now easing, with inflation dropping back and interest rates falling. It will take time for the full impact of those changes to pass through to households’ back pockets. However, confidence is on the rise.
Against that backdrop, we expect to see retail spending gradually pushing higher as we go into the holiday shopping season, with a more meaningful rise expected through mid-2025.
Implications for GDP growth
While firmer than expected, today’s figures were broadly in line with the continued softness in economic growth that we’re forecasting in the September quarter (we’re forecasting a 0.2% fall in GDP over the quarter). We’ll take a closer look at how our forecast for GDP growth is shaping up over the next couple of weeks as additional data on September quarter activity is released.
EUR/USD Freefalls: Are There Signs of a Rebound?
Key Highlights
- EUR/USD started another decline and traded below the 1.0500 support.
- A major bearish trend line is forming with resistance at 1.0485 on the 4-hour chart.
- Bitcoin rallied further and traded close to the $100,000 milestone level.
- GBP/USD dipped further and tested the 1.2500 support zone.
EUR/USD Technical Analysis
The Euro started yet another decline from the 1.0600 zone against the US Dollar. EUR/USD traded below the 1.0550 and 1.0520 levels to enter a bearish zone.
Looking at the 4-hour chart, the pair settled below the 1.0500 support, the 100 simple moving average (red, 4-hour), and the 200 simple moving average (green, 4-hour). It even tested the 1.0335 zone. A low was formed at 1.0333 and the pair is now consolidating losses.
On the upside, the pair could face resistance near the 1.0440 level. The first major resistance is near the 1.0485 level. There is also a bearish trend line forming with resistance at 1.0485 on the same chart.
A close above the 1.0485 level could set the tone for another increase. The next major resistance could be 1.0520, above which the price could climb higher toward the 1.0550 resistance. Any more gains might send EUR/USD toward 1.0600.
On the downside, immediate support sits near the 1.0350 level. The next key support sits near the 1.0335 level. Any more losses could send the pair toward the 1.0300 level.
Looking at Bitcoin, the price extended gains, traded to a new all-time high above $98,000 and might soon clear the $100,000 level.
Upcoming Economic Events:
- German IFO Business Climate Index for Nov 2024 – Forecast 86.0, versus 86.5 previous.
- German IFO Current Assessment Index for Nov 2024 - Forecast 85.5, versus 85.7 previous.
- German IFO Expectations Index for Nov 2024 – Forecast 87.3, versus 87.3 previous.
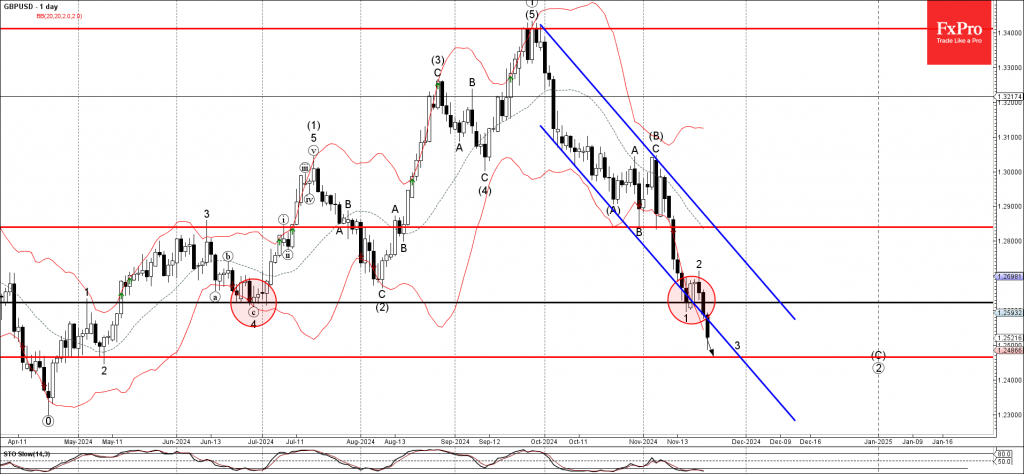
GBPUSD Wave Analysis
- GBPUSD broke support zone
- Likely to fall to support level 1.2465
GBPUSD currency pair recently broke the support zone located between the support level 1.2620 (former monthly low from June) and the support trendline of the daily down channel from September.
The breakout of this support zone accelerated the active minor impulse wave 3 of the higher impulse wave (C) from the start of November.
Given the strongly bullish US dollar sentiment seen today, GBPUSD currency pair can be expected to fall further to the next support level 1.2465, former monthly low from May and the target for the completion of the active impulse 3.