Sample Category Title
Australian Dollar Steady, RBA’s Hauser Says Rates Could Move Either Way
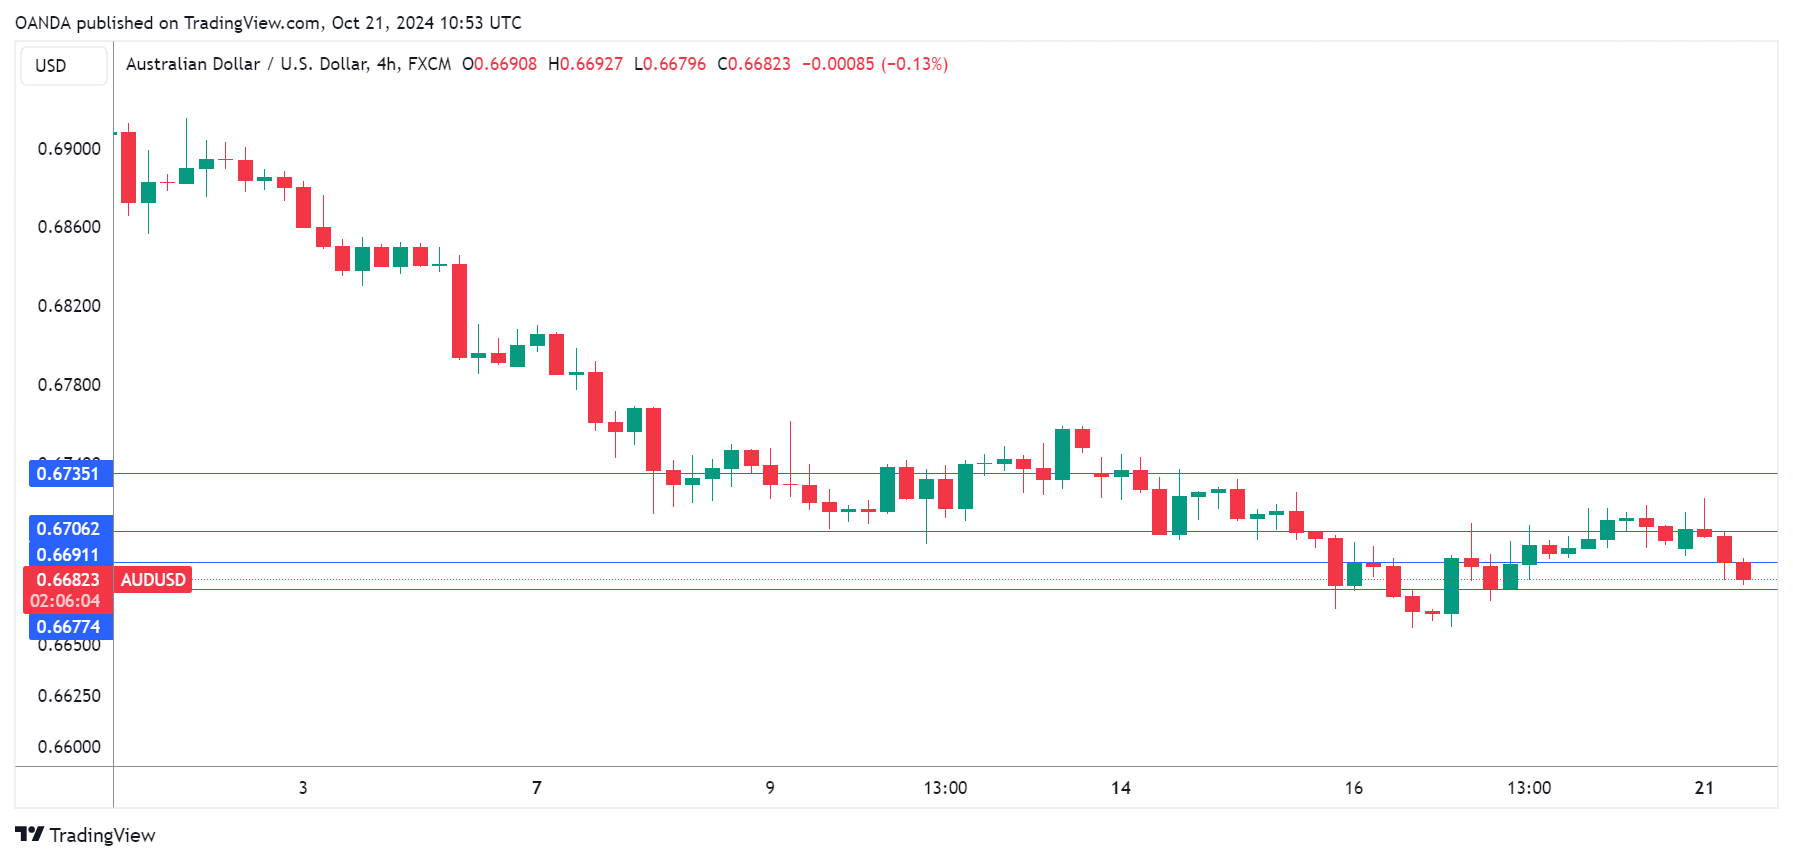
The Australian dollar is calm on Monday. In the European session, AUD/USD is trading at 0.6689, down 0.18%. The Aussie posted its third straight losing week and has declined 3.2% in October. On the data calendar, there are no US or Australian economic releases.
RBA’s Hauser: policy could move in either direction
The markets are trying to get a feel for when the Reserve Bank of Australia might make a rate move. The RBA has held rates at 4.35% for close to a year and has been hawkish in its stance, as board members have considered the possibility of rate hikes at recent meetings.
Traders are betting that the RBA’s first move will be a rate cut, but not until early next year. The September employment report was stronger than expected, which has eased the pressure on the RBA to lower rates. RBA Deputy Governor Andrew Hauser said on Monday that he was surprised that job growth has been so strong. Hauser noted that inflation remained too high and that the RBA could make a rate move in either direction. A rate hike would make the RBA an outlier among the major central banks, most of which are in a rate-cutting cycle in response to falling inflation.
The two key factors with regard to rate policy are inflation and employment and neither one supports the case for a rate cut. Inflation rose to 3.8% in the second quarter, up from 3.6% and close to double the central bank’s target of 2%, while the labor market remains strong. The RBA won’t be in a position to consider a cut until it sees lower inflation and a weaker employment data. The next rate meeting is on November 5 and the RBA is widely expected to stay on the sidelines.
AUD/USD Technical
- AUD/USD pushed below support at 0.6745 and 0.6720 earlier. Next, there is support at 0.6692
- There is resistance at 0.6773 and 0.6798
Crypto Market Maintains Upward Momentum
Market Picture
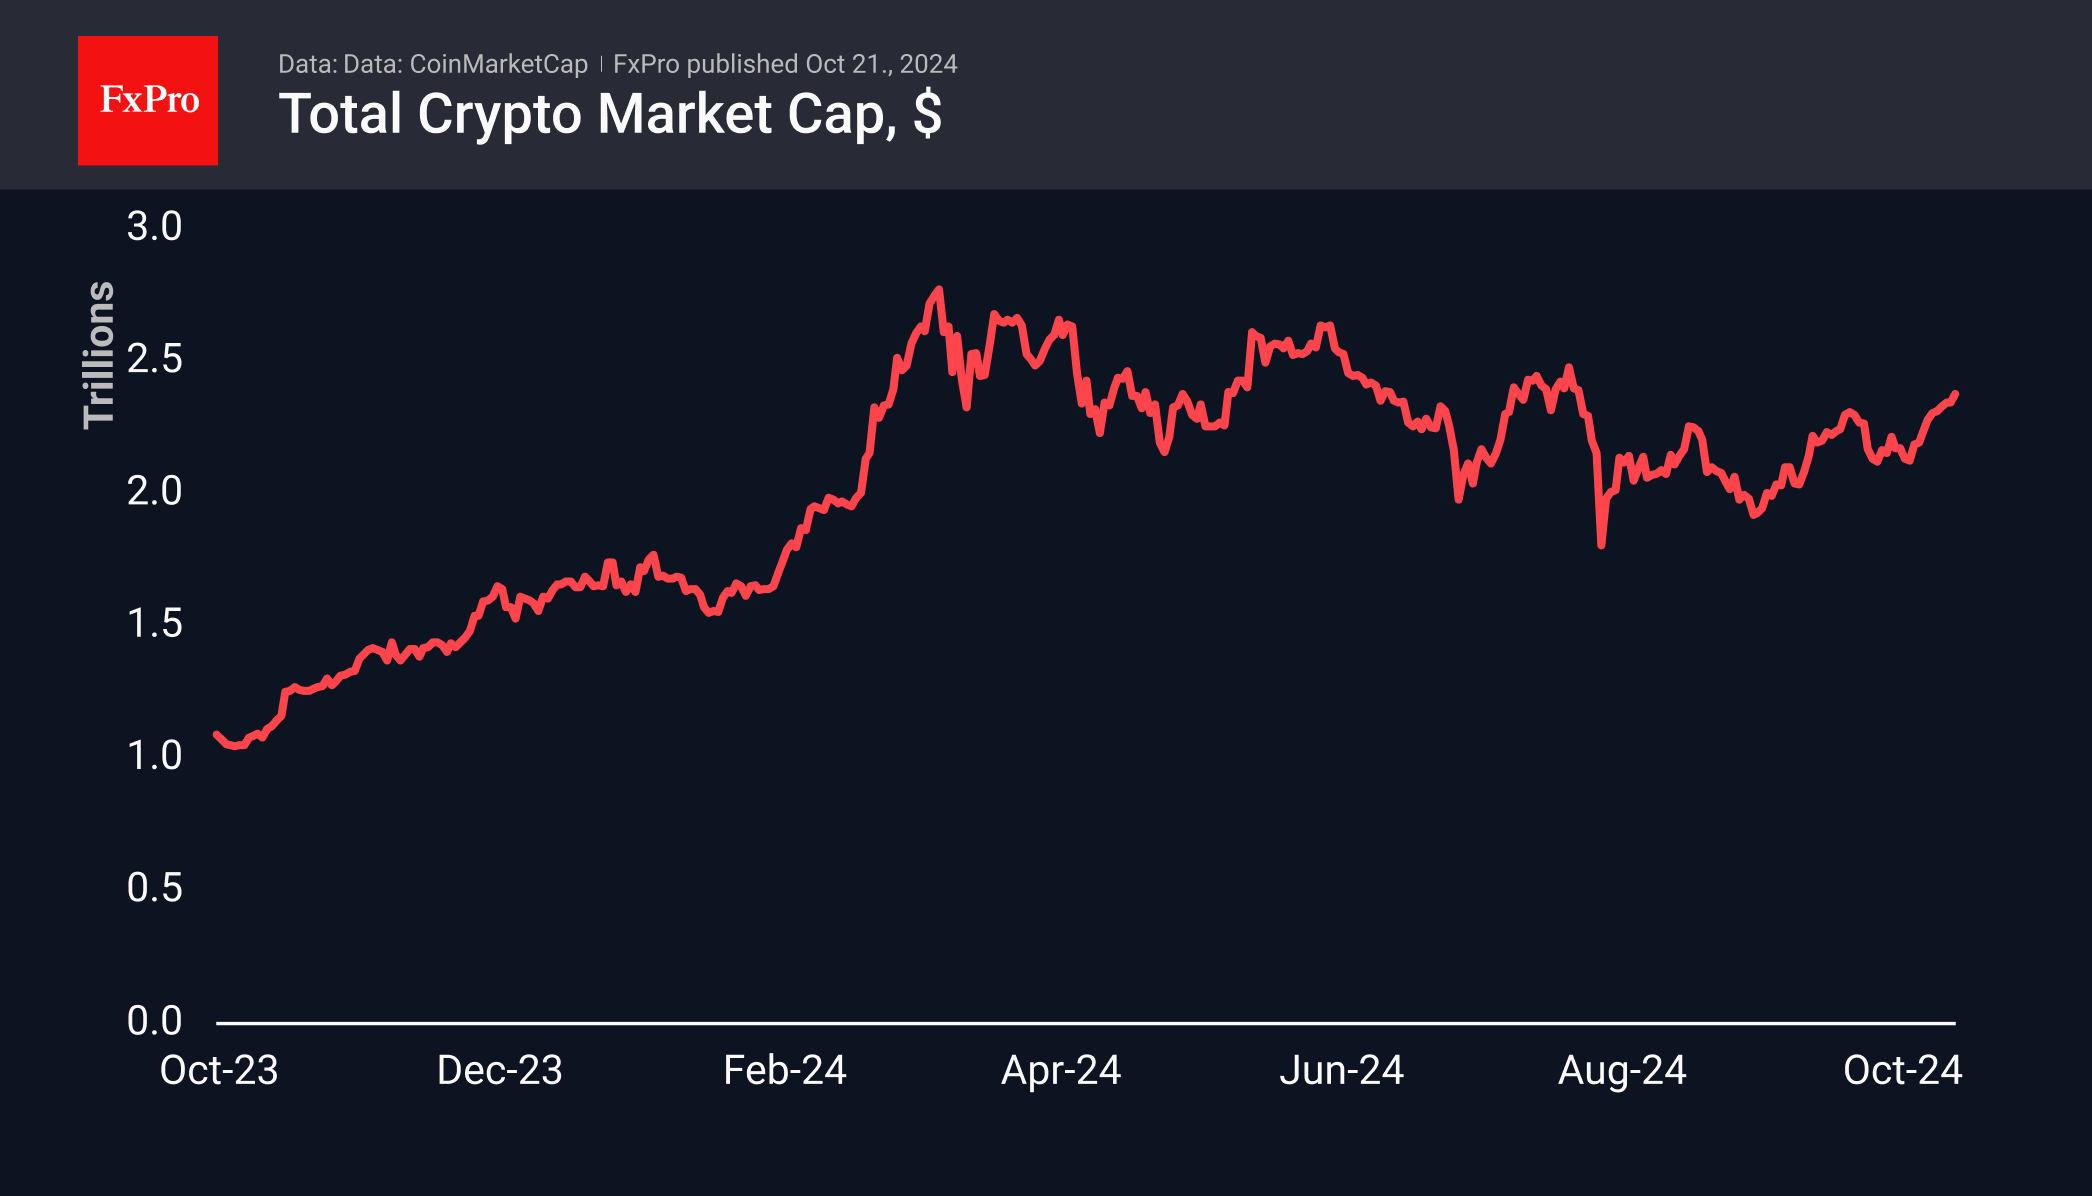
The crypto market has maintained its upward trajectory, with total capitalisation up more than 7% in seven days to $2.39 trillion, the highest since late July. The Cryptocurrency Fear and Greed Index is in the 71-73 (greed) range for the sixth day, also replicating the late July performance.
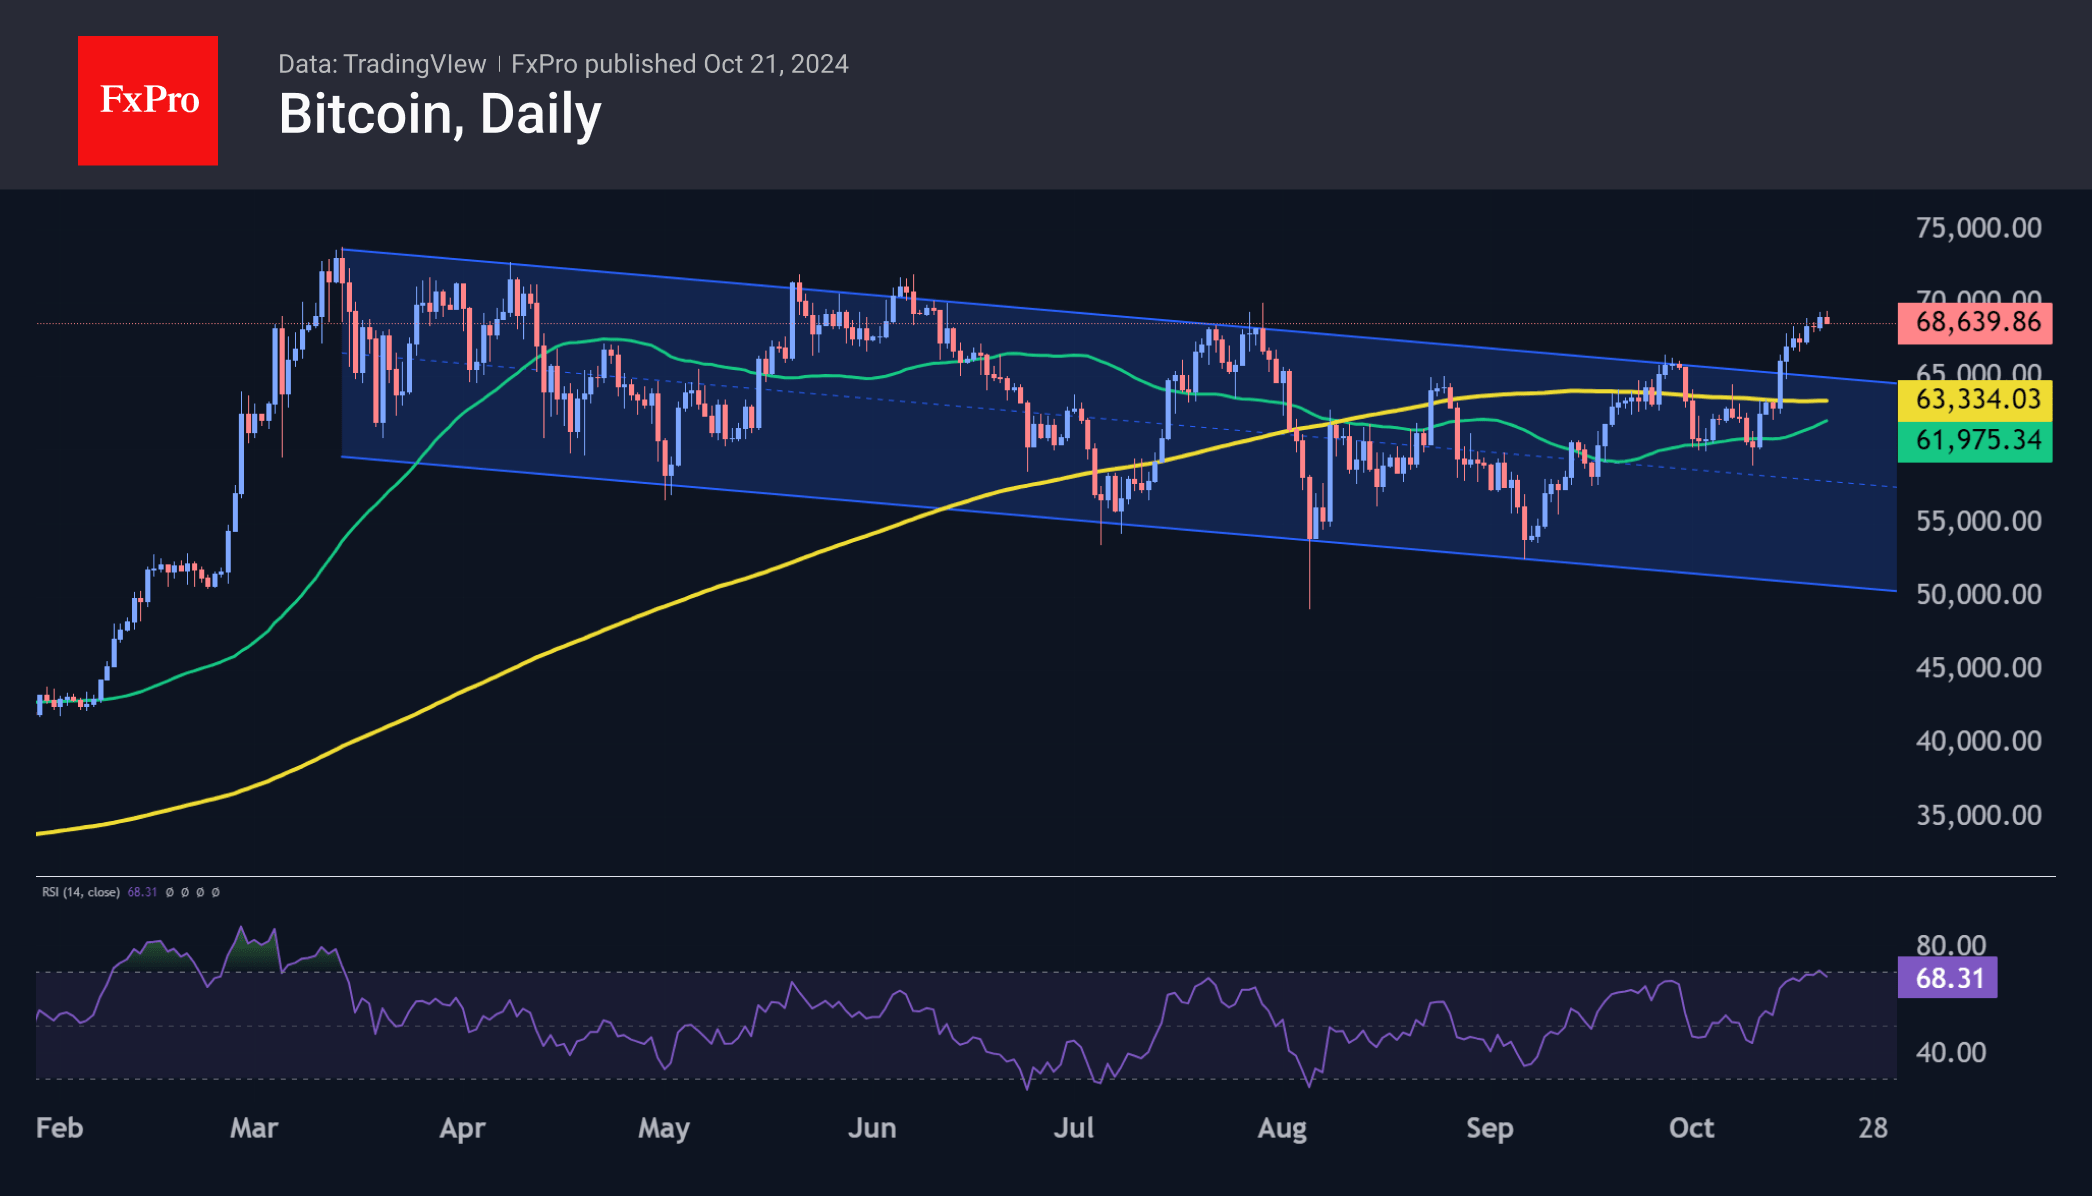
Bitcoin has hit new highs in almost three months, peaking at $69.5K on Monday morning on the back of a surge in inflows into the BTC ETF. The price is now assessing the late July highs, and the May-June double top just below $72K looks to be the bulls’ next target.
Ethereum rises 8.2% in seven days to $2,740, reaching highs not seen since late August. The second-largest cryptocurrency can easily reach the $2,900 area, where the 50-week moving average and the April-July price support area from earlier this year could be selling points, in addition to the important round level.

News Background
Inflows into US spot bitcoin ETFs last week were $2.13 billion (+11.3% over the week), bringing the total since January to $20.94 billion. Ethereum ETFs saw an inflow of $78.9 million after two weeks of outflows, decreasing total outflow since the ETF product launch by 14.1% to $480M for the week.
The US SEC has approved the trading of options on spot bitcoin ETFs on the NYSE and CBOE. In September, the regulator approved the trading of options on spot bitcoin ETFs on the Nasdaq. Bloomberg described the SEC’s decision as not surprising but as good news.
The SEC has taken steps to appeal previous court rulings regarding Ripple’s XRP token. The agency has filed a preliminary civil complaint (Form C). Ripple CEO Brad Garlinghouse said that despite the legal battle with the regulator, XRP is set to become one of the leaders in the crypto industry due to the coin’s use in the payments sector.
According to Messari, Tron’s quarterly profits increased by 30% following the launch of its SunPump meme coin creation platform. The largest token issued on SunPump was the SUNDOG, which had a capitalisation of over $220 million.
Gold Hits New Record Amid Geopolitical Tensions and US Election Uncertainty
Gold prices surged to a new record high of 2,729 USD per troy ounce on Monday, driven by escalating conflicts in the Middle East and the heightened uncertainty surrounding the upcoming US presidential election. These persistent geopolitical factors, particularly the closely contested race between Donald Trump and Kamala Harris, have bolstered investor demand for safe-haven assets like gold.
The intensification of hostilities in the Middle East, particularly with Israel's ongoing discussions about further actions against Iran, has significantly influenced market sentiment. Despite calls from US President Joe Biden for a ceasefire, Israel's reluctance to make concessions has only added to the geopolitical tensions affecting global markets.
As the US election day on 5 November approaches, investors are increasingly repositioning their portfolios, favouring the stability and security that gold provides during political uncertainty. Preliminary polls indicate that the election could be one of the closest in recent history, further enhancing gold's appeal as a protective investment.
Market analysts are now revising their expectations for gold upwards, with some speculating that prices could reach 3,000 USD per troy ounce by Q4 2025. This optimistic outlook is further supported by the surge in interest in silver, which has reached its highest price since 2012 due to similar bullish sentiments in the precious metals market.
Technical analysis of gold (XAU/USD)
The gold market has successfully breached the 2,685 level, paving the way for upward movement. After achieving a local high of 2,732, the market is currently targeting the 2,757 level. A corrective pullback to at least 2,700 is anticipated before potentially resuming the upward trajectory towards 2,757. This bullish outlook is supported by the MACD indicator, whose signal line is significantly above zero and climbing, indicating strong upward momentum.
On the hourly chart, gold has established a growth wave, peaking at 2,732, with a consolidation pattern forming just below this level. A downward correction towards 2,700 is expected shortly. Upon completing this correction, the market may initiate another upward phase, targeting a retest of 2,733, potentially extending towards 2,757. The Stochastic oscillator corroborates this scenario, currently positioned above 80 but pointing downwards, suggesting a brief consolidation or correction may occur before further gains.
USD/JPY Outlook: Violation of Pivotal Points to Generate Fresh Direction Signals
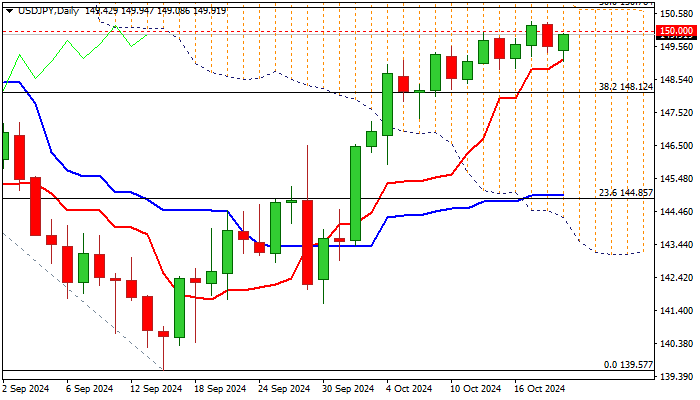
USDJPY regained traction in early trading on Monday but remains with the recent range and looks for firmer direction signal.
Near term bias is expected to remain bullish while the price action stays above rising daily Tenkan-sen (149.16) which contained today’s dip, but the upside attempts were so far limited.
Probes through psychological 150 barrier failed to register weekly close above this level, lacking fresh bullish signal for extension towards more significant barriers at 150.69/76 (daily cloud top / 100DMA / 50% retracement of 161.95/139.57 downtrend) violation of which to signal continuation of an uptrend from139.57 (2024 low, posted on Sep 16).
Daily studies are mixed as positive signals from strong bullish momentum and diverging daily Tenkan / Kijun-sen after creating bull-cross) were partially offset by formation of 100/200DMA death cross).
The dollar remains supported by wide gap between Fed/BoJ monetary policies and growing market expectations of election victory of Donald Trump, whose pro-business policy is expected to boost the economy and further support dollar.
On the other hand, more signals that Fed may remain dovish on monetary policy would increase pressure on the US currency.
Initial negative signals to be expected on potential loss of 149.16/00 pivots, which would risk deeper pullback, and expose supports at 148.12 and 147.28 (broken Fibo 38.2% / rising 20DMA).
Res: 150.00; 150.76; 151.00; 151.40.
Sup: 149.16; 149.00; 148.86; 148.12.
AUD/USD and NZD/USD Could Recover In Short-Term
AUD/USD is attempting a recovery wave from 0.6660. NZD/USD could gain bullish momentum if there is a clear move above the 0.6090 resistance.
Important Takeaways for AUD/USD and NZD/USD Analysis Today
- The Aussie Dollar found support near 0.6660 and is now recovering against the US Dollar.
- There was a break above a key bearish trend line with resistance at 0.6690 on the hourly chart of AUD/USD at FXOpen.
- NZD/USD is attempting a recovery wave above the 0.6050 resistance.
- There was a break above a major bearish trend line with resistance near 0.6075 on the hourly chart of NZD/USD at FXOpen.
AUD/USD Technical Analysis
On the hourly chart of AUD/USD at FXOpen, the pair dipped from the 0.6760 resistance zone. The Aussie Dollar declined below 0.6700, but the bulls were active near 0.6660 against the US Dollar.
A low was formed near 0.6658 and the pair is now correcting losses. There was a move above the 50% Fib retracement level of the downward move from the 0.6759 swing high to the 0.6658 low. There was also a break above a key bearish trend line with resistance at 0.6690.
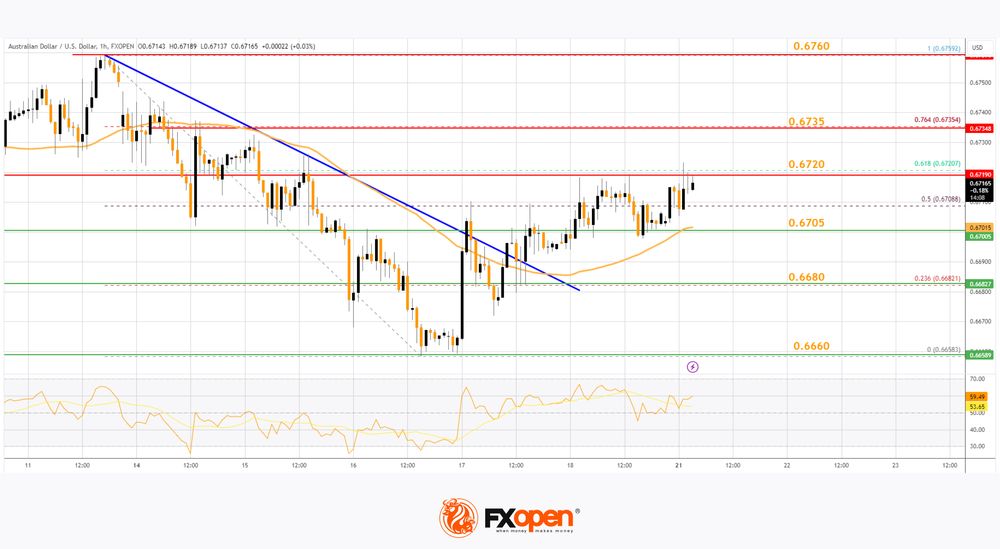
The pair is now above 0.6700 and the 50-hour simple moving average. On the upside, immediate resistance is near the 61.8% Fib retracement level of the downward move from the 0.6759 swing high to the 0.6658 low at 0.6720.
The first major resistance is near a rising channel at 0.6735. A clear upside break above 0.6735 could send the pair toward 0.6760. The next major resistance on the AUD/USD chart is near 0.6780, above which the price could rise toward 0.6800. Any more gains might send the pair toward 0.6820.
On the downside, initial support is near 0.6705 or the 50-hour simple moving average. The next support could be the 0.6680 zone. Any more losses might send the pair toward the 0.6660 support.
NZD/USD Technical Analysis
On the hourly chart of NZD/USD on FXOpen, the pair also followed a similar pattern and declined from the 0.6120 zone. The New Zealand Dollar gained bearish momentum and traded below 0.6100 against the US Dollar.
The pair even dropped below the 50-hour simple moving average and tested 0.6080. A low was formed near 0.6039 and the pair is now attempting a fresh increase. It is back above the 0.6050 level and the 50-hour simple moving average.
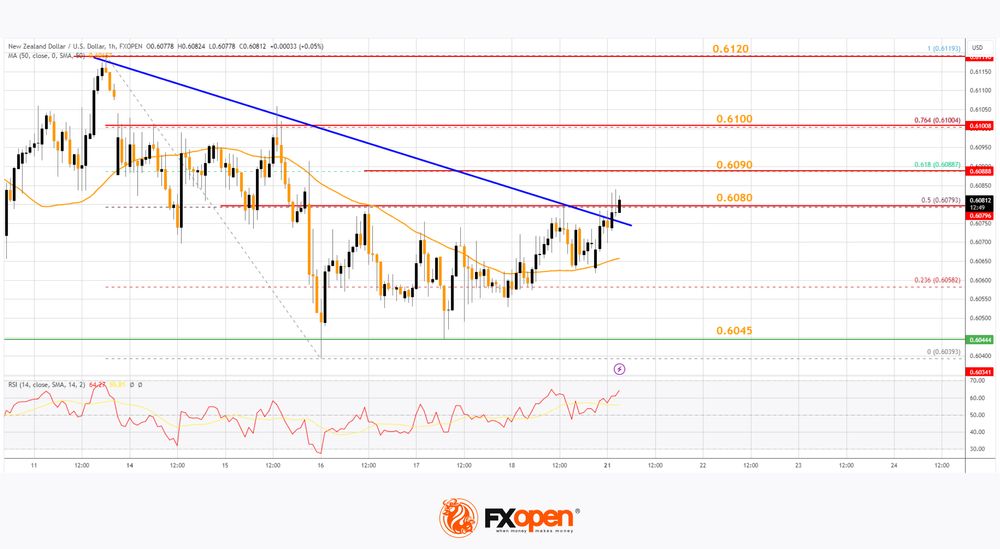
Besides, there was a break above a major bearish trend line with resistance near 0.6075. On the upside, the pair is facing resistance near the 50% Fib retracement level of the downward move from the 0.6119 swing high to the 0.6039 low.
The next major resistance is near the 76.4% Fib retracement level of the downward move from the 0.6119 swing high to the 0.6039 low at 0.6100. If there is a move above 0.6100, the pair could rise toward the 0.6120 resistance.
Any more gains might open the doors for a move toward the 0.6150 resistance zone. On the downside, immediate support on the NZD/USD chart is near 0.6045.
The next major support is near the 0.6000 zone. If there is a downside break below 0.6000, the pair could extend the decline toward the 0.5965 level. The next key support is near 0.5940.
Trade over 50 forex markets 24 hours a day with FXOpen. Take advantage of low commissions, deep liquidity, and spreads from 0.0 pips. Open your FXOpen account now or learn more about trading forex with FXOpen.
This article represents the opinion of the Companies operating under the FXOpen brand only. It is not to be construed as an offer, solicitation, or recommendation with respect to products and services provided by the Companies operating under the FXOpen brand, nor is it to be considered financial advice.
ECB’s Simkus: Rates to move toward neutral as disinflation stays on track
ECB Governing Council member Gediminas Simkus commented today that the disinflationary trend is progressing steadily, though he acknowledged that services inflation remains elevated.
Simkus expects monetary policy to gradually become less restrictive, with the central bank lowering interest rates toward a "natural" level, estimated to be between 2-3%.
However, he emphasized that if the disinflation process becomes deeply "entrenched", rates could potentially fall below the natural level.
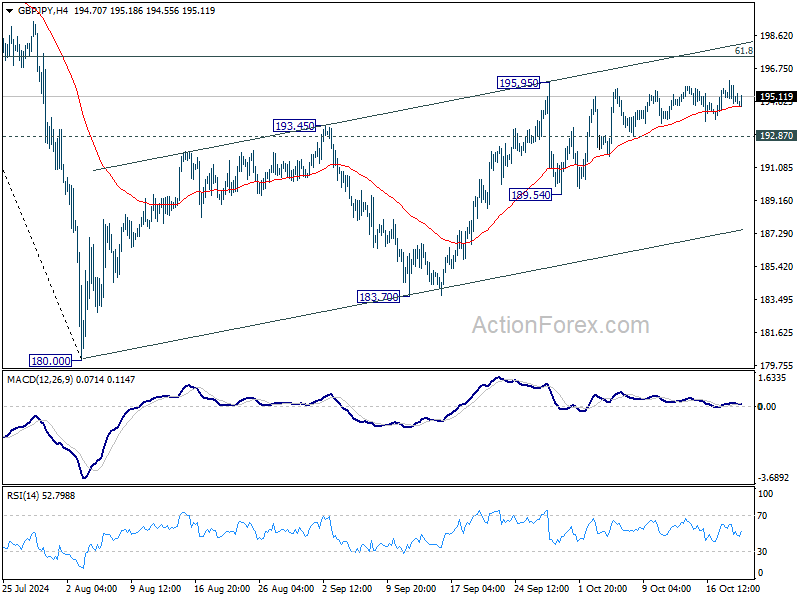
GBP/JPY Daily Outlook
Daily Pivots: (S1) 194.66; (P) 195.35; (R1) 195.95; More...
Intraday bias in GBP/JPY remains neutral as sideway trading continues. On the upside, break of 195.95 will resume whole rise from 180.00 to 61.8% retracement of 208.09 to 180.00 at 197.35 next. Sustained break there will target 208.09 high. On the downside, below 192.87 minor support will turn bias back to the downside for 189.54 support. Further break there will target 183.70 support.
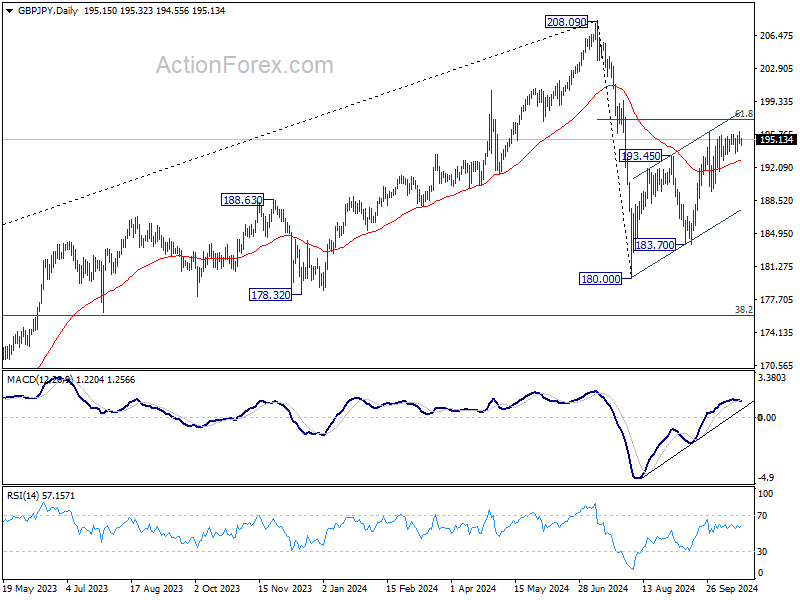
In the bigger picture, price actions from 208.09 are seen as a correction to whole rally from 123.94 (2020 low). The range of consolidation should be set between 38.2% retracement of 123.94 to 208.09 at 175.94 and 208.09. However, decisive break of 175.94 will argue that deeper correction is underway.
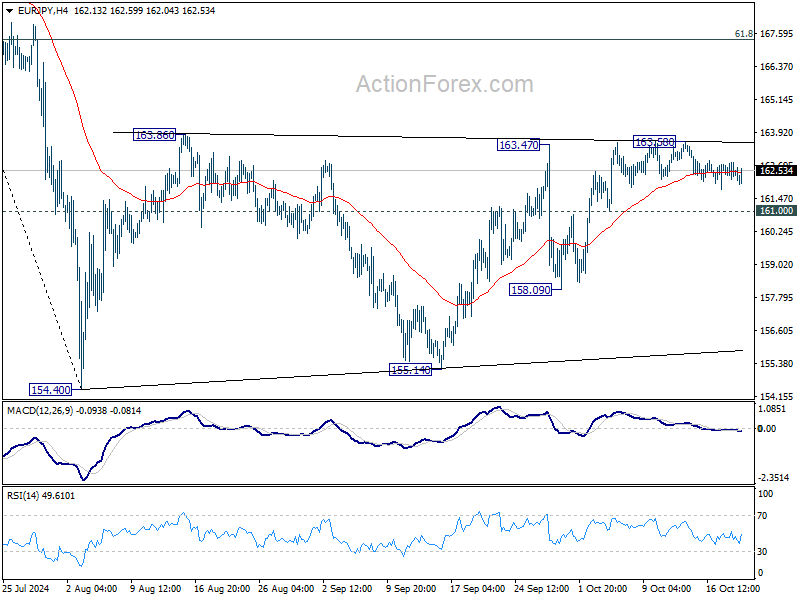
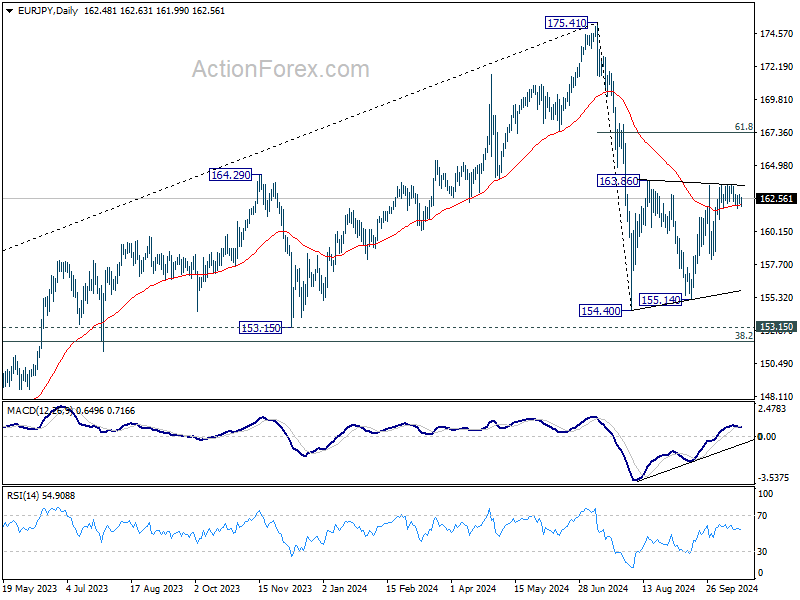
EUR/JPY Daily Outlook
Daily Pivots: (S1) 162.18; (P) 162.51; (R1) 162.84; More....
Intraday bias in EUR/JPY remains neutral as range trading continues. On the upside, firm break of 163.86 resistance will resume the rebound from 154.40 to 61.8% retracement of 175.41 to 154.40 at 167.38. On the downside, break of 161.00 minor support will turn bias back to the downside. Further break of 158.09 will target 154.40/155.14 support zone.
In the bigger picture, price actions from 175.41 are seen as correction to rally from 114.42 (2020 low). The range of consolidation should have been set between 38.2% retracement of 114.42 to 175.41 at 152.11 and 175.41 high. However, decisive break of 152.11 would argue that deeper correction is underway.
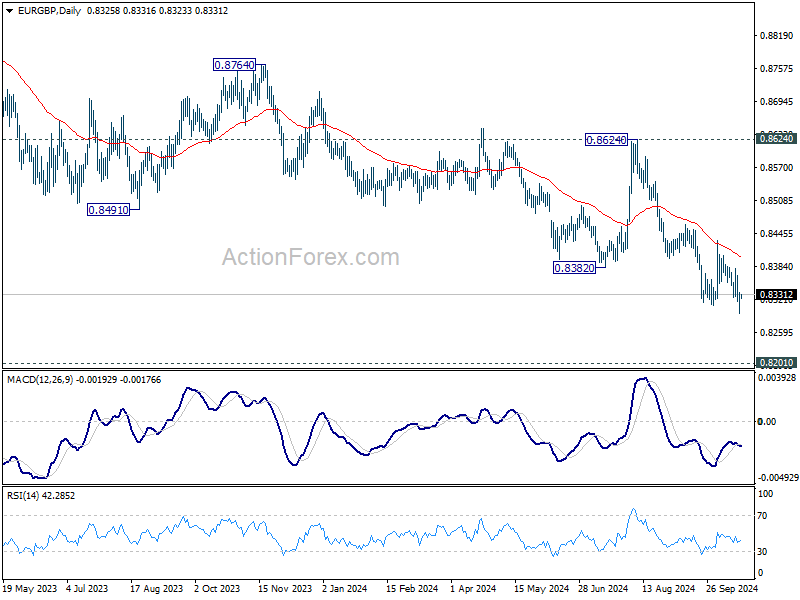
EUR/GBP Daily Outlook
Daily Pivots: (S1) 0.8302; (P) 0.8319; (R1) 0.8343; More...
Intraday bias in EUR/GBP remains on the downside for the moment. Current down trend is in progress for 0.8201 key support next. Strong support could be seen from there to bring rebound. But for now, break of 0.8433 resistance is needed to indicate short term bottoming. Otherwise, outlook will stay bearish in case of recovery.
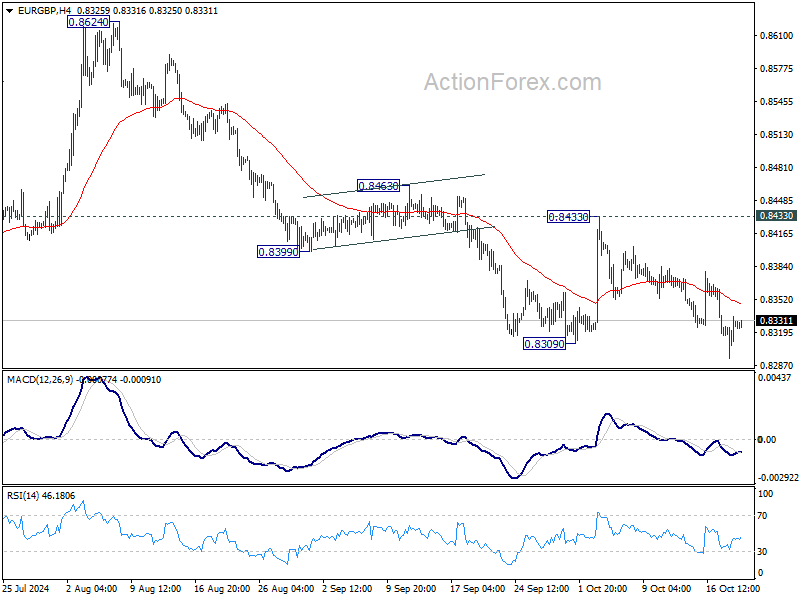
In the bigger picture, down trend from 0.9267 (2022 high) is in progress. Next target is 0.8201 (2022 low), but strong support should be seen there to bring rebound. However, outlook will remain bearish as long as 0.8624 resistance holds even in case of strong rebound. Decisive break of 0.8201 will indicate long term bearish reversal.
EUR/AUD Daily Outlook
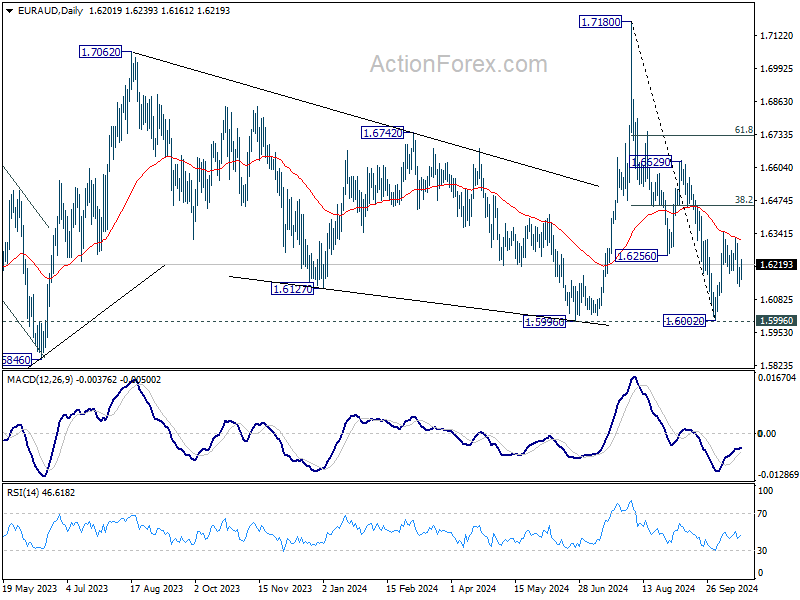
Daily Pivots: (S1) 1.6156; (P) 1.6185; (R1) 1.6233; More...
Intraday bias in EUR/AUD remains mildly on the downside, as fall from 1.6351 would extend to retest 1.6002 low. On the upside, however, break of 1.6351 will resume the rebound from 1.6002 to 38.2% of 1.7180 to 1.6002 at 1.6452.
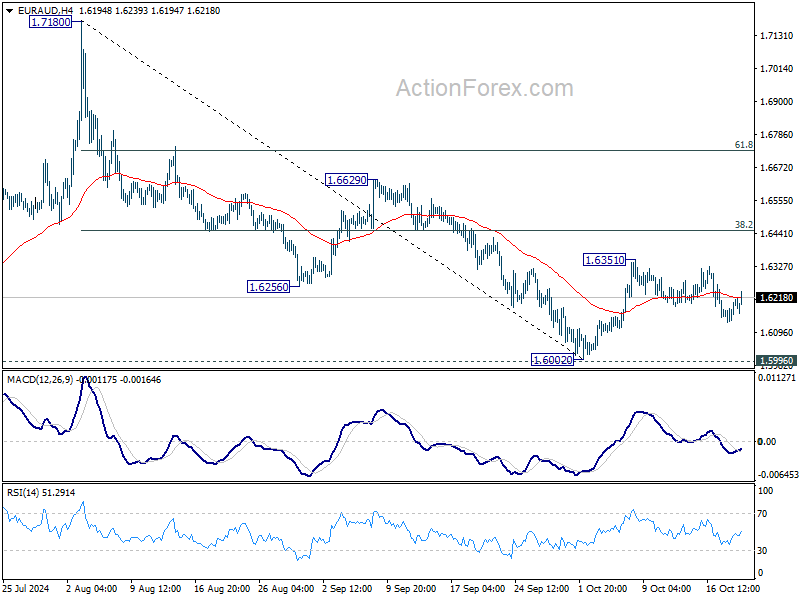
In the bigger picture, as long as 1.5996 cluster support holds (38.2% retracement of 1.4281 to 1.7062 (2023 high) at 1.6000), up trend from 1.4281 (2022 low) is still expected to resume at a later stage. However, decisive break of 1.5996 will argue that the medium term trend has reversed and turn outlook bearish.