
Sample Category Title
AUD/USD Weekly Report
AUD/USD edged lower to 0.6657 last week but recovered since then. Initial bias stays neutral this week for some more consolidations. Further decline is expected as long as 0.6758 resistance holds. Below 06657 will target 0.6621 first. Firm break there will confirm bearish reversal. However, break of 0.6758 will suggest that pullback from 0.6941 has completed and turn bias back to the upside.
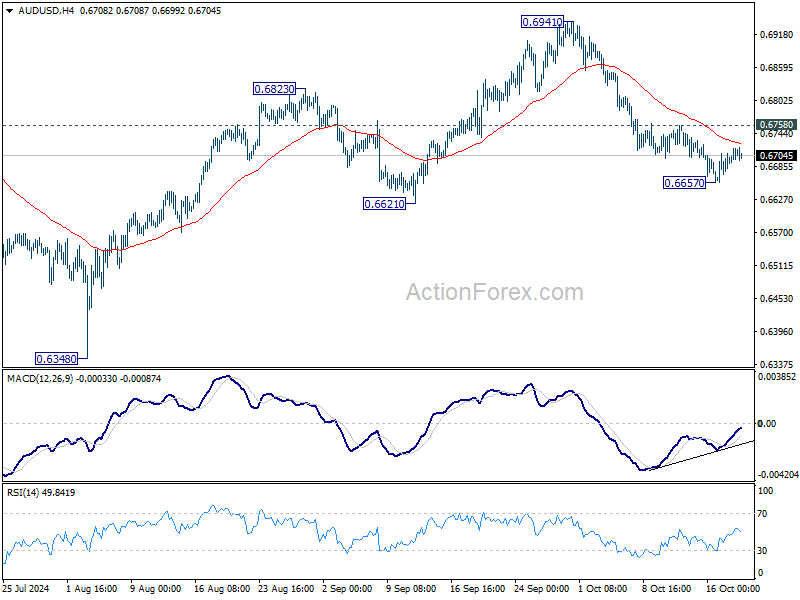
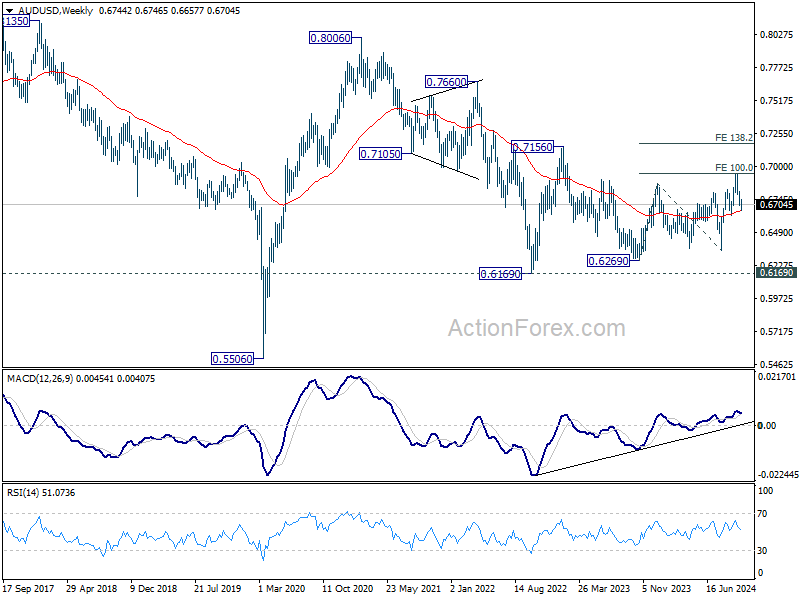
In the bigger picture, overall, price actions from 0.6169 (2022 low) are seen as a medium term corrective pattern, with rise from 0.6269 as the third leg. Firm break of 100% projection of 0.6269 to 0.6870 from 0.6340 at 0.6941 will target 138.2% projection at 0.7179. However, break of 0.6621 support will argue that rise from 0.6269 has completed and bring deeper fall back to 0.6269/6348 support zone.

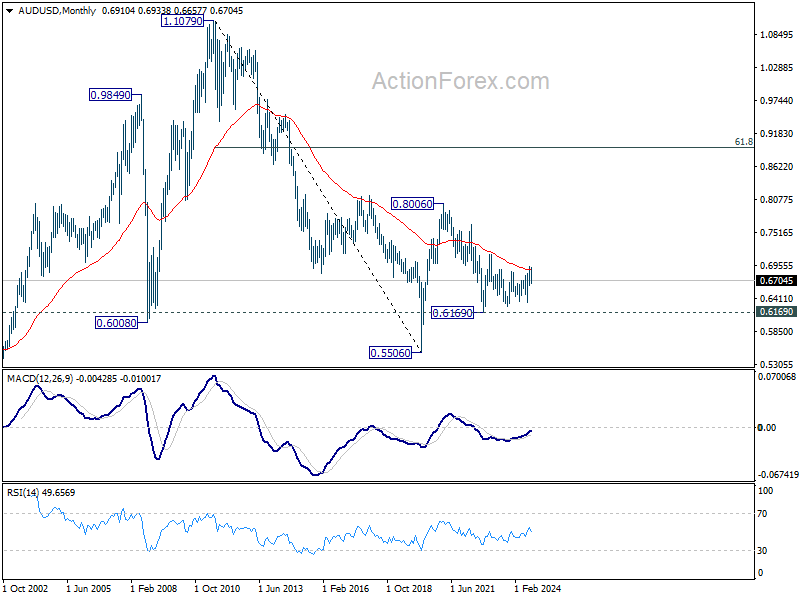
In the long term picture, the down trend from 1.1079 (2011 high) should have completed at 0.5506 (2020 low) already. It's unsure yet whether price actions from 0.5506 are developing into a corrective pattern, or trend reversal. But in either case, fall from 0.8006 is seen as the second leg of the pattern. Firm of 0.7156 resistance will argue that the third leg has already started towards 0.8006.
USD/CAD Weekly Outlook
USD/CAD's rally from 1.3418 continued last week but turned sideway after hitting 1.3837. Initial bias remains neutral this week for consolidations first. Downside of retreat should be contained above 1.3646 resistance turned support. On the upside, break of 1.3837 will target 1.3946/76 key resistance zone.
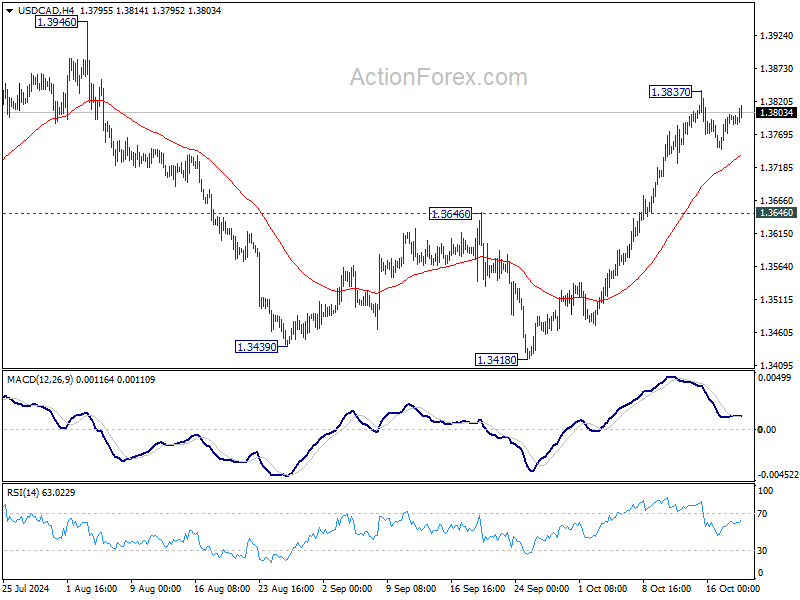
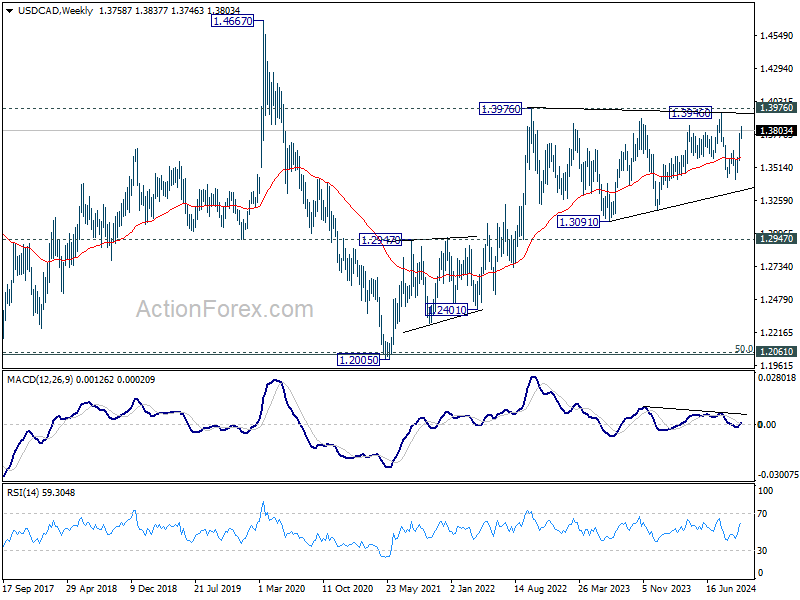
In the bigger picture, sideway consolidation pattern from 1.3976 (2022 high) might still extend further. While another decline cannot be ruled out, strong support should emerge above 1.2947 resistance turned support to bring rebound. Rise from 1.2005 (2021 low) is still in favor to resume at a later stage.
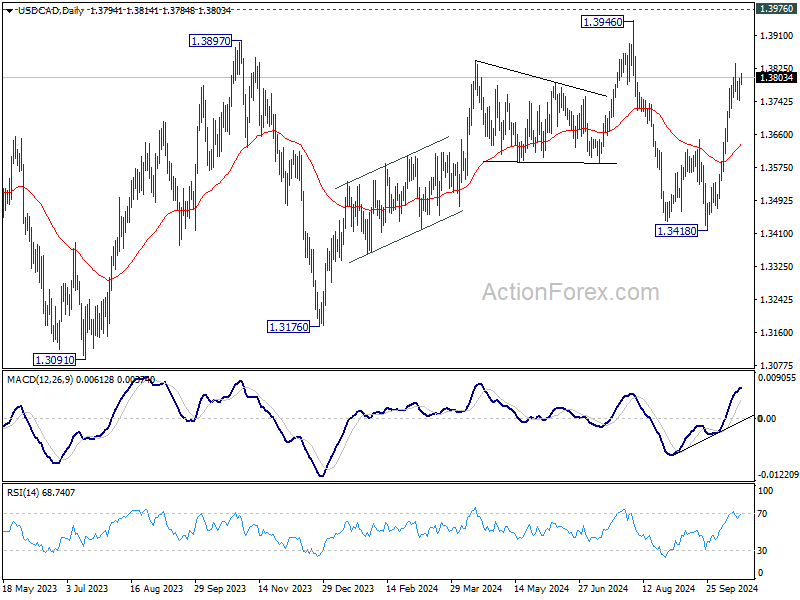
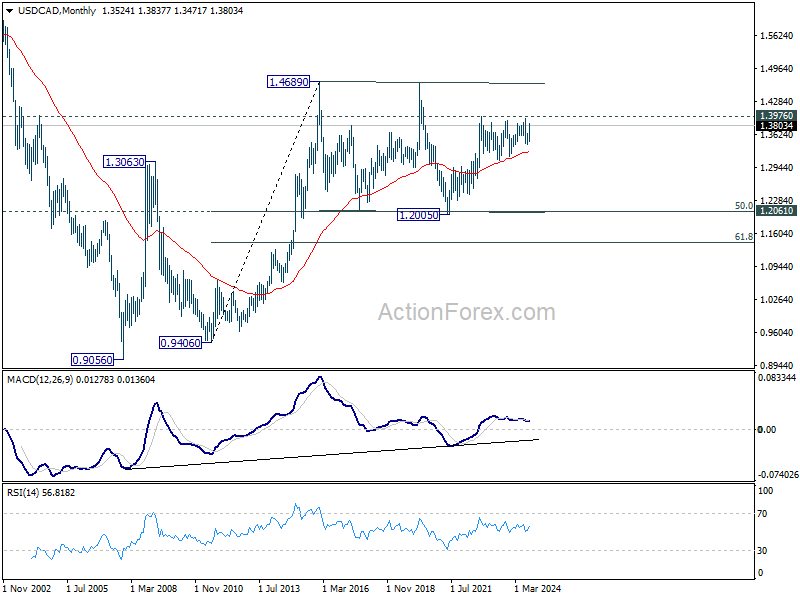
In the longer term picture, price actions from 1.4689 (2016 high) are seen as a consolidation pattern, which might have completed at 1.2005. That is, up trend from 0.9506 (2007 low) is expected to resume at a later stage. This will remain the favored case as long as 1.2947 resistance turned support holds.
GBP/JPY Weekly Outlook
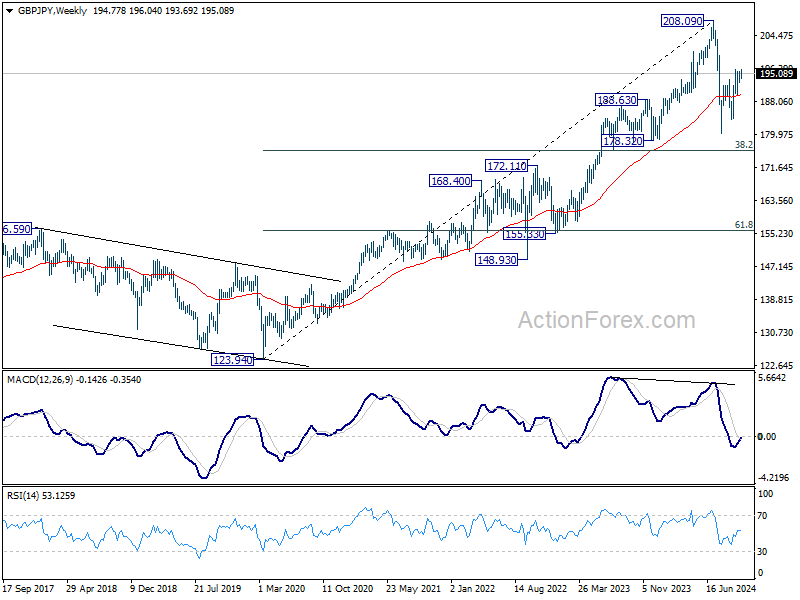
GBP/JPY edged higher last week but failed to break through 195.95 resistance. Initial bias stays neutral this week first. On the upside, break of 195.95 will resume whole rise from 180.00 to 61.8% retracement of 208.09 to 180.00 at 197.35 next. Sustained break there will target 208.09 high. On the downside, below 192.87 minor support will turn bias back to the downside for 189.54 support. Further break there will target 183.70 support.
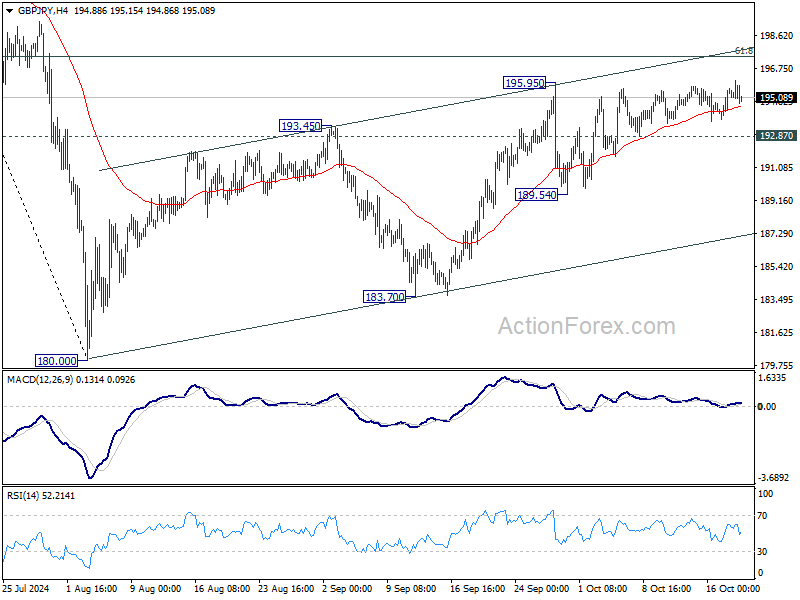
In the bigger picture, price actions from 208.09 are seen as a correction to whole rally from 123.94 (2020 low). The range of consolidation should be set between 38.2% retracement of 123.94 to 208.09 at 175.94 and 208.09. However, decisive break of 175.94 will argue that deeper correction is underway.
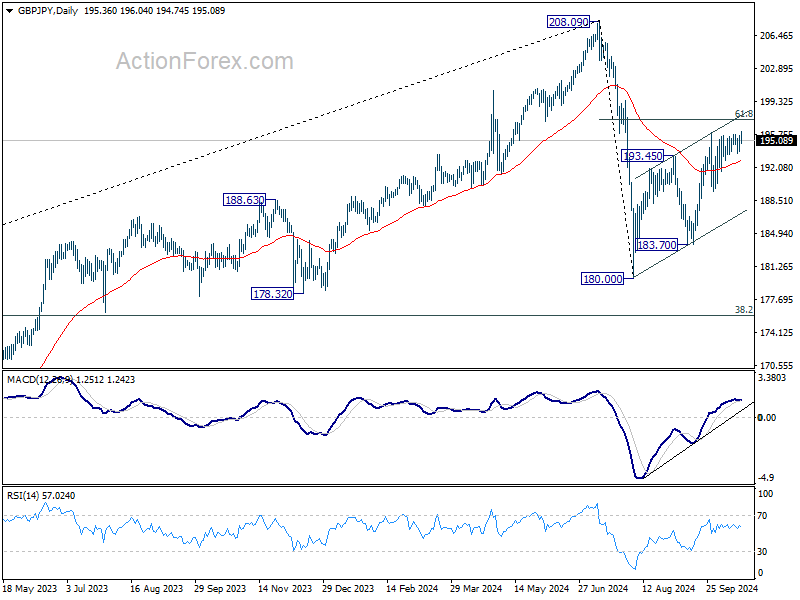
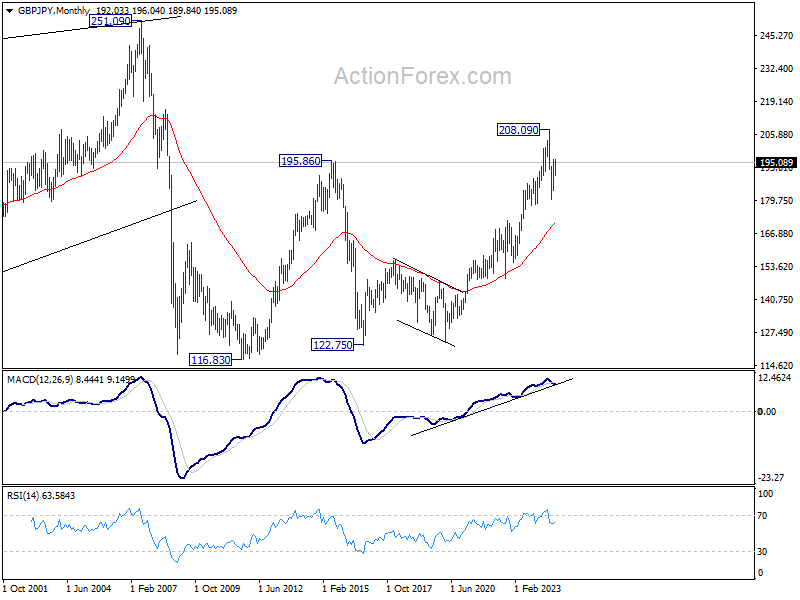
In the longer term picture, considering bearish divergence condition in W MACD, 208.09 is at least a medium term top. It's still early to conclude that the up trend from 122.75 (2016 low) has completed. But it's at least in a medium term corrective phase, with risk of correction to 55 M EMA (now at 171.08).
EUR/JPY Weekly Outlook
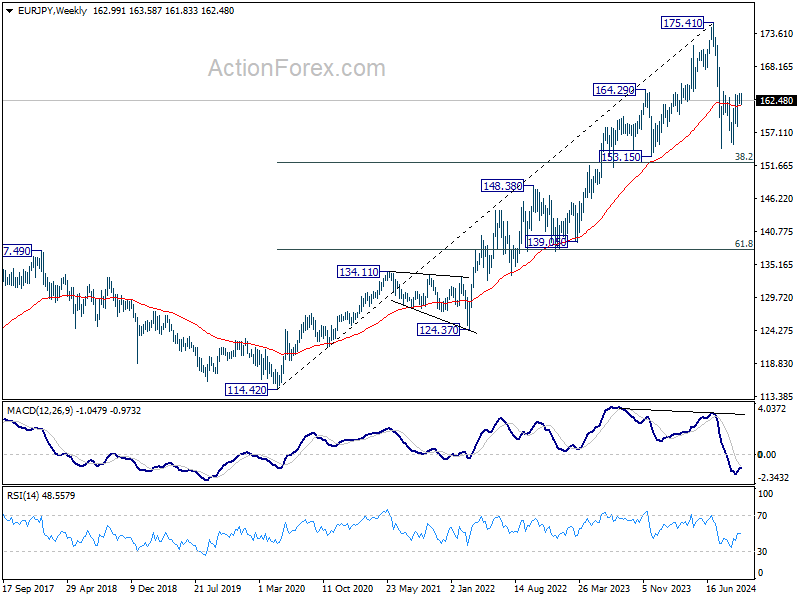
EUR/JPY edged higher last week but failed to break through 163.86 resistance. Initial bias remains neutral this week first. On the upside, firm break of 163.86 resistance will resume the rebound from 154.40 to 61.8% retracement of 175.41 to 154.40 at 167.38. On the downside, break of 161.00 minor support will turn bias back to the downside. Further break of 158.09 will target 154.40/155.14 support zone.
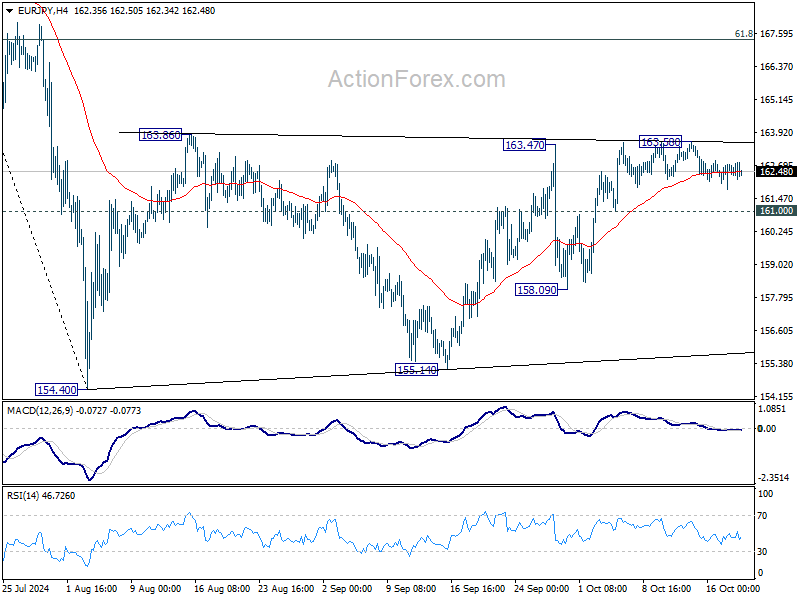
In the bigger picture, price actions from 175.41 are seen as correction to rally from 114.42 (2020 low). The range of consolidation should have been set between 38.2% retracement of 114.42 to 175.41 at 152.11 and 175.41 high. However, decisive break of 152.11 would argue that deeper correction is underway.
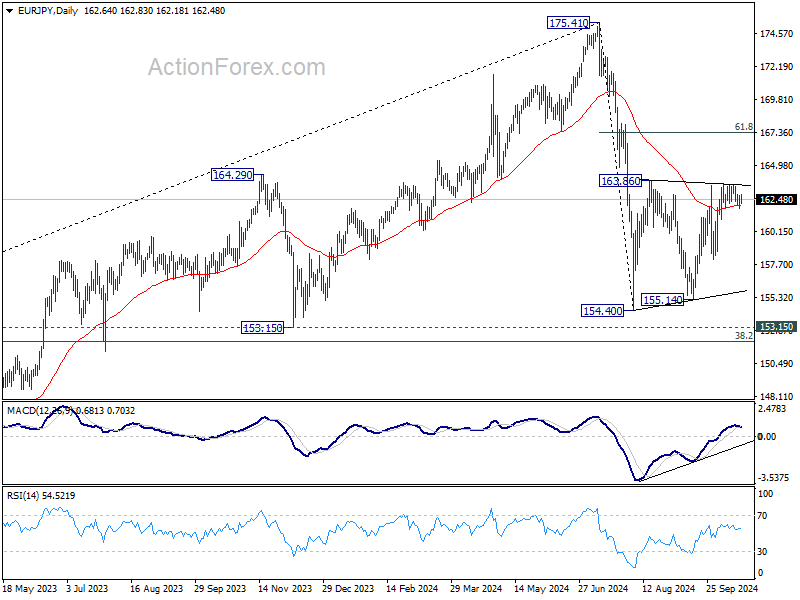
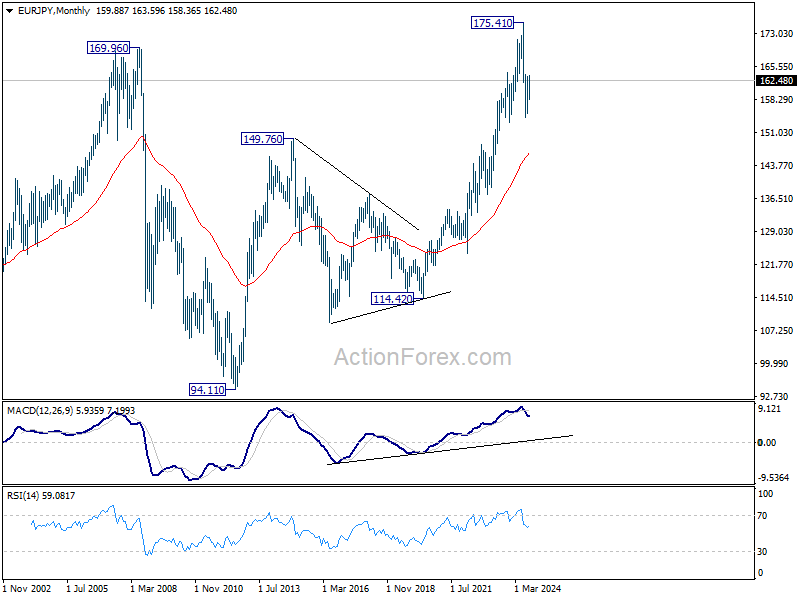
In the long term picture, considering bearish divergence condition in W MACD, 175.41 is at least a medium term top. It's still early to conclude that up trend from 94.11 (2012 low) has completed. But a medium term corrective phase is in progress with risk of deeper fall back to 55 M EMA (now at 146.64).
EUR/GBP Weekly Outlook
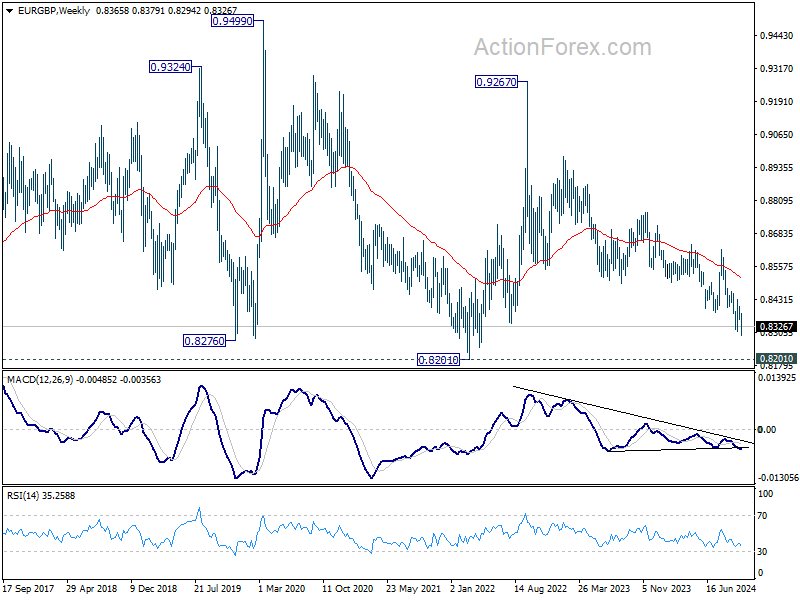
EUR/GBP's down trend resumed by breaking through 0.8309 last week. Initial bias remains on the downside this week for 0.8201 key support next. Strong support could be seen from there to break rebound. But for now, break of 0.8433 resistance is needed to indicate short term bottoming. Otherwise, outlook will stay bearish in case of recovery.
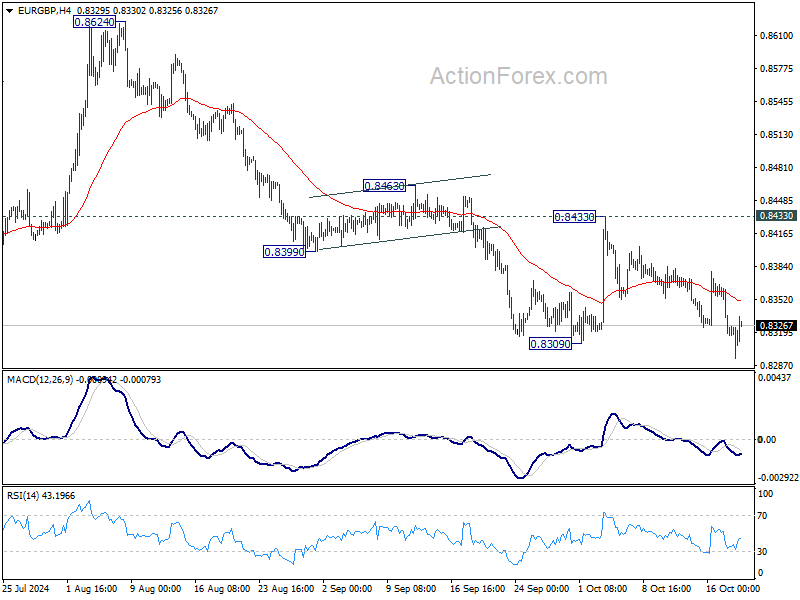
In the bigger picture, down trend from 0.9267 (2022 high) is in progress. Next target is 0.8201 (2022 low), but strong support should be seen there to bring rebound. However, outlook will remain bearish as long as 0.8624 resistance holds even in case of strong rebound. Decisive break of 0.8201 will indicate long term bearish reversal.
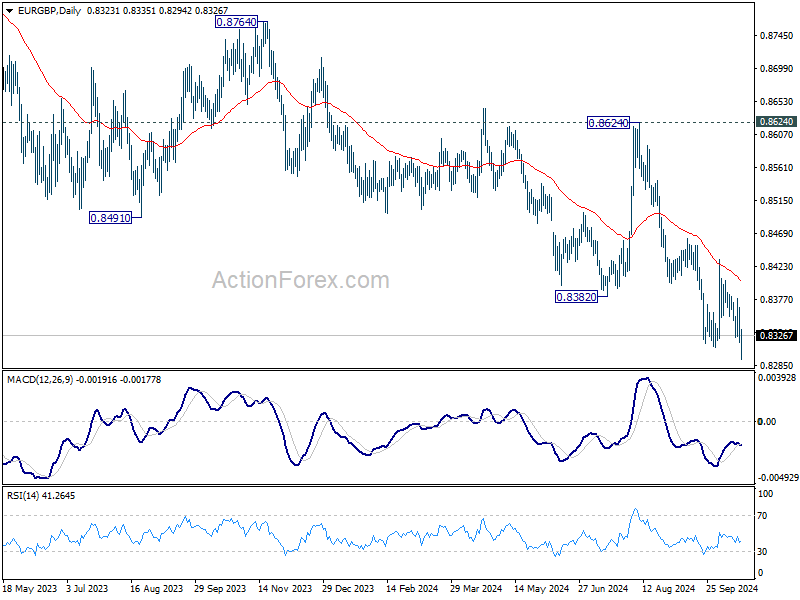
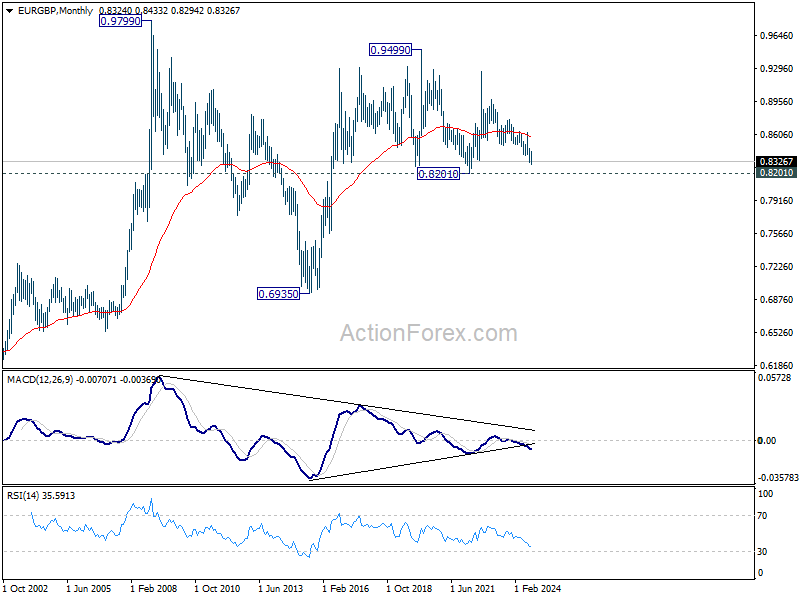
In the long term picture, price action from 0.9499 (2020 high) is seen as part of the long term range pattern from 0.9799 (2008 high). Range trading should continue between 0.8201 and 0.9499, until there is clear signal of imminent breakout.
EUR/AUD Weekly Outlook
EUR/AUD's fall from 1.6351 extended lower last week despite interim recovery. Initial bias stays mildly on the downside for retesting 1.6002 low. On the upside, however, break of 1.6351 will resume the rebound from 1.6002 to 38.2% of 1.7180 to 1.6002 at 1.6452.
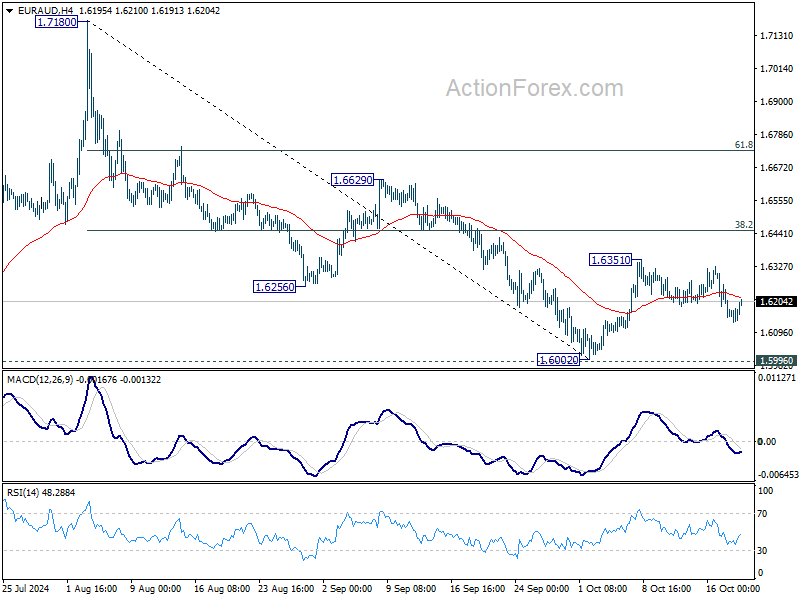
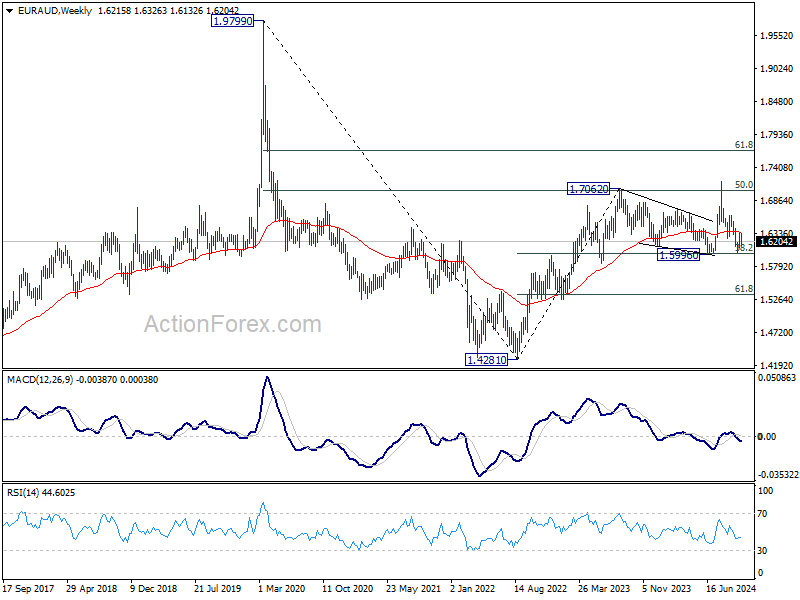
In the bigger picture, as long as 1.5996 cluster support holds (38.2% retracement of 1.4281 to 1.7062 (2023 high) at 1.6000), up trend from 1.4281 (2022 low) is still expected to resume at a later stage. However, decisive break of 1.5996 will argue that the medium term trend has reversed and turn outlook bearish.
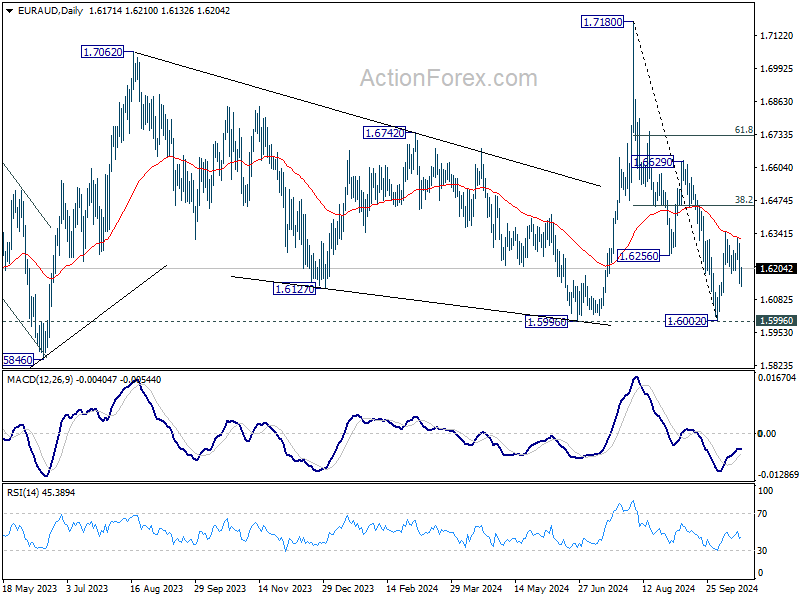
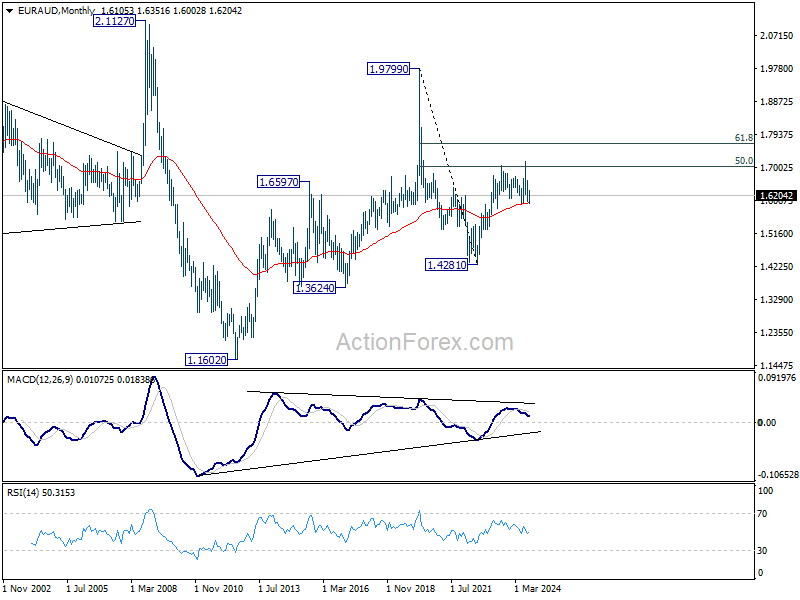
In the longer term picture, rise from 1.4281 is seen as the second leg of the pattern from 1.9799 (2020 high), which is part of the pattern from 2.1127 (2008 high). As long as 55 M EMA (now at 1.6003) holds, this second leg could still extend higher. However, sustained trading below 55 M EMA will open up the bearish case for extending the decline through 1.4281 low.
EUR/CHF Weekly Outlook
No change in EUR/CHF as it remained bounded in converging range last week. Initial bias stays neutral this week first. On the downside, break of 0.9332 will resume the fall from 0.9579 towards 0.9209 low. On the upside, break of 0.9506 will turn intraday bias to the upside for 0.9579 resistance and above.
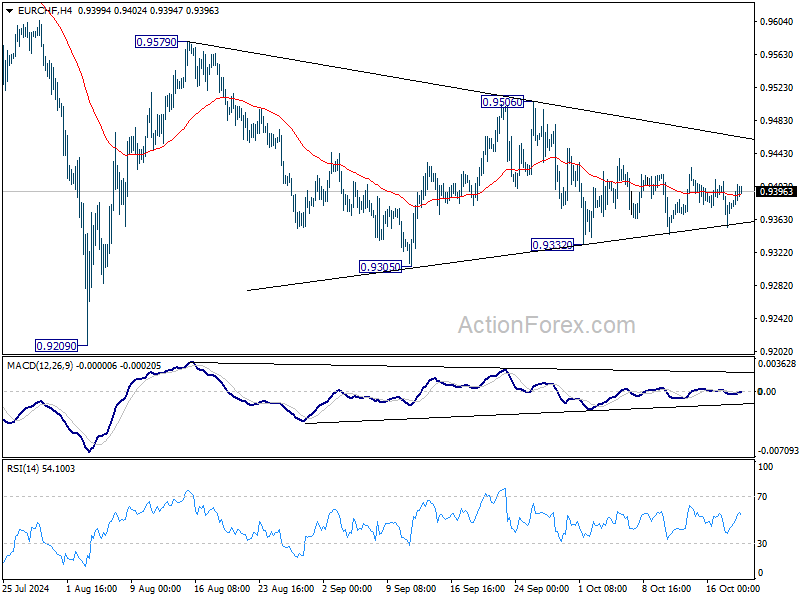
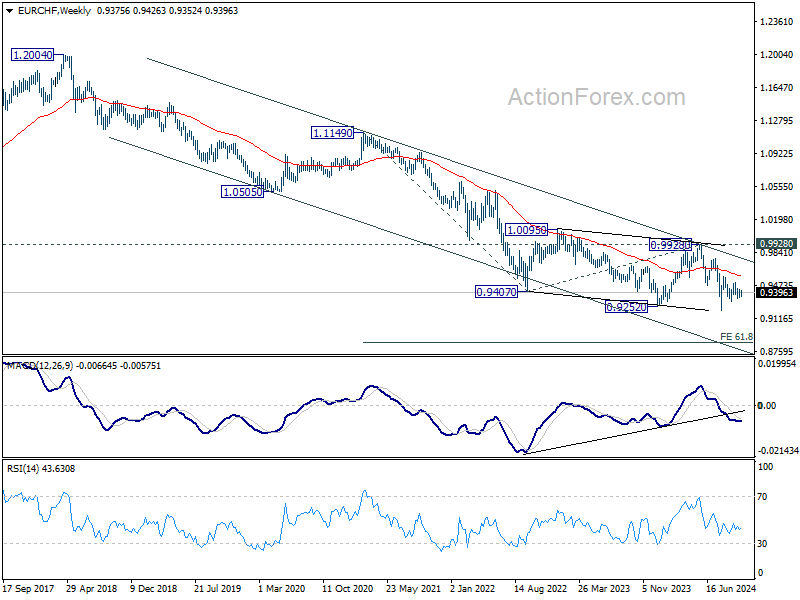
In the bigger picture, fall from 0.9928 is seen as part of the long term down trend. Repeated rejection by 55 D EMA (now at 0.9441) keeps outlook bearish for breaking through 0.9209 low at a later stage. Nevertheless, sustained trading above 55 D EMA will confirm medium term bottoming and bring stronger rebound back towards 0.9928 key resistance.
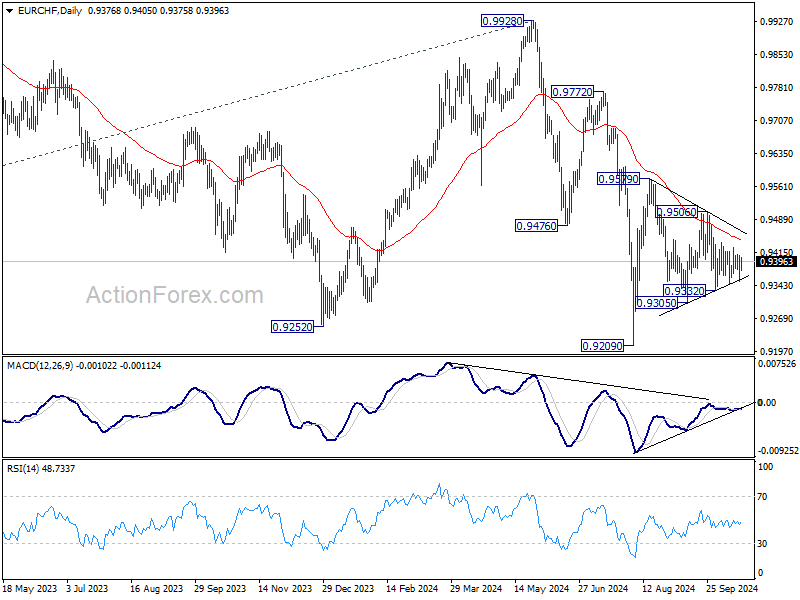
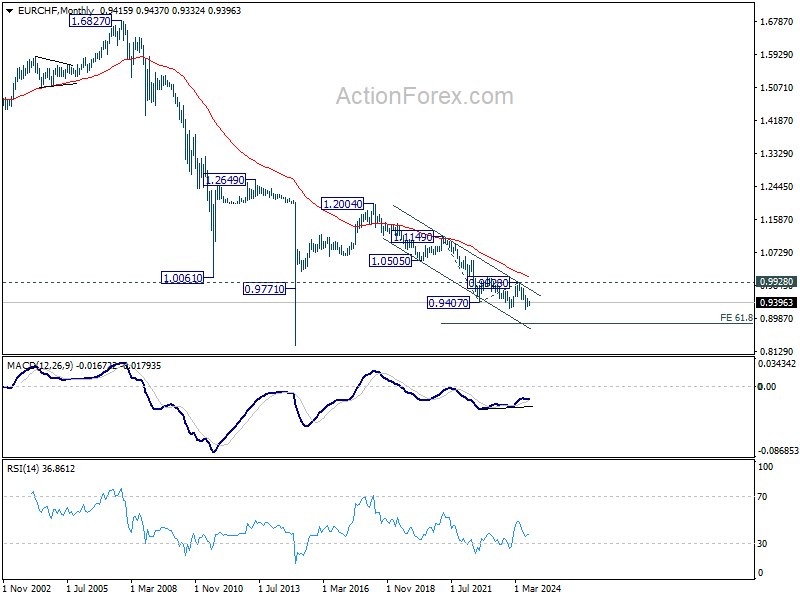
In the long term picture, fall from 1.2004 (2018 high) is part of the multi-decade down trend. Corrective pattern from 0.9407 (2022 low) might have completed with three waves to 0.9928. Decisive break of 0.9252 (2023 low) will confirm long term down trend resumption to 61.8% projection of 1.1149 to 0.9407 from 0.9928 at 0.8851. For now, outlook will stay bearish as long as 0.9928 resistance holds, even in case of strong rebound.
Summary 10/21 – 10/25
Monday, Oct 21, 2024
| GMT | Ccy | Events | Consensus | Previous |
|---|---|---|---|---|
| 01:00 | CNY | 1-Y Loan Prime Rate | 3.15% | 3.35% |
| 01:00 | CNY | 5-Y Loan Prime Rate | 3.65% | 3.85% |
| 06:00 | EUR | Germany PPI M/M Sep | -0.20% | 0.20% |
| 06:00 | EUR | Germany PPI Y/Y Sep | -0.80% | |
| 21:45 | NZD | Trade Balance (NZD) Sep | -2203M |
| GMT | Ccy | Events | |
|---|---|---|---|
| 01:00 | CNY | 1-Y Loan Prime Rate | |
| Forecast: 3.15% | Previous: 3.35% | ||
| 01:00 | CNY | 5-Y Loan Prime Rate | |
| Forecast: 3.65% | Previous: 3.85% | ||
| 06:00 | EUR | Germany PPI M/M Sep | |
| Forecast: -0.20% | Previous: 0.20% | ||
| 06:00 | EUR | Germany PPI Y/Y Sep | |
| Forecast: | Previous: -0.80% | ||
| 21:45 | NZD | Trade Balance (NZD) Sep | |
| Forecast: | Previous: -2203M | ||
Tuesday, Oct 22, 2024
| GMT | Ccy | Events | Consensus | Previous |
|---|---|---|---|---|
| 06:00 | GBP | Public Sector Net Borrowing (GBP) Sep | 10.3B | 13.7B |
| 12:30 | CAD | Industrial Product Price M/M Sep | -0.80% | |
| 12:30 | CAD | Raw Material Price Index Sep | -3.10% |
| GMT | Ccy | Events | |
|---|---|---|---|
| 06:00 | GBP | Public Sector Net Borrowing (GBP) Sep | |
| Forecast: 10.3B | Previous: 13.7B | ||
| 12:30 | CAD | Industrial Product Price M/M Sep | |
| Forecast: | Previous: -0.80% | ||
| 12:30 | CAD | Raw Material Price Index Sep | |
| Forecast: | Previous: -3.10% | ||
Wednesday, Oct 23 2024
| GMT | Ccy | Events | Consensus | Previous |
|---|---|---|---|---|
| 13:45 | CAD | BoC Interest Rate Decision | 3.75% | 4.25% |
| 14:00 | USD | Existing Home Sales Sep | 3.90M | 3.86M |
| 14:00 | EUR | Eurozone Consumer Confidence Oct P | -12 | -13 |
| 14:30 | CAD | BoC Press Conference | ||
| 14:30 | USD | Crude Oil Inventories | -2.2M | |
| 22:00 | AUD | Manufacturing PMI Oct P | 46.7 | |
| 22:00 | AUD | Services PMI Oct P | 50.5 |
| GMT | Ccy | Events | |
|---|---|---|---|
| 13:45 | CAD | BoC Interest Rate Decision | |
| Forecast: 3.75% | Previous: 4.25% | ||
| 14:00 | USD | Existing Home Sales Sep | |
| Forecast: 3.90M | Previous: 3.86M | ||
| 14:00 | EUR | Eurozone Consumer Confidence Oct P | |
| Forecast: -12 | Previous: -13 | ||
| 14:30 | CAD | BoC Press Conference | |
| Forecast: | Previous: | ||
| 14:30 | USD | Crude Oil Inventories | |
| Forecast: | Previous: -2.2M | ||
| 22:00 | AUD | Manufacturing PMI Oct P | |
| Forecast: | Previous: 46.7 | ||
| 22:00 | AUD | Services PMI Oct P | |
| Forecast: | Previous: 50.5 | ||
Thursday, Oct 24, 2024
| GMT | Ccy | Events | Consensus | Previous |
|---|---|---|---|---|
| 00:30 | JPY | Manufacturing PMI Oct P | 49.8 | 49.7 |
| 00:30 | JPY | Services PMI Oct P | 53.1 | |
| 07:15 | EUR | France Manufacturing PMI Oct P | 45.1 | 44.6 |
| 07:15 | EUR | France Services PMI Oct P | 50 | 49.6 |
| 07:30 | EUR | Germany Manufacturing PMI Oct P | 40.9 | 40.6 |
| 07:30 | EUR | Germany Services PMI Oct P | 50.7 | 50.6 |
| 08:00 | EUR | Eurozone Manufacturing PMI Oct P | 45.4 | 45 |
| 08:00 | EUR | Eurozone Services PMI Oct P | 51.5 | 51.4 |
| 08:30 | GBP | Manufacturing PMI Oct P | 51.4 | 51.5 |
| 08:30 | GBP | Services PMI Oct P | 52.2 | 52.4 |
| 12:30 | USD | Initial Jobless Claims (Oct 18) | 245K | 241K |
| 13:45 | USD | Manufacturing PMI Oct P | 48.2 | 47.3 |
| 13:45 | USD | Services PMI Oct P | 54.9 | 55.2 |
| 14:00 | USD | New Home Sales Sep | 713K | 716K |
| 14:30 | USD | Natural Gas Storage | 76B | |
| 23:30 | JPY | Tokyo CPI Y/Y Oct | 2.20% | |
| 23:30 | JPY | Tokyo CPI Core Y/Y Oct | 1.70% | 2.00% |
| 23:30 | JPY | Tokyo CPI Core-Core Y/Y Oct | 1.60% | |
| 23:50 | JPY | Corporate Service Price Index Y/Y Sep | 2.70% | 2.70% |
| GMT | Ccy | Events | |
|---|---|---|---|
| 00:30 | JPY | Manufacturing PMI Oct P | |
| Forecast: 49.8 | Previous: 49.7 | ||
| 00:30 | JPY | Services PMI Oct P | |
| Forecast: | Previous: 53.1 | ||
| 07:15 | EUR | France Manufacturing PMI Oct P | |
| Forecast: 45.1 | Previous: 44.6 | ||
| 07:15 | EUR | France Services PMI Oct P | |
| Forecast: 50 | Previous: 49.6 | ||
| 07:30 | EUR | Germany Manufacturing PMI Oct P | |
| Forecast: 40.9 | Previous: 40.6 | ||
| 07:30 | EUR | Germany Services PMI Oct P | |
| Forecast: 50.7 | Previous: 50.6 | ||
| 08:00 | EUR | Eurozone Manufacturing PMI Oct P | |
| Forecast: 45.4 | Previous: 45 | ||
| 08:00 | EUR | Eurozone Services PMI Oct P | |
| Forecast: 51.5 | Previous: 51.4 | ||
| 08:30 | GBP | Manufacturing PMI Oct P | |
| Forecast: 51.4 | Previous: 51.5 | ||
| 08:30 | GBP | Services PMI Oct P | |
| Forecast: 52.2 | Previous: 52.4 | ||
| 12:30 | USD | Initial Jobless Claims (Oct 18) | |
| Forecast: 245K | Previous: 241K | ||
| 13:45 | USD | Manufacturing PMI Oct P | |
| Forecast: 48.2 | Previous: 47.3 | ||
| 13:45 | USD | Services PMI Oct P | |
| Forecast: 54.9 | Previous: 55.2 | ||
| 14:00 | USD | New Home Sales Sep | |
| Forecast: 713K | Previous: 716K | ||
| 14:30 | USD | Natural Gas Storage | |
| Forecast: | Previous: 76B | ||
| 23:30 | JPY | Tokyo CPI Y/Y Oct | |
| Forecast: | Previous: 2.20% | ||
| 23:30 | JPY | Tokyo CPI Core Y/Y Oct | |
| Forecast: 1.70% | Previous: 2.00% | ||
| 23:30 | JPY | Tokyo CPI Core-Core Y/Y Oct | |
| Forecast: | Previous: 1.60% | ||
| 23:50 | JPY | Corporate Service Price Index Y/Y Sep | |
| Forecast: 2.70% | Previous: 2.70% | ||
Friday, Oct 25, 2024
| GMT | Ccy | Events | Consensus | Previous |
|---|---|---|---|---|
| 08:00 | EUR | Germany IFO Business Climate Oct | 85.4 | 85.4 |
| 08:00 | EUR | Germany IFO Current Assessment Oct | 84.1 | 84.4 |
| 08:00 | EUR | Germany IFO Expectations Oct | 86.6 | 86.3 |
| 08:00 | EUR | EurozoneM3 Money Supply Y/Y Sep | 3.00% | 2.90% |
| 12:30 | CAD | Retail Sales M/M Aug | 0.60% | 0.90% |
| 12:30 | CAD | Retail Sales ex Autos M/M Aug | 0.30% | 0.40% |
| 12:30 | CAD | New Housing Price Index M/M Sep | 0.10% | 0.00% |
| 12:30 | USD | Durable Goods Orders Sep | -0.90% | 0.00% |
| 12:30 | USD | Durable Goods Orders ex Transport Sep | -0.10% | 0.50% |
| 14:00 | USD | Michigan Consumer Sentiment Oct F | 68.9 | 68.9 |
| GMT | Ccy | Events | |
|---|---|---|---|
| 08:00 | EUR | Germany IFO Business Climate Oct | |
| Forecast: 85.4 | Previous: 85.4 | ||
| 08:00 | EUR | Germany IFO Current Assessment Oct | |
| Forecast: 84.1 | Previous: 84.4 | ||
| 08:00 | EUR | Germany IFO Expectations Oct | |
| Forecast: 86.6 | Previous: 86.3 | ||
| 08:00 | EUR | EurozoneM3 Money Supply Y/Y Sep | |
| Forecast: 3.00% | Previous: 2.90% | ||
| 12:30 | CAD | Retail Sales M/M Aug | |
| Forecast: 0.60% | Previous: 0.90% | ||
| 12:30 | CAD | Retail Sales ex Autos M/M Aug | |
| Forecast: 0.30% | Previous: 0.40% | ||
| 12:30 | CAD | New Housing Price Index M/M Sep | |
| Forecast: 0.10% | Previous: 0.00% | ||
| 12:30 | USD | Durable Goods Orders Sep | |
| Forecast: -0.90% | Previous: 0.00% | ||
| 12:30 | USD | Durable Goods Orders ex Transport Sep | |
| Forecast: -0.10% | Previous: 0.50% | ||
| 14:00 | USD | Michigan Consumer Sentiment Oct F | |
| Forecast: 68.9 | Previous: 68.9 | ||
Markets Weekly Outlook – PMI Data and IMF Meeting Dominate the Agenda
- Global markets are reacting to shifts in central bank policies, with the US dollar strengthening and rate cut expectations changing.
- The upcoming week will be busy with the IMF meeting, PMI data releases, central bank announcements, and US earnings reports.
- The US Dollar Index is in focus as technical factors may play a more significant role in its movement amidst a lighter data week.
Week in Review: US Earnings Surprise and Gold Hits Fresh Highs
The week drew to a close with fresh highs for the S&P 500 and Gold while US earnings continued on its impressive path. As markets digest US earnings, rate cut bets in the US remain steady from a week ago. Markets are still pricing in around a 92.3% chance of a 25 bps cut from the Fed in November, up from 89.5% last week.
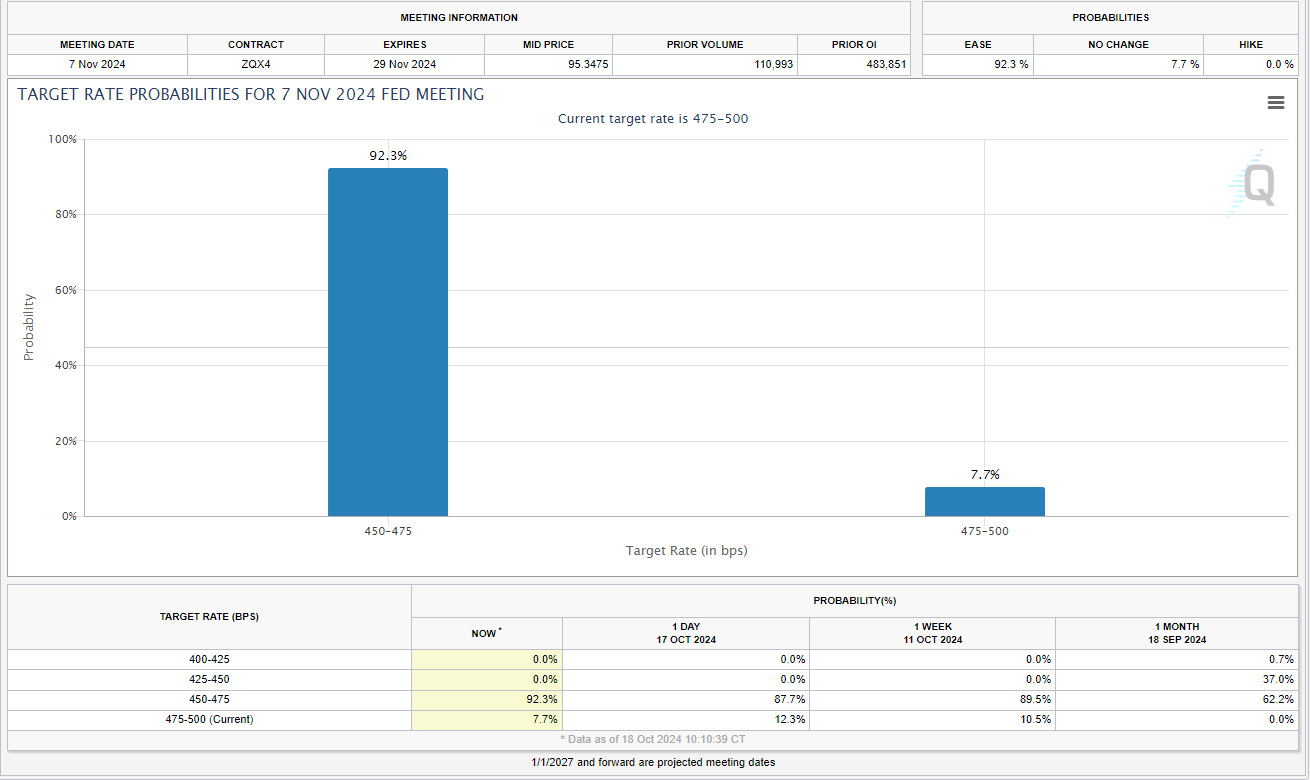
Source: SME FedWatch Tool
On the whole, the week itself was a bit of a hit and miss with quite a bit of choppy price action in the early part of the week. However, UK data and the ECB interest rate meeting have seen markets face up to the fact that the global rate environment is set for a correction. The Bank of England (BoE) which was expected to see its policy diverge from the Fed and ECB has found itself in the spotlight as softer inflation figures ramped up rate cut expectations.
The impact of this realization saw the UD Dollar emerge as the front-runner for the week once more. The greenback continued its impressive run of late as we approached the US elections in November.
Looking at fellow commodities and metals, Oil prices continued its slide this week. Softer data globally and renewed concerns around Chinese growth saw both OPEC + and the IEA downgrade their forecasts once more. Silver breached the 32.00 handle and similar to gold, analysts are predicting a further 12 months of bullish price action with a target price for silver set at $45/oz..
The FX front, as mentioned the US Dollar continued its rise this week. The Japanese Yen experienced whiplash price action as news filtered through of a possible rate hike which was immediately rebuked by the BoJ.
Bitcoin has enjoyed a renaissance this week with the world’s largest cryptocurrency having risen to trade at 68500 at the time of writing. This leaves the world’s largest cryptocurrency just 8% of its all-time highs.
The Week Ahead: US Earnings, IMF Meeting, Central Banks and PMI
The week ahead is a busy one underlined by the IMF meeting taking place in Washington next week. This is but one pillar of what is shaping up to be a busy week for markets across the globe.
We have PMI data from a host of countries, a couple of Central Bank meetings, US earnings and geopolitical developments to consider. One has to wonder which event may deliver the greatest impact where markets are concerned and that is a tough question to answer.
Asia Pacific Markets
In Asia, the week is quiet following a busy period that culminated with a data dump from China this week. The biggest event in Asia will likely be Tokyo inflation data. Given the mixed rhetoric around rate hikes by the Bank of Japan (BoJ), the inflation data could meaningfully influence the timing of the Bank of Japan’s next move.
Australia and New Zealand will also be enjoying a quiet week with both countries likely to be affected by external factors in the week ahead. There is a speech by RBNZ Governor Adrian Orr which could affect the NZD.
Europe + UK + US
In developed markets, the European Central Bank has seen an increase in the probability of a 50 bps cut in December as much as they have tried to avoid it. Growth in the Euro Area has become a key area of focus and that makes next week a big one as PMIs will be crucial for the eurozone.
Since May, the composite PMI has generally been declining, except for a temporary boost in August due to the Olympics. September’s reading fell below 50, indicating contraction and heightening fears of a potential recession. While these fears might be exaggerated, an economic slowdown seems likely. The October figures will reveal if there’s any improvement; if not, concerns about a slowdown will intensify. Poor PMIs could send the Euro spiraling lower as market participants are likely to increase bets on a 50 bps rate cut.
The UK has just come off a week that has shifted the narrative for the Bank of England. A significant slowdown in inflation, more importantly services inflation and rate cuts are back on. Service PMIs have been gradually declining, aligning with slower growth rates in the year’s second half. If this trend persists, coupled with the recent slowdown in services inflation, the BoE might accelerate its rate cuts. Keep an eye out for any indications of this during Governor Bailey’s appearances in Washington next week.
The US data calendar is pretty bare next week with the Fed’s beige book being the biggest event. I expect we will hear more chatter from Federal Reserve Policymakers which could add volatility to markets. It will be interesting to gauge if the US Dollar can hold onto recent gains.
Canada will enjoy a bigger week with the Bank of Canada (BoC) rate decision expected on Wednesday. The market expects a big change due to low inflation and weaker activity, but I think the decision will be tight, with most officials cautious about moving too quickly. Markets are pricing in a 91.4% chance that the BoC will deliver a 50 bps cut.
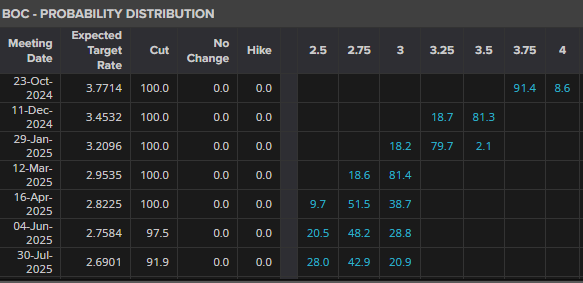
Source: LSEG Refinitiv
Geopolitical developments and US earnings could have a major impact next week. I would also say that any comments from Central Bank Governors at the IMF may be worth paying attention to as policy rates remain a hot topic globally.
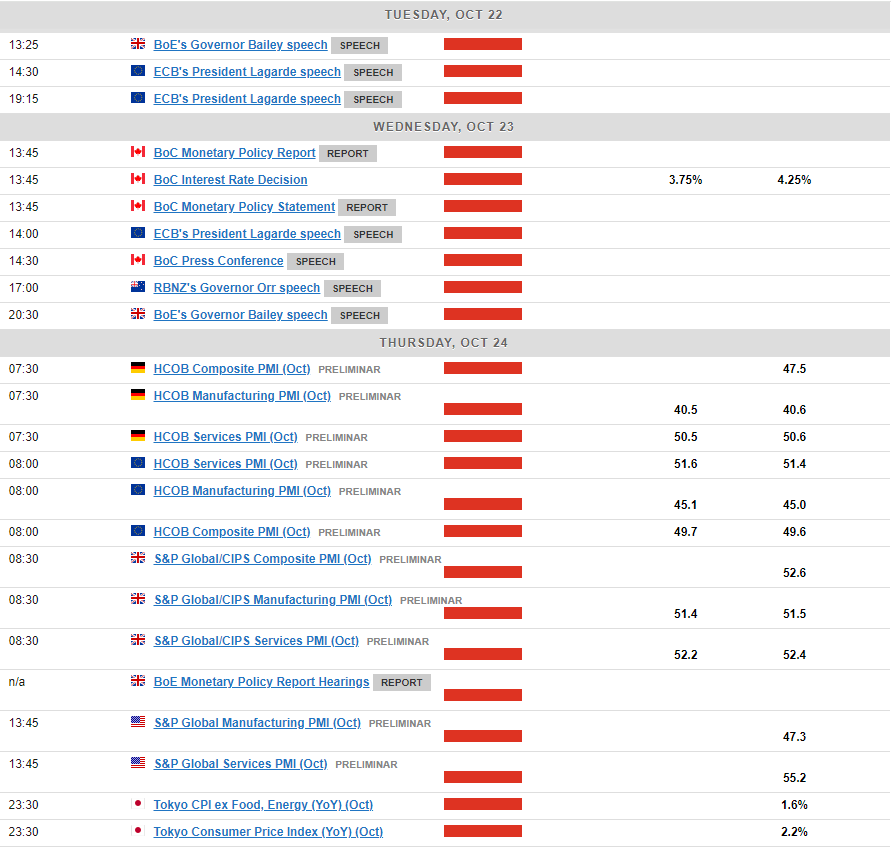
Chart of the Week
This week’s focus is back on the US Dollar Index (DXY) as we have a lack of data which could mean the technicals become more important.
Having enjoyed a stellar rally the DXY appears to have finally found resistance at the 200-day MA. There are signs that point to a retracement but given the overarching macro economic outlook the downside might be limited. The Fed are now expected to cut less than the BoE and the ECB which is contributing to the USD rise over the month of October. The RSI on the daily has now flashed a potential sell signal having broken back below the 70 level from overbought territory. This is usually a sign of shifting momentum and that a drop in price may continue.
The DXY is also caught between the 100 and 200-day MA with the 100-day MA likely to serve as a key support area around 103.180.A break below this support level could open up a retest of 102.65 and potentially 102.100.
Now a break above the 200-day MA remains possible and could open up a run toward the 104.oo and 104.50 handle.
US Dollar Index Daily Chart – October 18, 2024
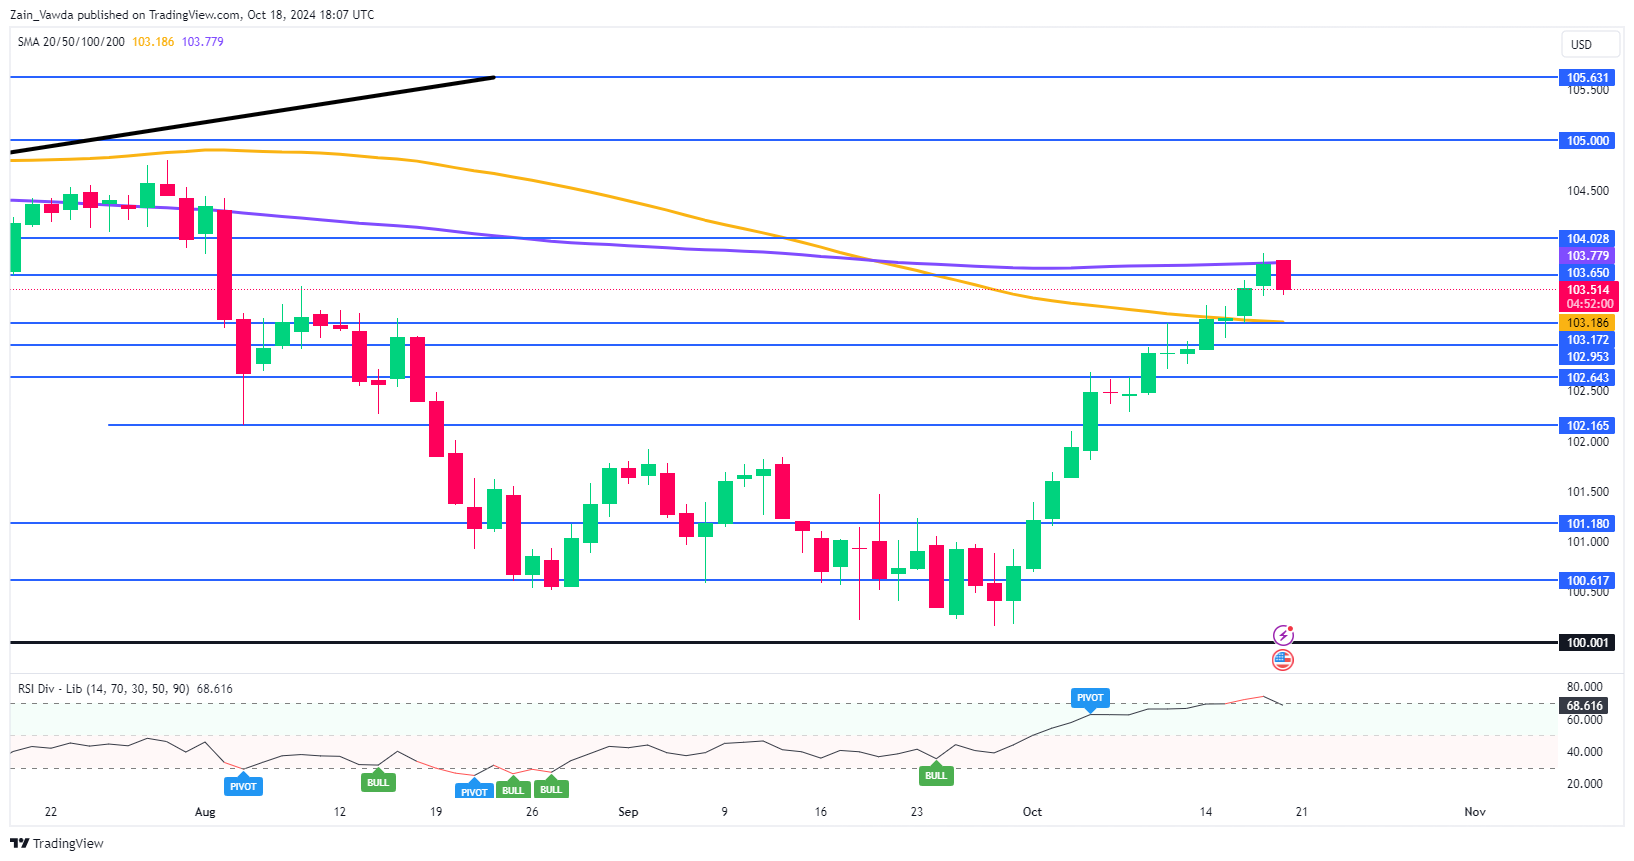
Source:TradingView.Com (click to enlarge)
Key Levels to Consider:
Support:
- 103.18
- 102.65
- 102.00
Resistance:
- 104.00
- 104.50
- 105.00
- 105.63
The Weekly Bottom Line: Canadian Inflation Drops Below Target
U.S. Highlights
- The retail sales report once again reinforced the message that the U.S. consumer continues to brush off headwinds.
- Personal income growth, some remaining pandemic savings, and a healthy labor market should help to support trend-like growth in personal consumption expenditures into early 2025.
- A still healthy labor market, and a commitment to data dependency means a measured and deliberate approach to interest rate reductions.
Canadian Highlights
- Canadian inflation made headlines this week with a big downwards move, pushing below the central bank’s 2% target.
- The housing market is starting to stir, with resale activity jumping in September. At the same time, listings have surged, as sellers test out the market following nearly two years of housing market uncertainty.
- The easing in inflation has raised odds that the BoC follows the Fed with an outsized 50 basis point cut at its policy meeting next week.
U.S. – Slow and Steady
U.S. Treasury yields were on the rise again this week (Chart 1) as a brighter picture of the consumer pared back rate cut bets. The September retail sales report once again reinforced the message that the consumer continues to plow ahead, brushing off headwinds from higher rates and two years’ worth of rapid cost-of-living increases. Policymakers and markets continue to assess that interest rates need to fall further, but the timing and level of where they ultimately land remains hotly debated.
Data are streaming in and showing consumers, the backbone of the U.S. economy, are willing and able to spend on goods and services at a healthy pace. Retail sales figures for September rose 0.4% month-on-month, beating out economists’ expectations. Moreover, the “control group” of less volatile expenditure categories surged 0.7% for the month as spending on clothing, personal care and miscellaneous goods surged. With stronger than expected economic news, bond yields surged, rising 6 basis points (bps) through Thursday’s close.
The print suggests plenty of momentum in consumption expenditures into the third quarter, providing a fillip to GDP growth. However, strong doesn’t mean that monetary policy isn’t exerting pressure on households. Sales of motor vehicle dealers were down marginally, as were expenditures on furniture and electronics stores (Chart 2). These categories of goods are more interest rate sensitive, leaving them most susceptible to the still elevated interest rate environment.
However, as we noted this week, the recent upward revision to personal income means households are still holding excess savings that can be deployed. While the funds are mostly concentrated among higher income households that are less likely to spend, their availability means that demand for durable goods could rise as interest rates slowly fall. This sentiment was echoed by Fed Governor Waller this week, when he noted that his “business contacts believe that there is considerable pent-up demand for durable goods, home improvements and other big-ticket items”.
While the labor market is gradually rebalancing, personal income growth is still robust and some remaining pandemic savings should help to support trend-like growth in personal consumption expenditures into early 2025. Carefully balancing strong growth and a healthy labor market against the risks of a flare-up in inflation will likely leave the Fed adopting a relatively cautious and data dependent approach to interest rates – caution Governor Waller reiterated stating, “monetary policy should proceed with more caution on the pace of rate cuts than was needed at the September meeting.”
Policy remains highly restrictive, and more easing is on the way. A still healthy labor market, and a commitment to data dependency means a measured and deliberate approach to policy. This leaves us thinking the Fed will deliver two more quarter point cuts through 2024.
Canada – Canadian Inflation Drops Below Target
It was a busy data week ahead of the Bank of Canada’s (BoC) upcoming policy meeting. Canadian Consumer Price Index (CPI) inflation made headlines with a big downwards move in September, pushing below the central bank’s 2% target (Chart 1). We also got another reading on the housing market, which is starting to show signs of life in response to recent rate cuts. Financial markets have responded, pricing a higher likelihood that the BoC will swing for a larger 50 bp cut.
Headline inflation clocked in at 1.6% year-on-year (y/y) in September, reaching below the central bank’s target for the first time since early 2021. While this drop was expected given September’s 7% monthly drop in gasoline prices, it speaks to the impact of the central bank’s hiking cycle on the Canadian economy. The interest sensitive goods category is firmly in deflation at -1% y/y, whereas inflation excluding the impact of shelter prices is running at just 0.4% y/y.
In terms of core inflation, the average of the BoC’s two metrics is holding steady at 2.4% y/y. Encouragingly, the three-month annualized pace of core eased to 2.1% (from 2.3% in August). This points to further improvement in the annual pace of core inflation in the coming months. Further adding to this narrative is the fact that other measures of core inflation – CPI excluding food and energy and the BoC’s old core measure (CPIX) – are sitting at 1.6% on a three-month basis. This cements the need for more rate cuts.
The biggest beneficiary from the BoC’s easing cycle is typically the housing market. While the market response to rate cuts hasn’t come to a boil like many would have expected, it is starting to stir. Housing sales jumped nearly 2% in September and are up 6% since rate cuts started in June. But at the same time, listings are up over 9%, as sellers test out the market following nearly two years of housing market uncertainty. This has the sales-to-listings ratio on the decline, which has limited the potential acceleration in house price growth (Chart 2). We expect this to give way in the coming months once the recent wave of listings has been cleared. This should jolt the housing market, pushing sales and prices higher.
That brings us to the BoC’s policy decision next week. The bank has executed three straight cuts of 25 bps, highlighting the need to help economic growth reaccelerate and avoid a hard landing. The argument for a 25 bp cut is that there is still clear strength coming from the jobs market, with wage growth running well above inflation. This will support consumer spending, which we think is starting to accelerate heading into the holiday shopping season. Now, the case for a 50 bp move is coming from the fact that Q3 GDP growth is tracking well below the BoC’s forecast (even if it should rebound in Q4) and headline inflation is below target. The central bank will have to downgrade its forecast for both on Wednesday and can use this as cover to justify a 50. Despite market pricing shifting towards 50 bps, we still think 25 bps is the right move given the arguments above. Next week’s decision is turning out to be a nail biter, but either way, rates will continue to head lower.