
Sample Category Title
Weekly Focus – ECB Delivers a Lot of Words and Little Guidance
ECB's widely anticipated 25bp rate cut did not end up rocking the markets, as Lagarde delivered little concrete guidance on what the central banks' next steps will be. Markets saw her remarks slightly on the dovish side, as she noted inflation risks 'may' be slightly tilted to the downside. Over the past weeks, continuing weakness in PMIs, downside surprise in September HICP and declines in markets' inflation expectations have all supported the case for faster easing and current market pricing implies even a modest 20% probability of a larger 50bp cut in December. Pace of cuts in 2025 remains uncertain as well, but we stick to our call for quarterly 25bp reductions, which would set the deposit rate at 2.00% by the end of next year. Read more from our full ECB Review, 17 October.
Prediction markets have continued to signal rising probability of Donald Trump clinching victory in the upcoming US elections. At the time of writing, Polymarket sees odds of Trump's win at nearly 61%. Republican 'clean sweep' is seen as the most likely total outcome with 43% probability, followed by a Harris win with a divided Congress at 24%. That said, the latest swing state polls signal the race remains closer than prediction market odds suggest, according to RealClearPolitics. Trump is in the lead in all the seven most important swing states, but in 5/7 states, he leads by less than 1 percentage point, which falls well within typical margins of error (usually 2-4%).
Either way, we think a Republican sweep could provide near-term support for US equities and the broad USD, and especially the latter remained on a strong footing this week. US September retail sales came out on the strong side of expectations, with control group sales (which strip away the most volatile categories) growing +0.7% m/m SA. Unusually positive seasonal adjustment might have distorted the monthly growth figure higher - in non-seasonally adjusted y/y terms growth cooled down to 2.7% (from 3.9%). But even so, it seems US consumer spending remains on a healthy footing. We discussed possible near-term distortions to US data releases in RtM USD - Not too hot, not too cold, 15 October.
Chinese Q3 GDP growth was slightly stronger than expected at 4.6% y/y (from 4.7%), but make no mistake, latest data continues to underpin the story of weakening momentum in consumer spending. CPI data from last weekend showed price pressures still hovering near deflation, latest export and credit growth figures were weaker than expected and housing market shows no real signs of recovery with very weak sales volumes and declining prices. All-in-all, we think the latest round of data underscores the need for much stronger stimulus going forward, Finance Ministry's press conference last Saturday still lacked clear details on what to expect on the fiscal stimulus front.
Next week will be calm before the storm of US elections, nonfarm payrolls and FOMC meeting all within the first week of November. Main data focus will be on October flash PMIs on Thursday, which will likely signal continuing contraction in manufacturing activity and modest growth in services on both sides of the Atlantic. Chinese Loan Prime Rates will likely be cut by 20bp on Monday following a 30bp cut to the 1-year Medium Term Lending facility rate earlier. FOMC participants will also have their final chances to provide guidance next week ahead of blackout starting on Saturday 26 October.
Gold (XAU/USD) Price Smashes Through $2700/oz – Further Gains Ahead?
- Gold prices surged past $2700/oz fueled by expectations of global rate cuts and escalating geopolitical tensions in the Middle East.
- The London Bullion Market Association’s bullish prediction of $2941/oz gold price in 12 months.
- Technically, gold is overbought, but the threat of an Israeli strike on Iran could limit downside risks.
Gold prices advanced further overnight gaining acceptance above the $2700/oz as global rate cut bets intensified. The killing of Hamas Political Bureau leader and of the masterminds behind the October 7 attacks Yahya Sinwar had raised expectations of an escalation in the Middle East conflict, but the precious metal was already well on its way to fresh highs.
Currently, a mix of factors is fueling the gold rally. Despite the strengthening US dollar, gold prices continue to climb. Economic data from the UK and the ECB’s interest rate meeting have boosted expectations for rate cuts worldwide, enhancing gold’s attractiveness. Lower global interest rates reduce the opportunity cost of holding this non-yielding precious metal and could keep the rally moving forward.
A bullish take from the London Bullion Market Association who conducted a poll recently further adds credence to the idea that Gold prices may not be done just yet. The poll was to predict the price of Gold in 12 months time with the association seeing prices at $2941/oz.
The US election is nearing as well and uncertainty continues around the next US President. This could be another reason the appeal of safe haven continues to grow.
Technical Analysis Gold (XAU/USD)
From a technical analysis standpoint, Gold has been difficult to analyze with the lack of price action.
Gold bears may have been hoping for some headwinds from US data but that has not materialized as housing data disappointed. This has led to some USD weakness, which in theory should aid Gold prices. .
The concern for bulls lies in the fact that the RSI is now in overbought territory on the four-hour, daily and weekly charts. That coupled with the potential for profit taking before the end of the day leaves me slightly concerned. However, the threat of a retaliatory strike by Israel on Iran has strengthened as Israeli officials commented today a strike is imminent. This is something that could limit downside ahead of the weekend and into next week as well.
Immediate support rests at 2700 before the 2685 and 2673 handles come into focus.
Conversely, looking at the upside and immediate resistance rests at today’s high print around 2717 before 2725 and 2750 come into focus.
GOLD (XAU/USD) Four-Hour (H4) Chart, October 18, 2024
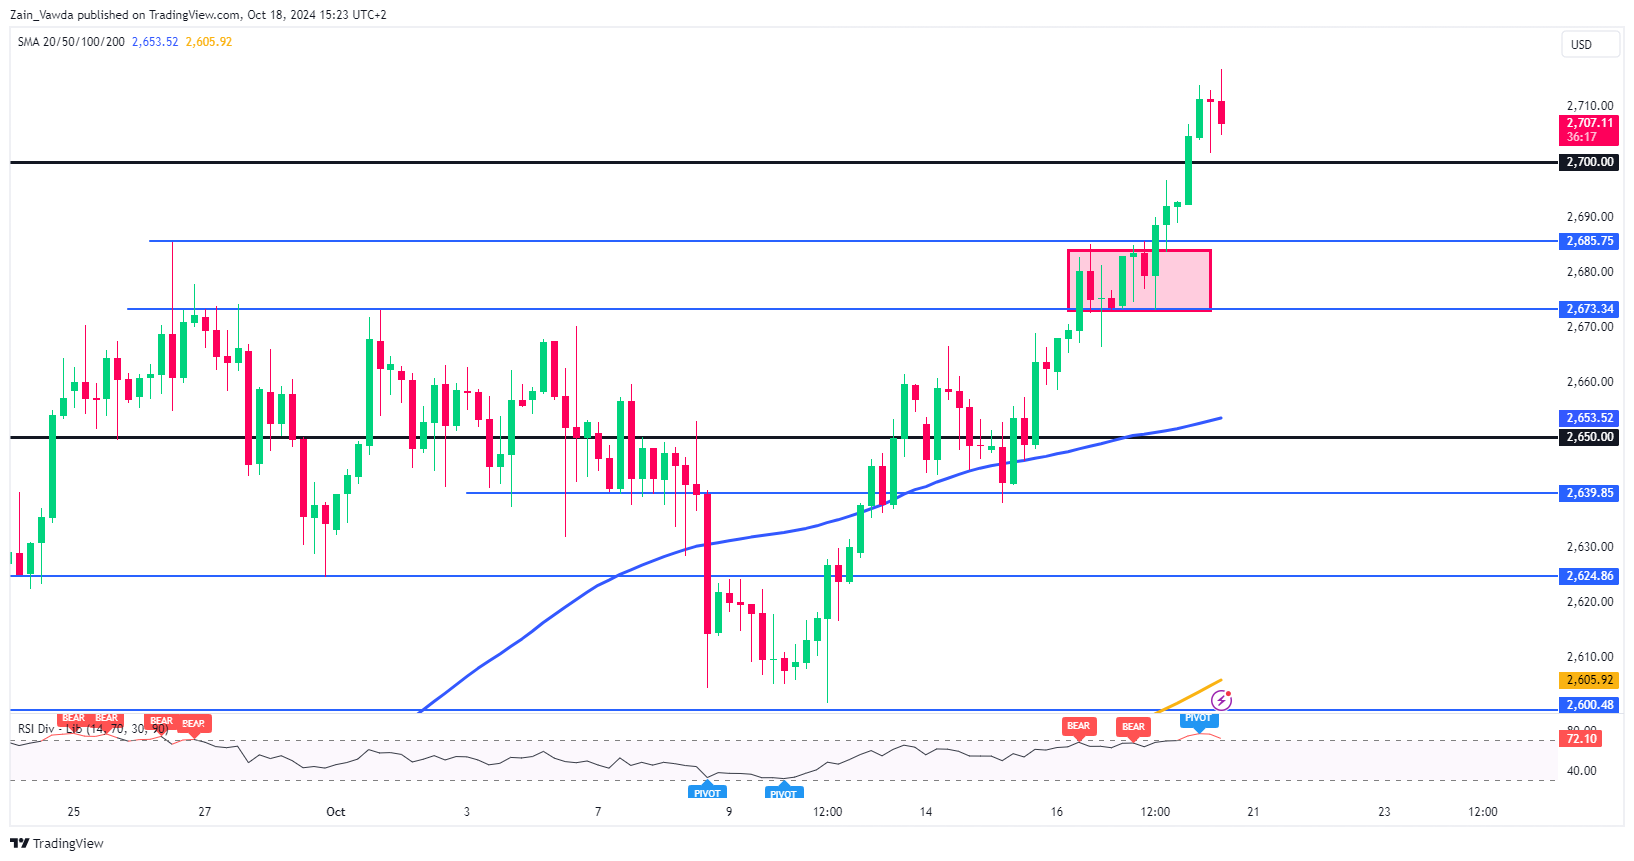
Source: TradingView (click to enlarge)
Support
- 2700
- 2685
- 2673
Resistance
- 2717
- 2725
- 2750
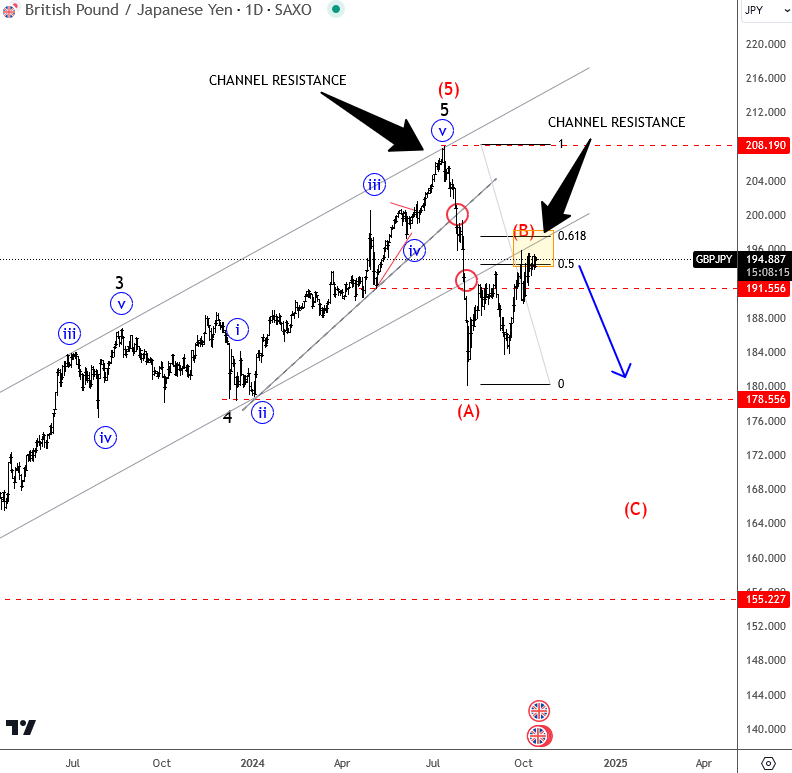
GBP/JPY Nearing Strong Resistance Zone
GBP/JPY has been in a strong bullish phase, but five-wave bullish cycle within wave (5) up from 2022 swing lows can be completed after recent strong reversal down back below channel support lines. In fact, drop from the high is impulsive on a smaller time frame, so it’s wave A that stabilized near 178 support area as expected. As such, current rise is corrective, ideally B wave that can be still in progress as a bigger correction before a continuation lower for wave C. Ideal resistance is at that channel line, from the outside, around 196 – 200 area.
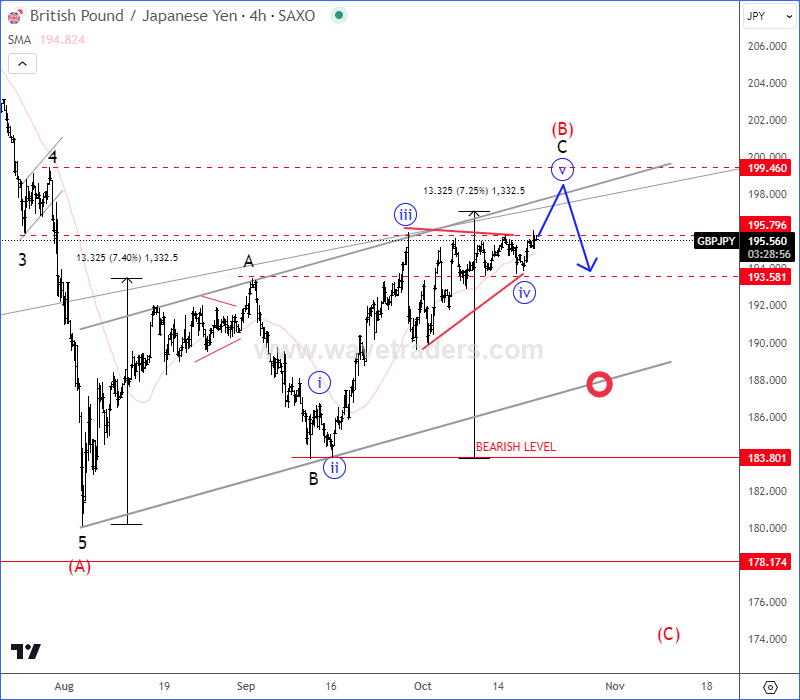
GBP/JPY is looking for a higher resistance within wave C of (B) in the 4-hour chart, as it can be now breaking out of subwave »iv« triangle into subwave »v« of C, so keep an eye on next strong 196 – 200 resistance zone, from where bears for a higher degree wave (C) may show up.
Crypto: From Fear to Greed in One Week
Market picture
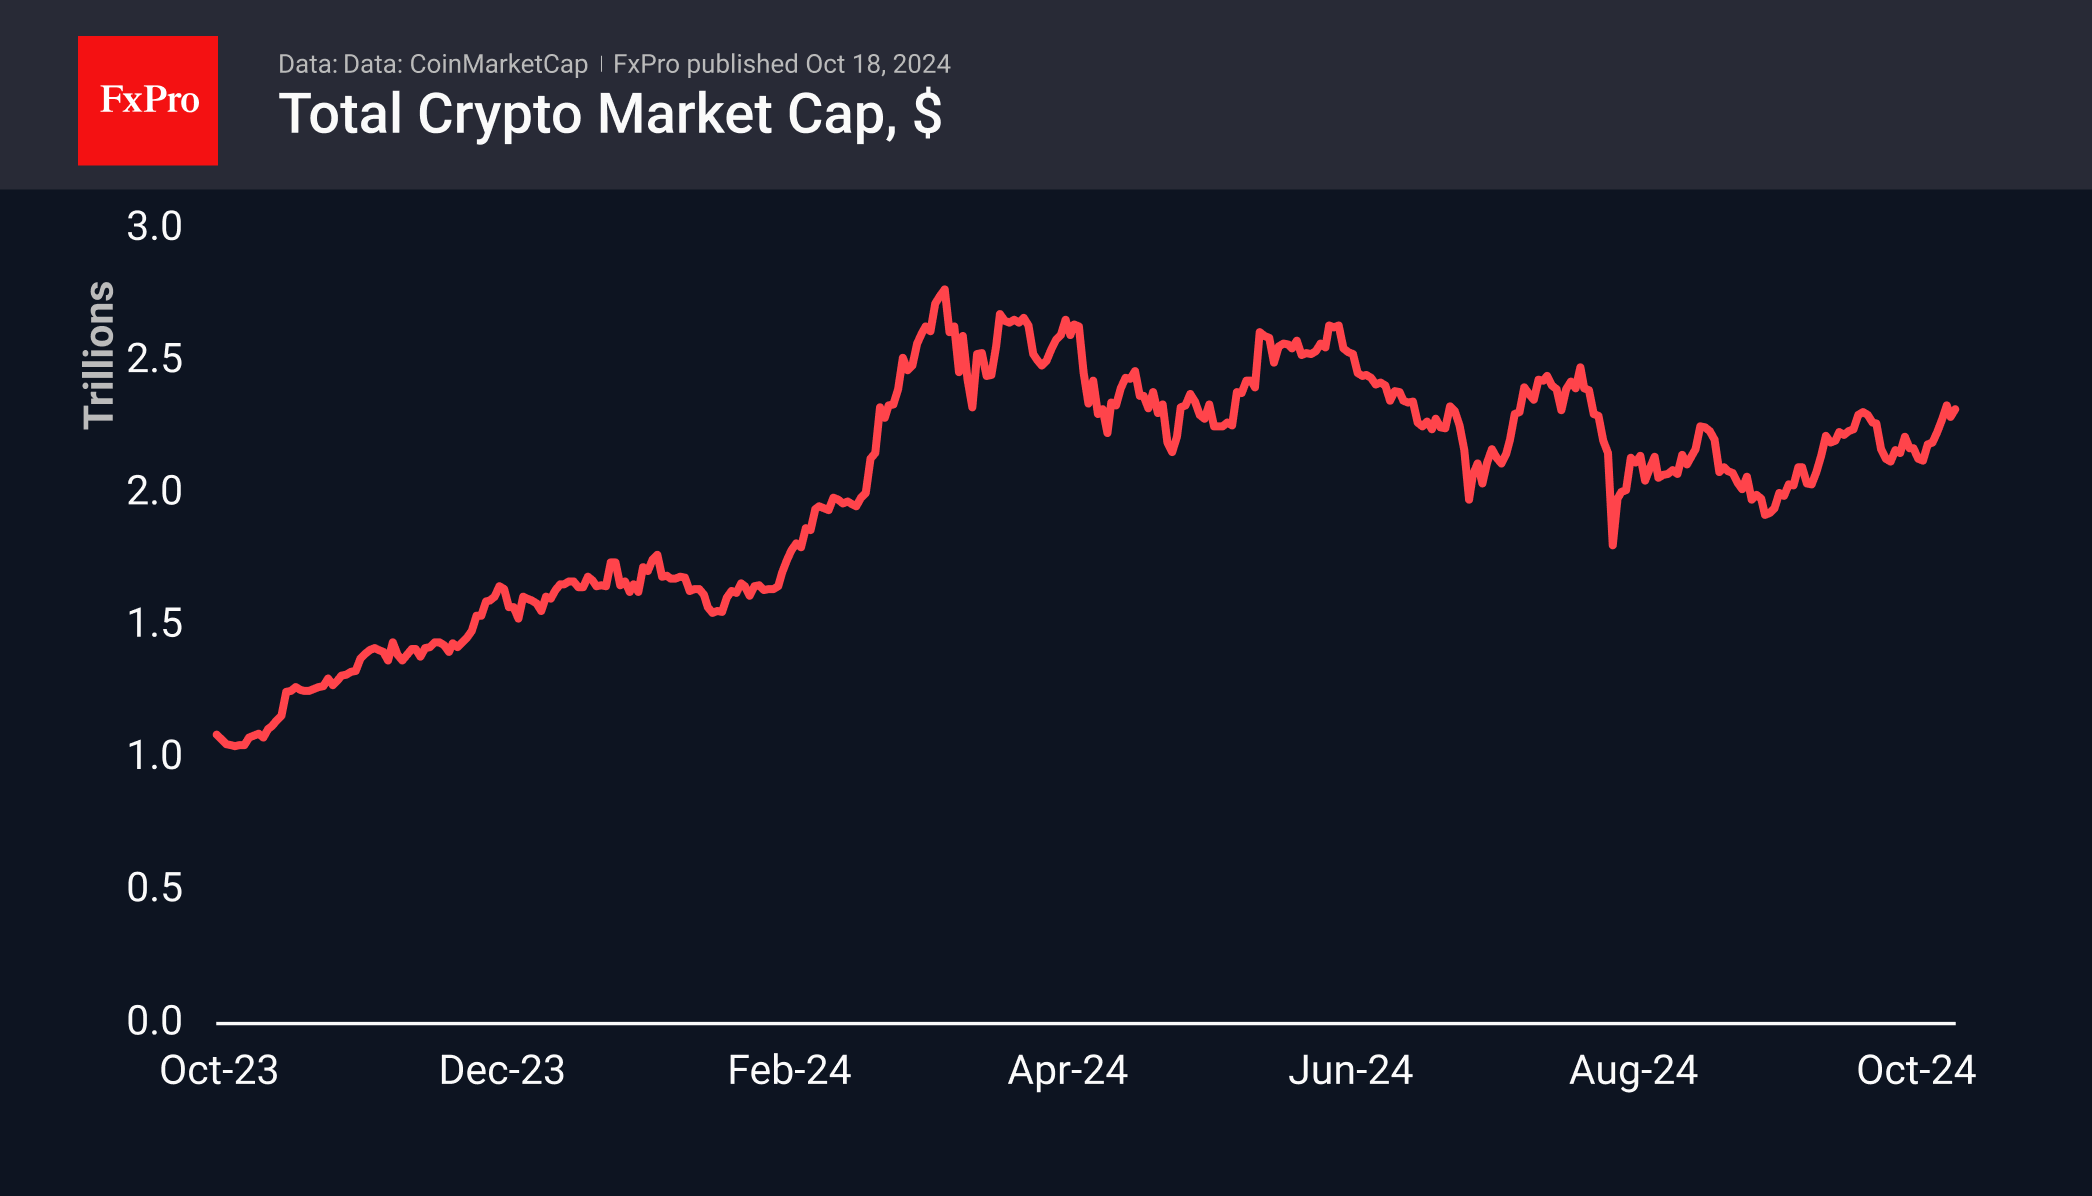
The crypto market has gained around 8% over the past seven days, stabilising near $2.30 trillion over this week and reaching a capitalisation of $2.32 trillion at the time of writing on Friday. The sentiment index is firmly in greed territory at 73. This is the highest level of optimism since late July and contrasts sharply with fear (32) a week earlier.
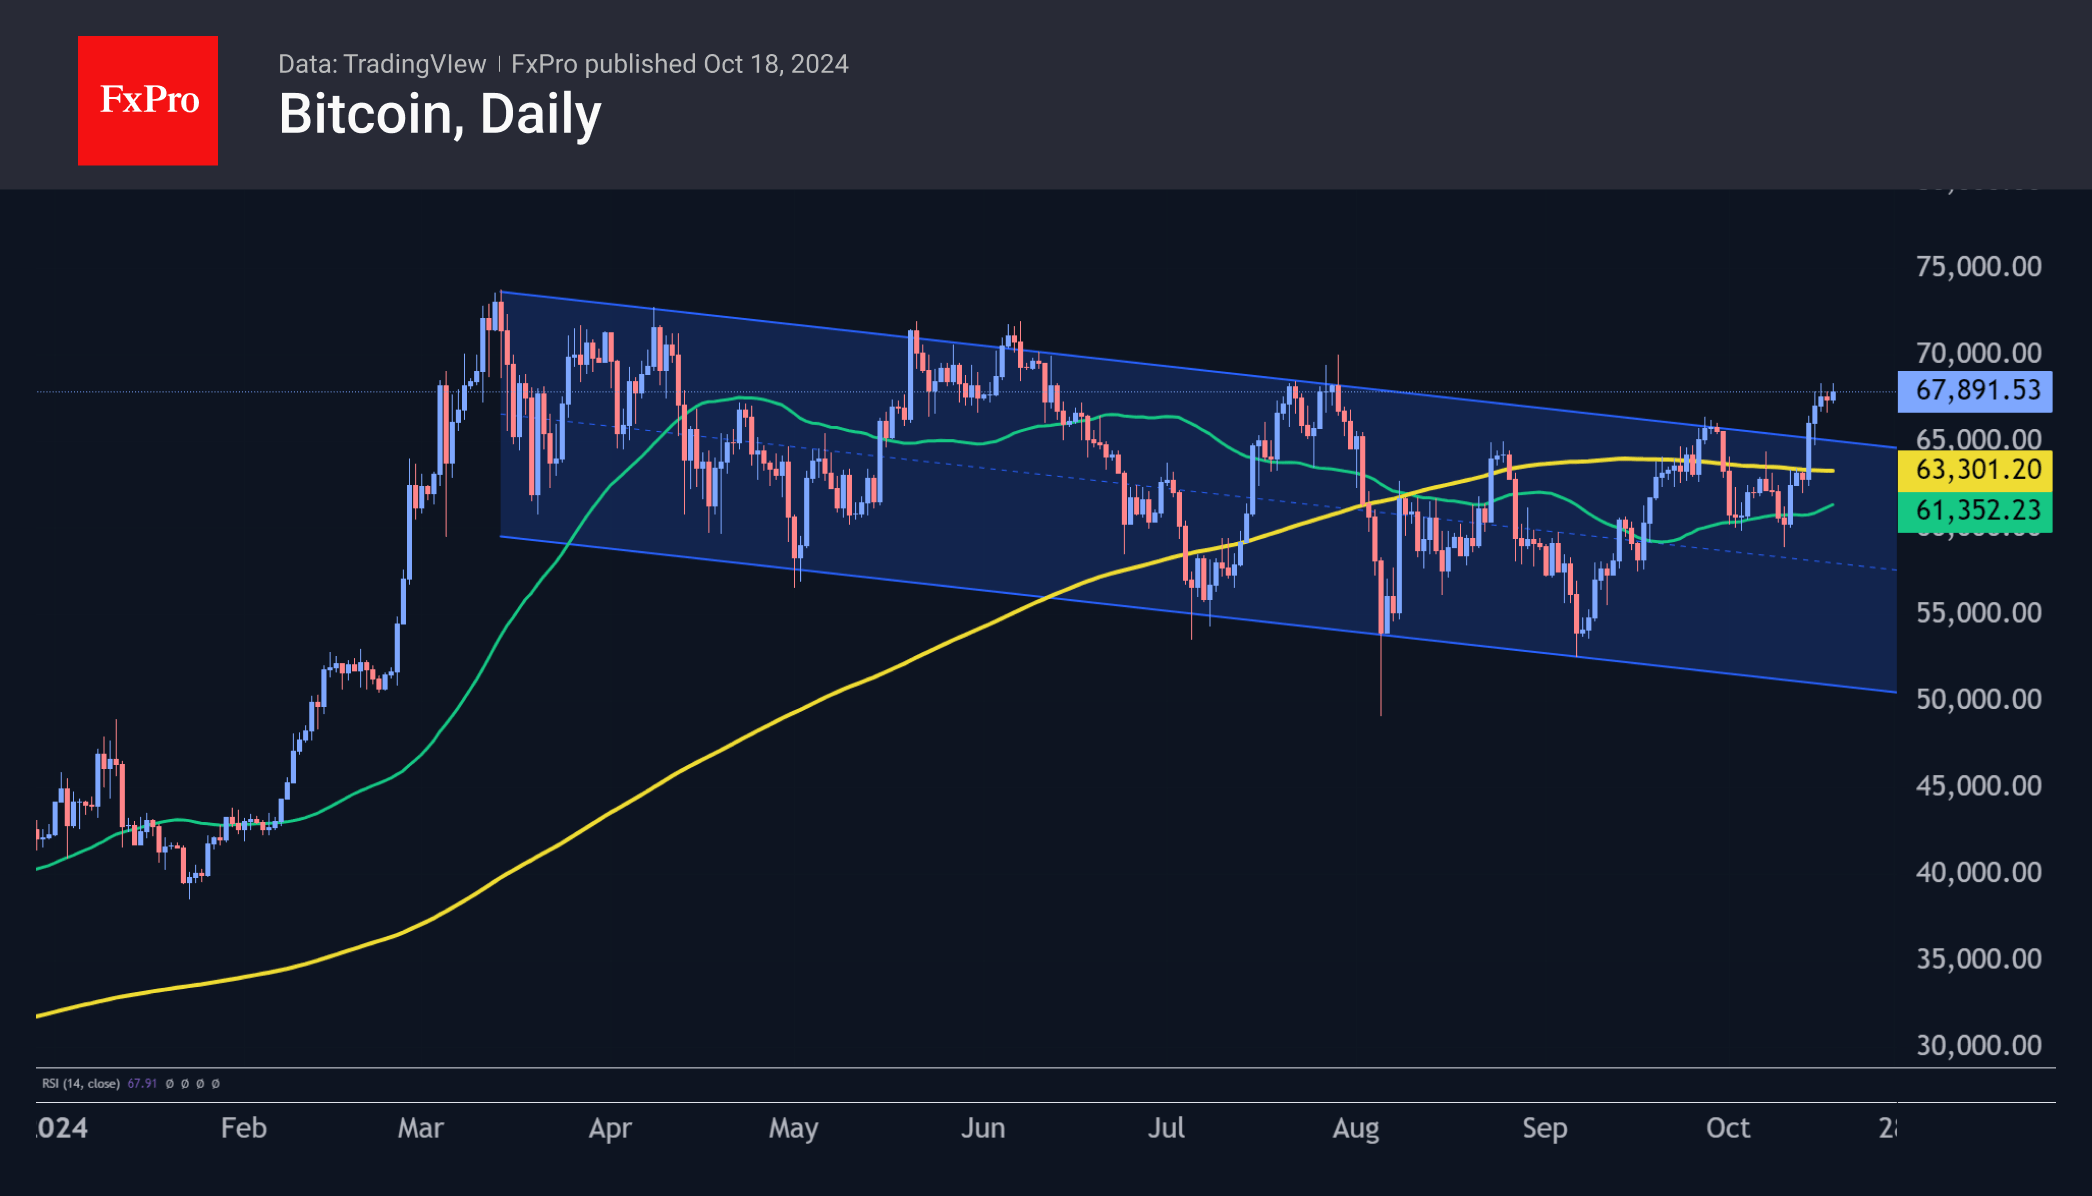
Bitcoin has gained over 12% in the last week, making two attempts to break through the $68 thousand level. In our view, the bulls in bitcoin already showed their strength on Monday, as they took the price above the 200-day MA in one fell swoop, breaking through the previous highs and the upper boundary of the multi-month descending channel. The next growth target looks to be the $71-73K area, where strong resistance and historical highs from March are concentrated.
News Background
CryptoQuant notes that bitcoin inventories on centralised crypto exchanges have fallen to multi-year lows. More than 51,000 BTC were withdrawn from major trading platforms last month.
QCP Capital recorded purchases of March call options on Bitcoin with an exercise price of $120K. The purchases were accompanied by a rise in quotes above $68K, which analysts saw as a sign of the return of bullish long-term buyers.
According to a16z crypto estimates, there are about 617 million cryptocurrency owners and 30-60 million monthly active users, excluding bots and temporary addresses. However, only 5-10% of users can be considered active, highlighting the huge opportunity to attract passive cryptocurrency holders.
The Block estimates that the total revenue of users staking Ethereum has fallen by around 30% from its peak in March due to a drop in the network activity.
Ethereum co-founder Vitalik Buterin sees the network’s most pressing problem as the lack of a unified ecosystem. According to him, the space built around the protocol is now more like 34 different blockchains.
Sunset Market Commentary
Markets
This morning the ‘official’ ONS UK September retail sales for the second consecutive month beat expectations by quite a substantial margin. Headline sales rose by 0.3% M/M and 3.9% Y/Y after a monthly rise of 1% in August and against expectations for a 0.4% monthly decline. Combined with a solid labour market report on Tuesday and softer than expect September inflation data published on Wednesday, this week’s data are important input for the upcoming BoE policy meeting on November 07. UK interest rate markets showed quite an asymmetric reaction function. No outspoken move on labour market data and/or retail sales but a substantial decline in (ST) UK interest rates after Wednesday’s CPI. Markets ‘feel’ that current still restrictive BoE policy allows a selective data reading from BoE governor Bailey and some other (likely even a majority) of his MPC colleagues. Markets still fully discount a next 25 bps rate cut at the November meeting and also hardly reduced chances for follow-up action in December. The combination of solid retail data, supported by positive real wages, at the same time supported by the BoE gradually reducing policy restriction for now proves reasonably good news for sterling. This is a fortiori the case for its performance against a vulnerable euro. EUR/GBP this morning briefly touched a new YTD low near 0.83. For now no sustained break occurred, but the downside in the pair still looks highly vulnerable. In case of a break the April/March 2022 lows at 0.825 and 0.8203 are next high profile reference on the technical charts.
Except for slightly weaker than expected US housing/starts and permits, there were no market relevant data in the US and EMU today. Markets mainly reassessed the impact of yesterday’s accelerated ECB easing. Reuters mentions sources close to the deliberations that inflation was seen easing to the target sooner than thought. This also caused some participants to open the debate whether the ECB should have dropped the pledge to keep policy tight. Also today, the ECB’s Survey of professional forecasters pointed to a slightly faster deceleration in 2025 inflation (1.9% from 2%). Nothing really spectacular, but it serves the current market bias. The German curve bull steepens with yields declining 4.5 bps (2-y) to 2 bps (30-y). Markets see slightly less that a 50% chance on a 50 bps ECB step in December. US Treasuries underperform with yields declining only 2-3 bps. Equities mostly trade in positive territory (Eurostoxx 50 + 0.62%). The S&P 500 opens in green with the all-time top still only a whisker away. After the tumbling early this week, oil is going nowhere ($74/b). Maybe a bit surprising given recent US data and ‘policy divergence’ between the Fed and the likes of ECB, but the dollar is falling prey to modest profit taking. DXY drops from the 103.8 area to currently 103.52. USD/JPY eased slightly to 149.9. Despite a growing interest-rate disadvantage, even EUR/USD rebounded from the 1.0825 area to currently 1.086. We don’t draw any firm conclusions on the USD correction yet. With markets focused on growth (or the lack of it) for next week we keep a close eye that the (US and EMU) PMI’s.
News & Views
People familiar with the matter indicate that Bank of Japan officials see little need to rush into raising rates later this month, according to news agency Bloomberg. They only see a small risk of prices outpacing the central bank’s quarterly projections (July), reducing the need to act quickly. US elections and the upcoming FOMC meeting are sources of uncertainty. At the October 31 policy meeting, the BoJ will probably discuss whether they can revise their July assessment that risks for prices are on the upside for this fiscal year and next. The base scenario remains one of higher interest rates down the road. The Japanese yen sticks to recent lows above USD/JPY 150.
Premature & Risky": Governor Das on interest rate cuts in India. The Indian central bank kept its policy rate unchanged at 6.5% earlier this month, but turned more neutral in its forward guidance. Inflation has moderated after two years of unchanged interest rates. However recent inflation data has shattered the December rate cut narrative (25% probability). The economists now project end of first quarter for the first cut. Mr Das mentioned that he would like to see inflation comfortably settle around 4% and also reiterated that the central bank wasn't behind the curve and called for extra caution. The RBI remains more bullish on Indian growth, sticking with forecasts of 7.2% for the current fiscal year, while the government’s projection stands at 6.5%-7%..
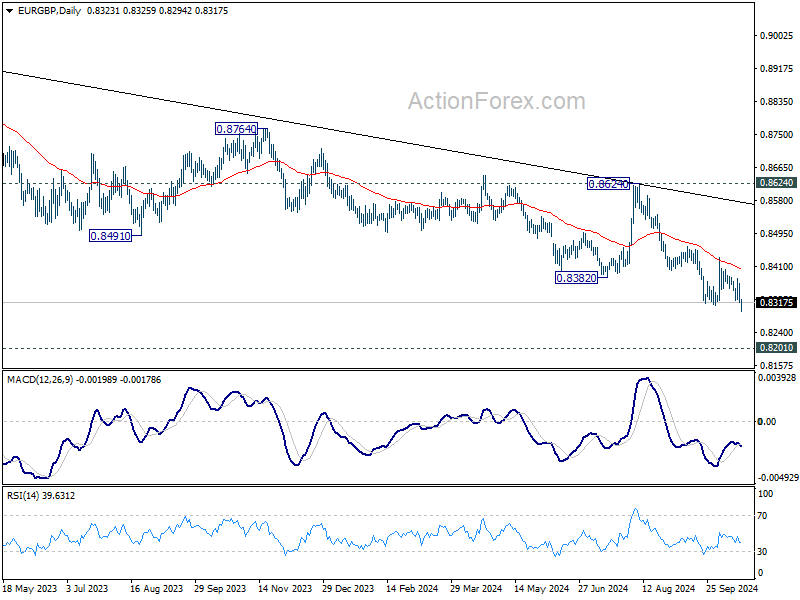
EUR/GBP Mid-Day Outlook
Daily Pivots: (S1) 0.8304; (P) 0.8339; (R1) 0.8359; More...
EUR/GBP's down trend resume by breaking through 0.8309. Intraday bias is now on the downside for 0.8201 key support next. Strong support could be seen from there to break rebound. But for now, break of 0.8433 resistance is needed to indicate short term bottoming. Otherwise, outlook will stay bearish in case of recovery.
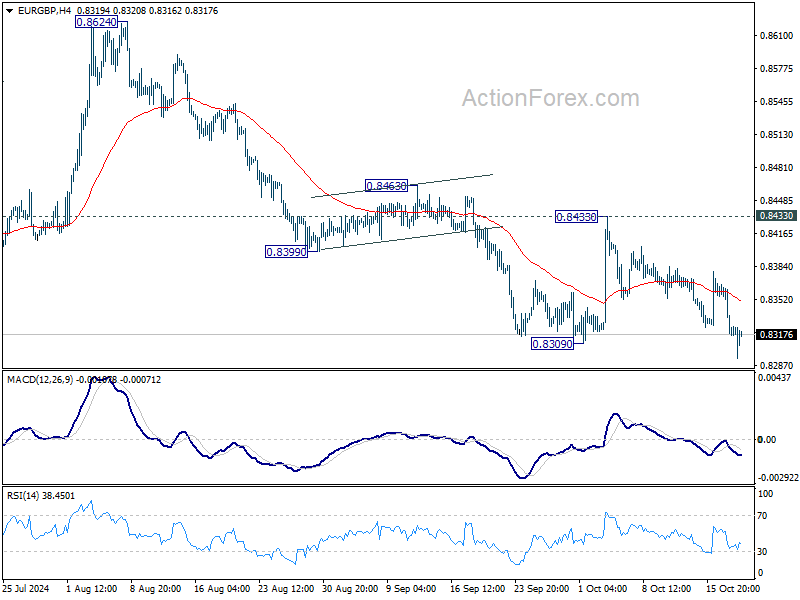
In the bigger picture, down trend from 0.9267 (2022 high) is in progress. Next target is 0.8201 (2022 low), but strong support should be seen there to bring rebound. However, outlook will remain bearish as long as 0.8624 resistance holds even in case of strong rebound.
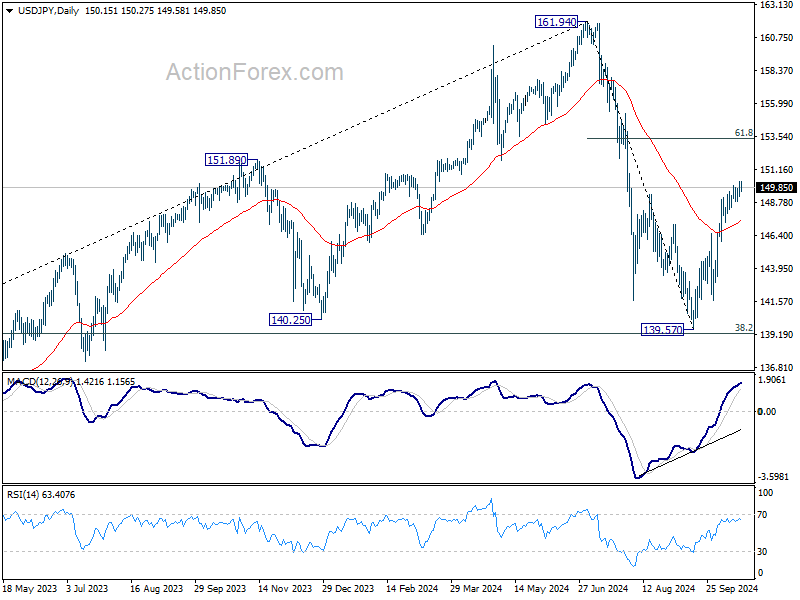
USD/JPY Mid-Day Outlook
Daily Pivots: (S1) 149.54; (P) 149.93; (R1) 150.62; More...
Intraday bias in USD/JPY remains on the upside for the moment. Rise from 139.57 is in progress for 61.8% retracement of 161.94 to 139.57 at 153.39 next. On the downside, below 148.84 minor support will turn intraday bias neutral first. But further rally will remain in favor as long as 146.48 resistance turned support holds.
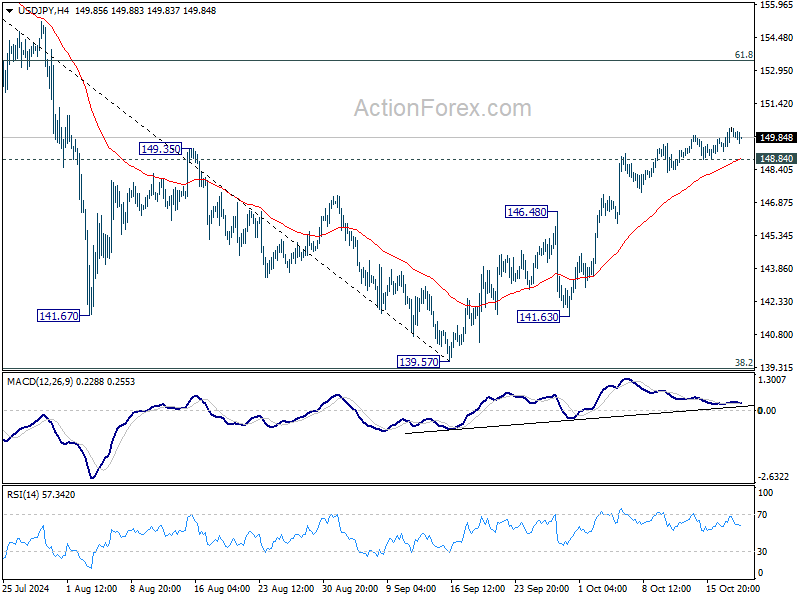
In the bigger picture, price actions from 161.94 are seen as a corrective pattern to rise from 102.58 (2021 low). The range of medium term consolidation should now be set between 38.2% retracement of 102.58 to 161.94 at 139.26 and 161.94. Nevertheless, sustained break of 139.26 would open up deeper medium term decline to 61.8% retracement at 125.25.
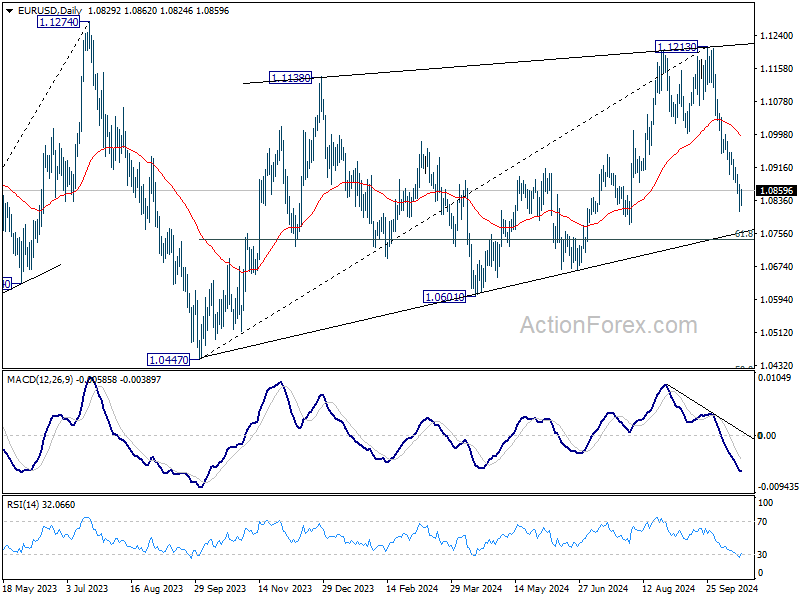
EUR/USD Mid-Day Outlook
Daily Pivots: (S1) 1.0803; (P) 1.0839; (R1) 1.0866; More....
Intraday bias in EUR/USD is turned neutral with current recovery. Some consolidations would be seen above 1.0810 temporary low first. But outlook will stay bearish as long as 1.0954 resistance holds. Below 1.0810 will resume the fall from 1.1213 to 61.8% retracement of 1.0447 to 1.1213 at 1.0740. Firm break there will target 1.0601 support next.
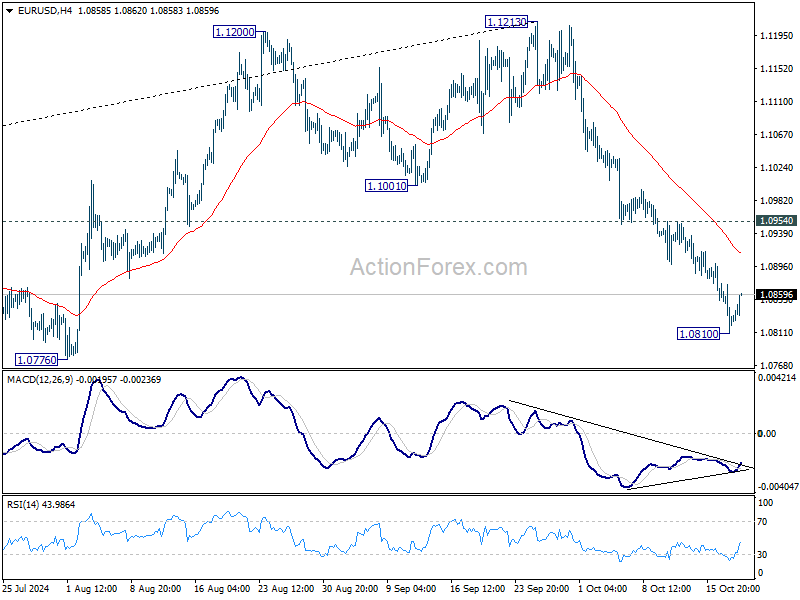
In the bigger picture, price actions from 1.1274 (2023 high) are seen as a consolidation pattern to up trend from 0.9534 (2022 low), with fall from 1.1213 as the third leg. Downside should be contained by 50% retracement of 0.9534 (2022 low) to 1.1274 at 1.0404, to bring up trend resumption at a later stage.
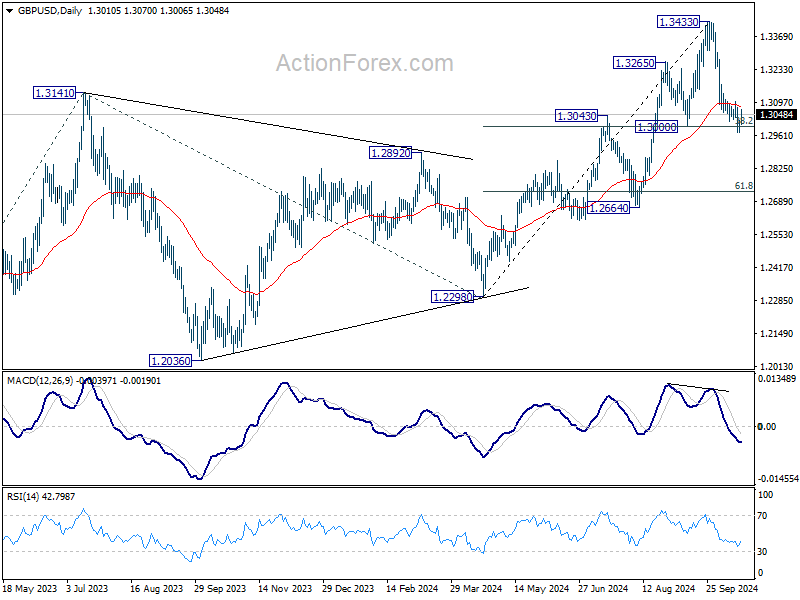
GBP/USD Mid-Day Outlook
Daily Pivots: (S1) 1.2982; (P) 1.3003; (R1) 1.3031; More...
Intraday bias in GBP/USD remains neutral for the moment. On the downside, sustained trading below 1.3000 cluster support (38.2% retracement of 1.2298 to 1.3433 at 1.2999) will argue that whole rise from 1.2298 has completed and bring deeper fall to 61.8% retracement at 1.2732. Nevertheless, strong bounce from current level, followed by break of 1.3102 minor resistance, will turn bias back to the upside for stronger rebound towards 1.3433.
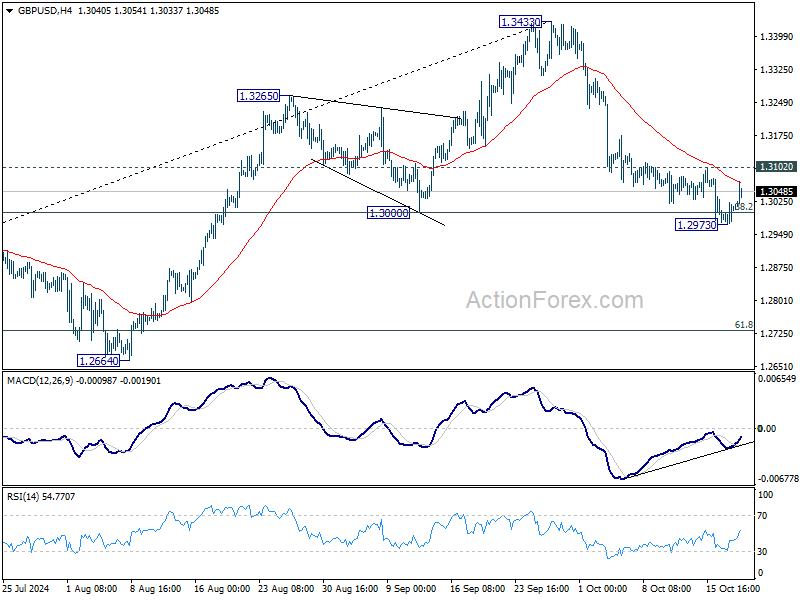
In the bigger picture, as long as 1.3000 support holds, the up trend from 1.0351 (2022 low) is still in progress. Next target is 61.8% projection of 1.0351 to 1.3141 from 1.2298 at 1.4022. However, considering mild bearish divergence condition in D MACD, decisive break of 1.3000 will argue that a medium term top is already in place, and bring deeper fall back to 1.2664 support next.
Dollar Holds Dominance, Sterling Closing In
Dollar remains the top performer for the week, despite a mild pullback today. Sterling jumped into second place, buoyed by stronger-than-expected UK retail sales data. Meanwhile, Canadian Dollar holds third position, although its momentum has waned, suggesting it could slip before the weekly close.
On the weaker side, Swiss Franc continues to lag behind, marking the worst performance of the week. Euro follows closely as the second weakest currency, weighed down by dovish tone of ECB’s rate cut yesterday. Japanese Yen also struggles, ranking third worst, despite verbal interventions by Japanese officials aimed at stabilizing the currency.
Both Australian and New Zealand Dollars are taking a breather from recent losses, supported by a rebound in Chinese markets. However, overall market sentiment suggests that risk-sensitive currencies like Aussie and Kiwi will continue to face pressure amid ongoing global uncertainties.
In Europe, at the time of writing, FTSE is down -0.14%. DAX is up 0.41%. CAC is up 0.78%. UK 10-year yield is down -0.0245 at 4.075. Germany 10-year yield is down -0.022 at 2.195. Earlier in Asia, Nikkei rose 0.18%. Hong Kong HSI rose 3.61%. China Shanghai SSE rose 2.91%. Singapore Strait Times rose 0.41%. Japan 10-year JGB yield rose 0.0051 to 0.970.
UK retail sales rises 0.3% mom in Sep, extended rebound in consumption
UK retail sales volumes rose by 0.3% mom in September, defying expectations of -0.3% decline. This marked the highest retail sales index level since July 2022, reflecting stronger-than-anticipated rebound in consumer activity.
Looking at the broader picture, sales volumes in Q3 surged by 1.9% compared to Q2, the joint-largest quarterly rise since July 2021. This upward momentum, shared with March 2024.
BoJ’s Ueda stresses vigilance amid global uncertainty, cautions on market volatility
In a speech today, BoJ Governor Kazuo Ueda highlighted the persistent uncertainties surrounding Japan’s economic recovery and global market conditions, urging caution in assessing the outlook.
Ueda emphasized the "still high" level of unpredictability in the overseas economic environment, particularly noting volatility in key markets such as the US.
"The overseas economic outlook, including that for the United States, remains uncertain, while market moves continue to be unstable," Ueda remarked.
"We must closely monitor such developments with high vigilance, and scrutinize their fallout on Japan's economic and price outlook," he said, underlining that Japan’s recovery remains fragile and exposed to global economic shifts.
Japan's CPI core slows to 2.4%, core-core edges up
Japan's core CPI, which excludes fresh food, eased from 2.8% yoy to 2.4% yoy in September, slightly above expectations of 2.3% yoy. Despite the slowdown, core inflation has remained above BoJ's 2% target for well over two years.
The deceleration in price gains is largely attributed to government utility subsidies, which have helped lower household expenses. Headline CPI fell from 3.0% yoy to 2.5%, with gas prices subtracting 0.55 percentage points from the overall figure. This indicates that without government intervention, inflation would have remained higher.
Meanwhile, CPI measure that excludes both food and energy costs—often referred to as core-core CPI—increased from 2.0% yoy to 2.1% yoy, suggesting underlying inflation remains firm. However, service prices saw a slight decrease in momentum, slowing from 1.4% yoy to 1.3% yoy.
China’s Q3 GDP growth slows to 4.6%, stimulus impact yet to solidify
China’s economy grew 4.6% yoy in Q3, slowing slightly from 4.7% in Q2 but in line with market expectations. This marks the slowest pace of growth since early 2023, as external pressures and a challenging global environment continue to weigh on the country's economic performance. On a quarterly basis, GDP expanded by 0.9%.
The National Bureau of Statistics noted that the economy remained "generally stable with steady progress," highlighting continued increase in production and demand, alongside stable employment and prices.
The NBS emphasized that the effects of the government's stimulus policies were beginning to show, with "major indicators displaying positive changes recently."
However, the bureau also cautioned that the external environment was becoming "increasingly complicated and severe," underscoring the need to further solidify the foundation for sustained recovery.
Key economic data released alongside the GDP report suggested signs of resilience in some sectors. Industrial production increased by 5.4% yoy in September, surpassing expectations of 4.6% yoy. Retail sales also exceeded forecasts, rising 3.2% yoy compared to the expected 2.4% yoy. Fixed asset investment saw a 3.4% year-to-date increase, slightly above 3.3% expected by analysts.
GBP/USD Mid-Day Outlook
Daily Pivots: (S1) 1.2982; (P) 1.3003; (R1) 1.3031; More...
Intraday bias in GBP/USD remains neutral for the moment. On the downside, sustained trading below 1.3000 cluster support (38.2% retracement of 1.2298 to 1.3433 at 1.2999) will argue that whole rise from 1.2298 has completed and bring deeper fall to 61.8% retracement at 1.2732. Nevertheless, strong bounce from current level, followed by break of 1.3102 minor resistance, will turn bias back to the upside for stronger rebound towards 1.3433.
In the bigger picture, as long as 1.3000 support holds, the up trend from 1.0351 (2022 low) is still in progress. Next target is 61.8% projection of 1.0351 to 1.3141 from 1.2298 at 1.4022. However, considering mild bearish divergence condition in D MACD, decisive break of 1.3000 will argue that a medium term top is already in place, and bring deeper fall back to 1.2664 support next.