
Sample Category Title
EUR/CHF Daily Outlook
Daily Pivots: (S1) 0.9353; (P) 0.9381; (R1) 0.9409; More....
EUR/CHF is still bounced in converging range and intraday bias remains neutral. On the upside, break of 0.9506 resistance should resume whole rebound from 0.9209 through 0.9579 resistance. On the downside, break of 0.9332 will resume the fall from 0.9579 towards 0.9209 low.
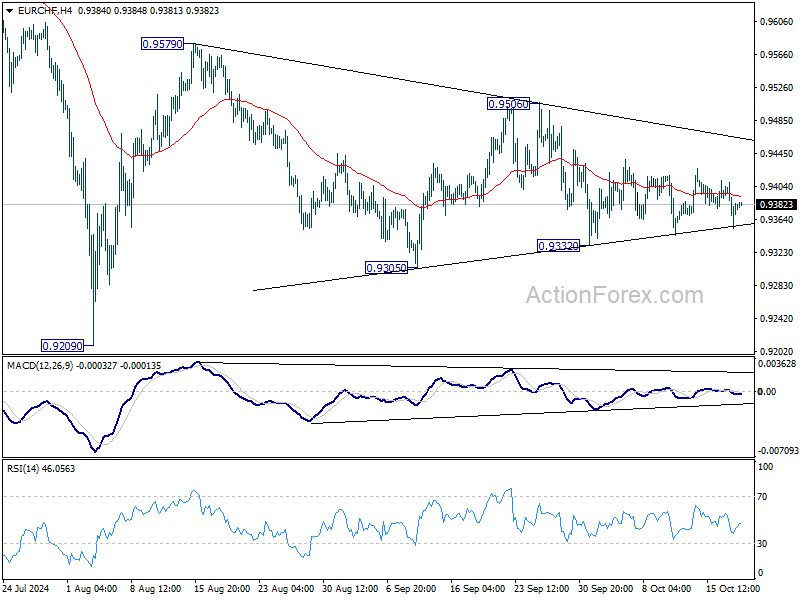
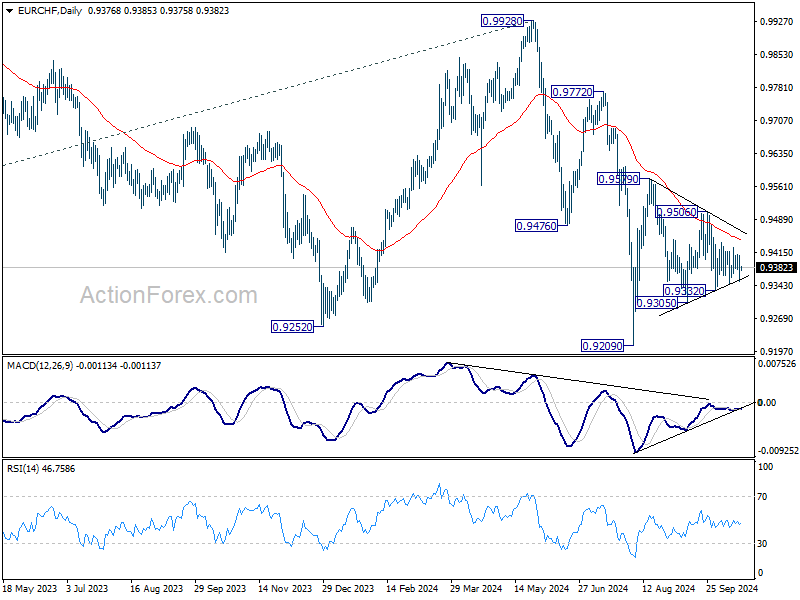
In the bigger picture, medium term corrective pattern from 0.9407 (2022 low) might have completed with three waves to 0.9928. Decisive break of 0.9252 (2023 low) will confirm long term down trend resumption. Next target will be 61.8% projection of 1.1149 to 0.9407 from 0.9928 at 0.8851. For now, outlook will stay bearish as long as 0.9928 resistance holds, even in case of strong rebound.
China’s Q3 GDP growth slows to 4.6%, stimulus impact yet to solidify
China’s economy grew 4.6% yoy in Q3, slowing slightly from 4.7% in Q2 but in line with market expectations. This marks the slowest pace of growth since early 2023, as external pressures and a challenging global environment continue to weigh on the country's economic performance. On a quarterly basis, GDP expanded by 0.9%.
The National Bureau of Statistics noted that the economy remained "generally stable with steady progress," highlighting continued increase in production and demand, alongside stable employment and prices.
The NBS emphasized that the effects of the government's stimulus policies were beginning to show, with "major indicators displaying positive changes recently."
However, the bureau also cautioned that the external environment was becoming "increasingly complicated and severe," underscoring the need to further solidify the foundation for sustained recovery.
Key economic data released alongside the GDP report suggested signs of resilience in some sectors. Industrial production increased by 5.4% yoy in September, surpassing expectations of 4.6% yoy. Retail sales also exceeded forecasts, rising 3.2% yoy compared to the expected 2.4% yoy. Fixed asset investment saw a 3.4% year-to-date increase, slightly above 3.3% expected by analysts.
Japan’s CPI core slows to 2.4%, core-core edges up
Japan's core CPI, which excludes fresh food, eased from 2.8% yoy to 2.4% yoy in September, slightly above expectations of 2.3% yoy. Despite the slowdown, core inflation has remained above BoJ's 2% target for well over two years.
The deceleration in price gains is largely attributed to government utility subsidies, which have helped lower household expenses. Headline CPI fell from 3.0% yoy to 2.5%, with gas prices subtracting 0.55 percentage points from the overall figure. This indicates that without government intervention, inflation would have remained higher.
Meanwhile, CPI measure that excludes both food and energy costs—often referred to as core-core CPI—increased from 2.0% yoy to 2.1% yoy, suggesting underlying inflation remains firm. However, service prices saw a slight decrease in momentum, slowing from 1.4% yoy to 1.3% yoy.
China Stimulus and Headwinds
China has announced a range of stimulus measures recently. This pivot has been needed partly because of longstanding fragilities. It is hard to see a lasting upside for Australian iron ore exports from the moves.
In recent weeks, Chinese authorities have announced a range of stimulus measures, along with some vaguer statements of intent to stimulate. Westpac Economics’ Head of International Economics Elliot Clarke had the details in our October Market Outlook (PDF 2MB). Since then, the authorities have announced further housing-related measures that have mostly disappointed market observers.
The Chinese authorities have come to this point because domestic demand, especially consumer spending, has been soft and deflation has emerged. This illustrates a general principle about post-pandemic recoveries. The strength of recovery typically depended on the balance between the length and severity of the social distancing restrictions, and the extent of the policy support relative to the ‘income hole’ the restrictions created.
For example, restrictions in the United States were shorter-lived than in some peer economies, while the income support was extensive. Some workers were better off on the extended unemployment benefits than they were when they were working. Together with the stimulus from post-pandemic fiscal packages, it is no wonder that US domestic demand growth has outpaced that in other major advanced economies. In China, by contrast, restrictions (and the risk of snap lockdowns) persisted for much longer than elsewhere, but the income support to households and businesses was more limited. After an initial post-opening burst, consumer spending in China has been soft. In Australia and most European nations, these forces were more balanced; Australia inadvertently overfilled the ‘income hole’ but had restrictions in place for longer, while the Europeans tended to underfill the hole.
Another reason for the turn to deflation in China is that much of the stimulus and other policy measures have been about boosting supply capacity in priority areas, especially in high-tech manufacturing, rather than lifting demand.
More broadly, though, the pivot to stimulus has become necessary because of longer-standing fragilities in the institutional landscape there.
One of these fragilities is a vertical fiscal imbalance. Local and provincial governments are responsible for much of the public spending, especially for infrastructure. However, taxation powers are concentrated at the national level. The central government does redistribute some revenue back to the provinces, but not enough to cover the gap. Local governments therefore rely heavily on non-tax revenue sources such as land sales.
This reliance has made local governments sensitive to housing market cycles, which in turn collides with another fragility: construction activity has been contracting in China for several years. The beginnings of the decline were at least partly intentional. The government was concerned about the risks arising from high leverage and wanted to ensure that housing was for living in, not just speculation. They imposed a range of restrictions on the number of properties people could buy, and how much debt they could borrow to do so. Some of the stimulus measures announced in recent weeks are simple relaxations of those earlier restrictions.
Beyond these policy objectives, though, part of the issue is that housing construction needs to be a structurally smaller part of the Chinese economy than it was in recent decades. The population is shrinking, so there is no need to build homes to house additional people. The urbanisation phase is maturing, so there is less need to build homes in cities to house people who previously lived in rural areas.
Perhaps less well understood is that there is also less need to build new homes to replace older ones. When real incomes are growing at 10% per year, the home built ten years ago – when your real income was less than 40% of its current level – is no longer fitting to your aspirations. So there is a strong impetus to replace older buildings with newer, nicer ones. As living standards converge to those of richer peers and growth rates slow to 5%, or 4% or less, that economic rate of depreciation declines. There is less of an impetus to replace the old homes with new.
We have, of course, seen similar dynamics elsewhere. Economies in South-East Asia grew very quickly in the early-to-mid-1990s as they opened up and industrialised. Ireland and Spain also saw fast growth, and high levels of housing construction, after joining the euro area and converging to euro area living standards. Neither of these episodes ended well, though. Perhaps China can stick the landing on the transition to a smaller housing construction sector, because the authorities are trying to pre-empt the process. But the odds are against it.
That the Chinese authorities are indeed trying to induce shrinkage in the housing sector illustrates another key principle: China’s system is different, and the authorities can and are willing to use a broader range of interventions to achieve policy objectives. For example, while central banks in some major advanced economies resorted to purchasing assets during severe downturns in recent decades, a facility to lend to financial firms so they can buy equities would be deemed a bridge too far. This means that policy support in China can counter even clear fragilities and contradictions in the policy environment for longer than would be likely in the West. The Chinese government can and will ‘kick the can down the road’ for longer than markets can bet against their capacity to do so.
The ‘Iron Law’ for Iron Ore
The question for Australia is whether stimulus in China will be enough to kick the can down the road for the Chinese steel market, and so demand for iron ore, our largest export to China and in total. The question arises because this industry, too, is facing structural limits like those facing the construction industry, and for partly related reasons.
There is an empirical regularity – an ‘iron law’, almost – that, once countries hit a certain level of economic development, domestic demand for steel per capita tops out, unless you are Japan or South Korea and have a big export industry in shipbuilding. Beyond that GDP level, economies become more service-oriented and there is no additional per capita demand for steel. Past analysis by the RBA puts that level at about $US10,000 at 1990 prices; at current prices that would be around $US24,000. China has already reached that level, and with a shrinking population, Peak Steel per Capita also means Peak Steel in Total.
As Westpac Economics colleague Senior Economist Justin Smirk noted in our October Market Outlook, (PDF 2MB) Chinese steel production peaked already in 2020. There is no material upside to the size of this market in the long term. Since Australia remains a low-cost and reliable producer, we will continue to have a significant export market even if China switches to greater use of scrap steel in production in future. And in the short term, the consolidation of China’s steel industry favours the imported ore that Australia produces. But like the stimulus measures announced in recent weeks, these forces delay a near-inevitable slide in industries that have structural reasons to shrink. They do not create major avenues for additional growth for Australia.
Cliff Notes: Labour Market Powers Ahead
Key insights from the week that was.
In Australia, the central data update of the week certainly did not fail to surprise the market. The September Labour Force Survey (LFS) reported another above-trend increase in employment growth, a gain of +64.1k, driving the employment-to-population ratio to a new record high of 64.4%. Measures of unemployment, underemployment and underutilisation all also managed to tick lower in the month, at a time when a record proportion of Australians are actively engaging in the labour market. This is reflecting not only employers’ clear appetite to expand headcount, but also an underlying normalisation of dynamics around average hours worked – moving from big swings through the pandemic and the RBA’s tightening cycle, to now tracking broadly in line with long-run historical trends.
Whichever way the data is cut, it is difficult to find any real causes for concern about the current health of the labour market. The upshot is that this is therefore unlikely to lead to any material change to the RBA’s views on the labour market. Policymakers will be keeping a close eye on certain dynamics – particularly around average hours worked – as this is the key channel through which the RBA anticipates most of the softening in the labour market will come. Other issues such as the industry-level breakdown will also remain an important consideration in linking the labour market to GDP growth, given the increasing contrast between productivity in non-market and market sectors.
Markets have accordingly pared back bets for RBA policy rate cuts this year, although current pricing suggests there is still a little appetite. Domestically, the economic calendar will be virtually radio silent over the next week, with the only notable data/events being the 2023-24 National Accounts – which will provide updated estimates and detail on industry and productivity – and a fireside chat from RBA Deputy Governor Hauser. All eyes will be on Q3 CPI on October 30, which should provide a more definitive guide on the near-term path for monetary policy. For more detail behind our forecast and the risks surrounding the upcoming inflation print, see our preview here on WestpacIQ.
Offshore, news this week lent to a more dovish tone in most developed markets paving the way for further monetary policy easing.
The European Central Bank cut interest rates by 25bps pointing to the recent weakness in growth and noting that the ‘disinflationary process is well on track’, while financial conditions continue to be deemed ‘restrictive’. Their forward guidance remained unchanged, with the policy statement reaffirming that ‘the Governing Council will continue to follow a data-dependent and meeting-by-meeting approach’. While there were no updated economic forecasts, in the press conference President Lagarde acknowledged that ECB’s projections likely will require downward revisions in the next policy meeting in December. We take this, alongside the evolution of price and growth indicators, to suggest another cut in December is highly likely. A more front-loaded rate cutting cycle should allow the ECB to quell fears around stalling growth momentum, particularly as countries focus more on fiscal consolidation.
In the UK wage growth eased to 3.8%3m/yr, around 2ppt below the levels seen just a few months ago. The pace of increase in private sector regular wages, closely watched by the Bank of England, also slowed to 4.8%3m/yr, down from above-6% at the beginning of the year. This followed other measures, like the Decision Maker’s Panel Survey, which suggested wages are easing. Meanwhile, the CPI data, also released this week, showed that inflation slipped from 2.2%yr to 1.7%yr, undershooting the BoE’s forecast from August by 0.4ppt. Most notably, services inflation eased to 4.9%yr, albeit to a large extent driven by a drop in the volatile airfares category. With wages also having subsided, further progress on services inflation should be imminent. While headline inflation is likely to rise in the coming months in part due to increase in the energy price cap set by regulators, signals that the underlying inflationary pressures are easing faster support our expectations that the BoE will continue cutting the Bank Rate in the remaining two policy meetings this year.
Across the pond, US retail sales data suggested that consumer spending was robust in September and Q3 as a whole. Control group sales were up 0.7% in the month and 1.6% on the three-month basis, with the latter suggesting a sizeable household consumption contribution to GDP growth. The effects of the hurricanes in the US, which seem to have supported retail sales in September, are likely to dissuade consumer spending in the month ahead. The weather-related distortions were visible in other economic data released this week, including the industrial production and claims for unemployment insurance.
Chinese authorities announced additional measures to support local governments, the housing sector and businesses. However, with no pledge to significantly ramp up fiscal spending, market reaction has been mixed. Later today we will receive Q3 GDP data and partial activity data which should reinforce a need for direct stimulus particularly to households. Chief Economic Luci Ellis scrutinizes China’s economic challenges in her essay this week.
USD/JPY Set for More Gains: Is The Uptrend Here To Stay?
Key Highlights
- USD/JPY remained in a positive zone above the 148.50 support zone.
- A short-term bullish trend line is forming with support at 149.25 on the 4-hour chart.
- EUR/USD declined heavily and traded below the 1.0840 support.
- Oil prices are at risk of more downsides below the $69.75 support.
USD/JPY Technical Analysis
The US Dollar started a decent increase above the 148.00 level against the Japanese Yen. USD/JPY settled above 148.50 to set the tone for more upsides.
Looking at the 4-hour chart, the pair is stable above the 100 simple moving average (red, 4-hour) and the 200 simple moving average (green, 4-hour). The pair even tested the 150.00 resistance zone before the bears emerged.
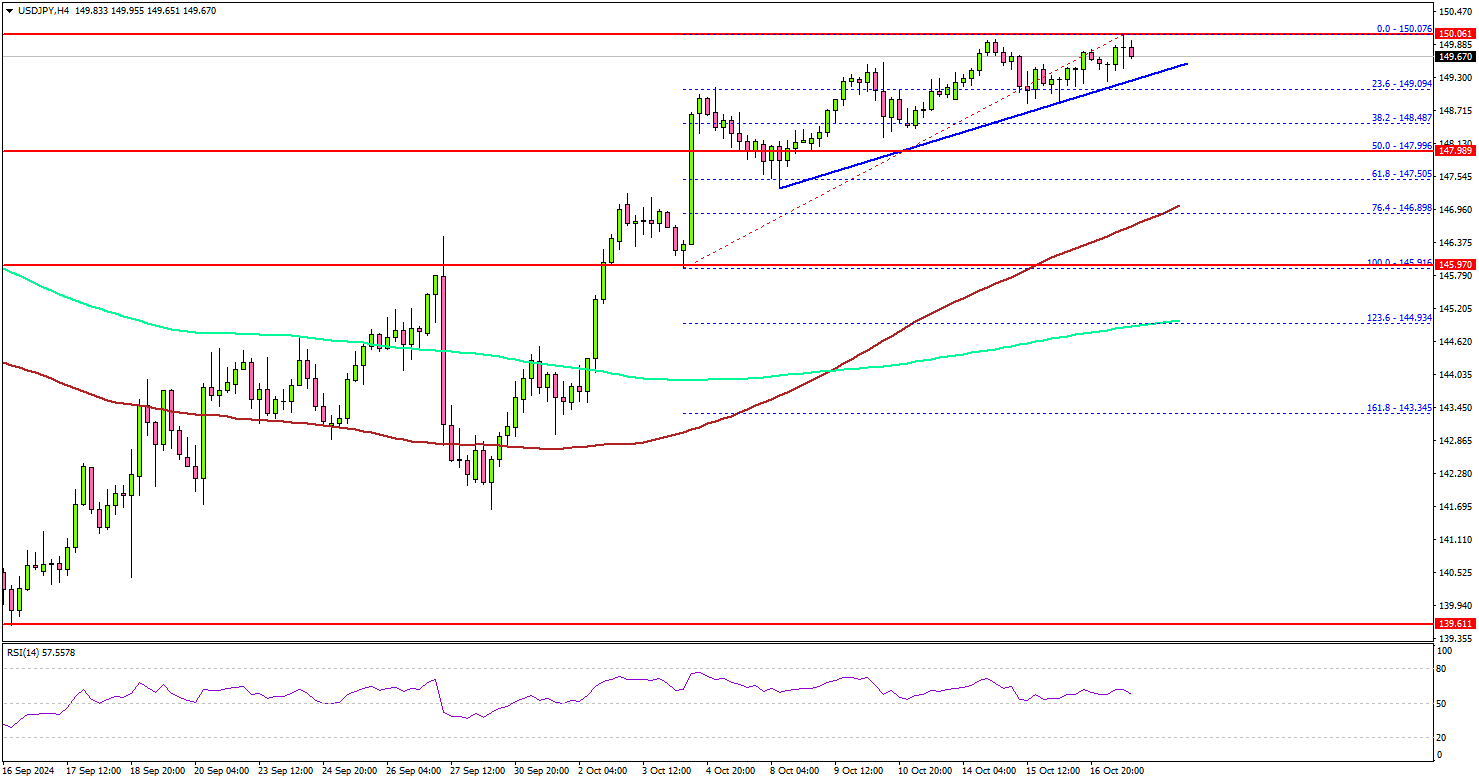
On the downside, immediate support sits near the 149.20 level. There is also a short-term bullish trend line forming with support at 149.25 on the same chart.
The next key support sits near the 148.50 level. Any more losses could send the pair toward the 147.80 level. On the upside, the bears might be active near the 150.20 level. The first major resistance might be near the 150.50 level.
A close above the 150.50 level could set the tone for another increase. The next major resistance could be 151.20. A clear move above the 151.20 level might send USD/JPY toward 152.00. Any more gains might call for a test of the 153.20 zone.
Looking at EUR/USD, the bears remained active and were able to push the pair below the 1.0880 and 1.0850 support levels.
Upcoming Economic Events:
- US Housing Starts for Sep 2024 (MoM) – Forecast 1.350M, versus 1.356M previous.
- US Building Permits for Sep 2024 (MoM) – Forecast 1.460M, versus 1.470M previous.
Elliott Wave Intraday View: S&P 500 Futures (ES) Wave 5 In Progress
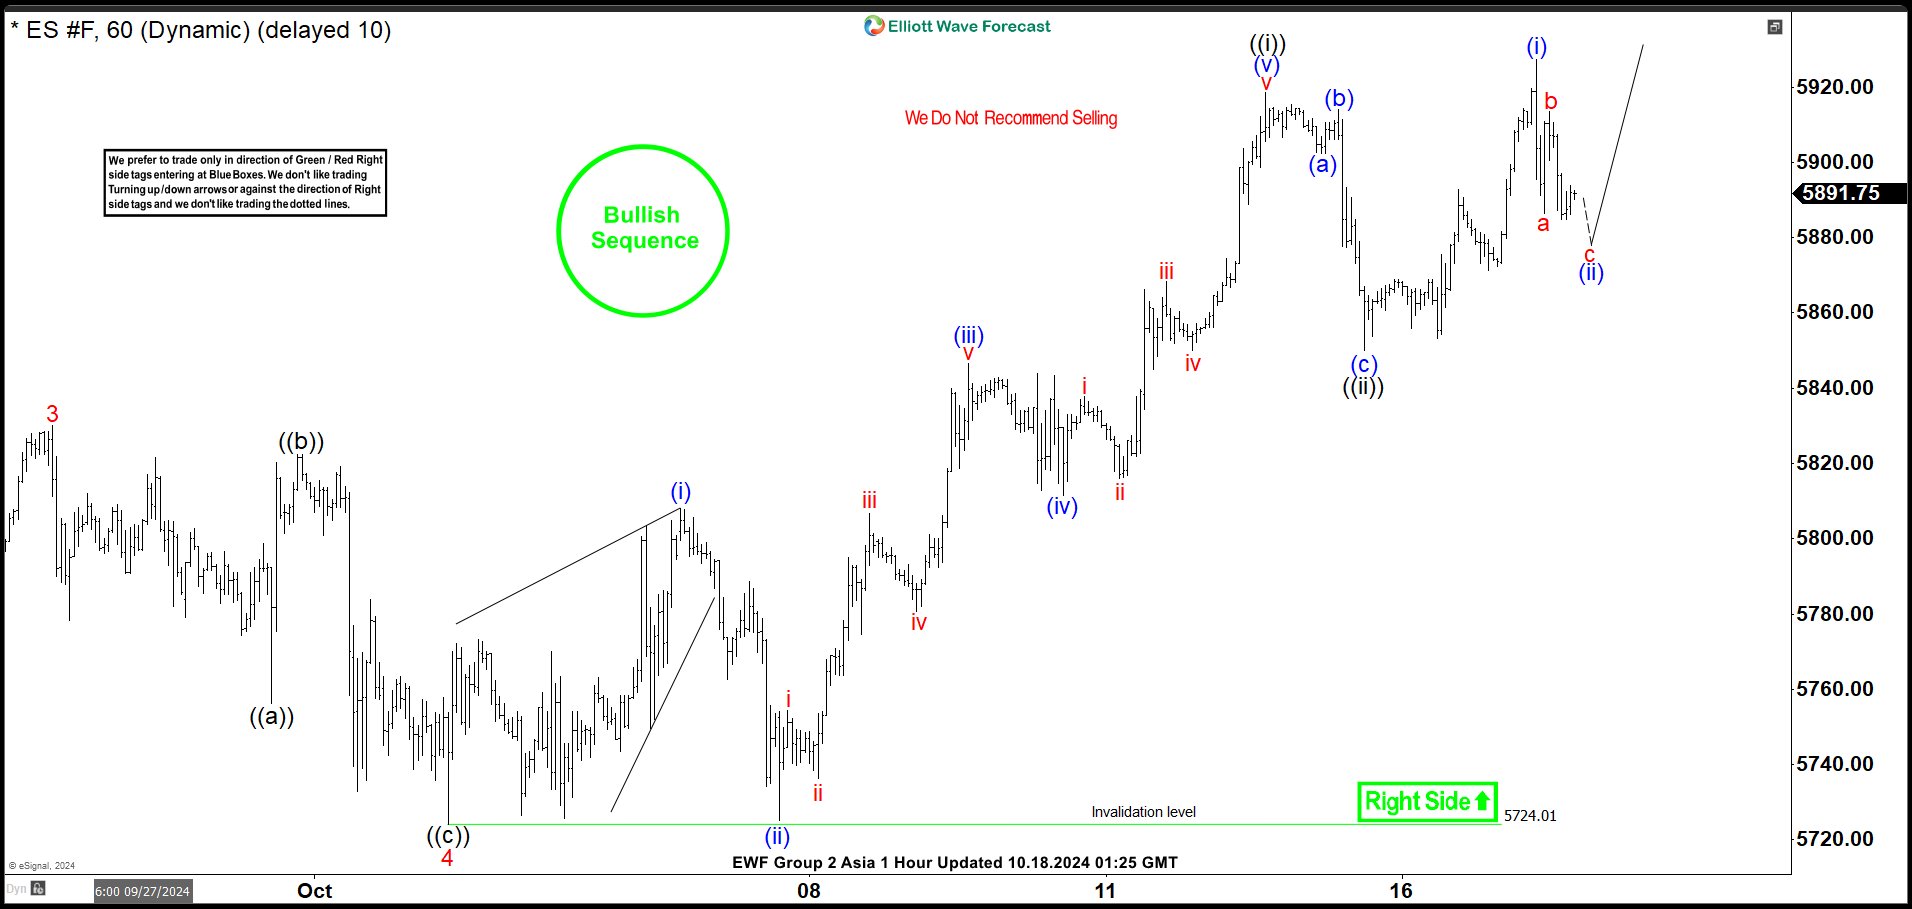
Short Term Elliott Wave View in S&P 500 Futures (ES) suggests that cycle from 8.5.2024 low is in progress as a 5 waves impulse. Up from 8.5.2024 low, wave 1 ended at 5669.75 and dips in wave 2 ended at 5394. The Index extends higher in wave 3 towards 5830 and pullback in wave 4 ended at 5724. Internal subdivision of wave 4 unfolded as a zigzag structure. Down from wave 3, wave ((a)) ended at 5756.2 and wave ((b)) ended at 5822.50. Wave ((c)) lower ended at 5724 which completed wave 4 in higher degree.
The Index has resumed higher in wave 5. Up from wave 4, wave (i) ended at 5808 and pullback in wave (ii) ended at 5725.25. Wave (iii) higher ended at 5846.50 and pullback in wave (iv) ended at 5811.50. Final leg wave (v) ended at 5918.50 which completed wave ((i)) in higher degree. Correction in wave ((ii)) is proposed complete at 5850 with internal subdivision as a zigzag structure. The Index then resumed higher in wave ((iii)). Up from wave ((ii)), wave (i) ended at 5927.25. Near term, as far as pivot at 5724.01 low stays intact, expect pullback to find support in 3, 7, or 11 swing for further upside.
S&P 500 Futures (ES) 60 Minutes Elliott Wave Chart
ES_F Elliott Wave Video
https://www.youtube.com/watch?v=aDL8MZSnkok
ECB Review: A Rate Cut – and Awaiting More Data
- Today, the ECB cut rates for the third time this year, bringing the deposit rate to 3.25% in line with expectations. The weakness in the incoming economic data since the last GC meeting was acknowledged by Lagarde, and that data has led to further confidence the inflation path is on track, leading to the rate cut. Today’s decision was unanimous.
- Markets traded mostly sideways through the press conference as no guidance was given of how aggressive the cutting cycle will be or the potential end-point.
‘Well on track’
The ECB judged that since the last GC meeting in September ‘The incoming information on inflation shows that the disinflationary process is well on track.’ And that the ‘inflation outlook is also affected by recent downside surprises in indicators of economic activity’. This morning the final inflation release also confirmed the surprisingly low inflation momentum, driven by services, which supported the ECB’s assessment. During the press conference Lagarde said they were ‘all a little bit surprised by the acceleration’, with a reference to the inflation print of 1.7% y/y in September.
Downside risks gaining traction
Listening to Lagarde today, it was clear that the weakening of ‘all indicators’ since the last meeting has come as a surprise for the governing council. This raises the question of whether the ECB should intensify its efforts towards policy easing. However, the ECB is still seeking clarity on whether the current tight financial conditions have adequately addressed the underlying drivers of inflation. The labour market continues to demonstrate resilience, although employment has recently plateaued, and domestic inflation remains high at nearly 4% (3.9% in September), propelled by sustained wage pressures. The ECB still observes signs of profit margins absorbing rising costs, which is crucial for the continuation of the disinflationary process. However, it remains concerned that the current resumption of household purchasing power might fuel future inflation. The substantial data package (e.g. 2 x PMI, 2 inflation prints) prior to the December meeting could become instrumental for the staff projections and to what degree the risk of undershooting the inflation target has risen recently. At today’s meeting, Lagarde remained hesitant about making any clear judgements, but recall that just a month ago, ECB members seemed split on the need to cut rates at the October meeting. Today, the decision was taken unanimously.
Still restrictive, but for how long?
The ECB’s decision also included an interesting reference to financing conditions remaining restrictive; however, with the weak economic activity and disinflationary process on track, the question becomes for how long should we expect the ECB policy stance to stay restrictive? In our baseline scenario, we see the ECB only cutting to 2%, which is broadly considered the neutral policy rate by the end of next year. However, the bigger question remains whether there is a risk of the ECB feeling the need to cut slightly below that. Markets are pricing this at around 40% Reading the Markets EUR: Yield Outlook - From restrictive to neutral. Sell 15Y Finland
Sunset Market Commentary
Markets
The ECB’s unanimous back-to-back rate cut brought the deposit rate to 3.25% today. This third rate reduction came earlier than analysts and the ECB itself expected in the days after the September 12 policy meeting. “The incoming information on inflation shows that the disinflationary process is well on track. The inflation outlook is also affected by recent downside surprises in indicators of economic activity”, the statement noted. The emphasized part is referring to the awful September PMI’s (Sep 23) that suggested the euro area economy had started to contract (composite 49.6). They were the sole reason for the U-turn first made by Lagarde before parliament (Sep 30) with other governors following suit in the days thereafter. According to the ECB president this is exactly what “data dependency” means. As she went into more detail she noted investment, consumption and exports are all still weak. That should pick up thanks to a boost in real incomes and looser monetary policy but risks to growth remain tilted to the downside for now. Inflation dropped to just 1.7% in September but is expected to edge higher again in coming months (base effects) and as domestic inflation remains high (wages rising at an elevated pace). Services inflation remains at an elevated 3.9% and prevents the ECB from formally declaring victory over the matter. Lagarde deep into the presser did say that risks to inflation are now more on the downside and not on the upside. Nevertheless, it sticks to a data-dependent and meeting-by-meeting approach. That was again obvious when asked if the ECB was now on track for cuts at every meeting. With amongst others two more PMIs, two more CPIs, Q3 GDP and wage growth data due ahead of the December meeting, investors better brace for some serious market volatility. European yields lose some ground today with front end (-2 to -3 bps) outperforming. Follow-up rate cuts are fully priced in for the next four upcoming meetings with the fifth for 85% discounted. The terminal rate stayed unchanged at <2%. That’s remarkable for an economy that according to the ECB is not headed for a recession but a soft landing. EUR/USD (1.082, from 1.086) declined but that was mainly the result of US data coming in on the strong side of expectations. In particular retail sales (0.4-0.7% depending on the gauge) were outright good with 10 out of the 13 categories rising with a drop in international oil market prices probably responsible for one of the three categories printing declines (gasoline stations -1.6% m/m). Weekly jobless claims eased from the sharp uptick last week to 260k from 241k vs 259k expected and the Philly Fed business outlook jumped from 1.7 to 10.3 compared to a way more moderate analyst consensus (3). Details were solid (expect for number of employees) and the six month ahead outlook rose to its highest level since July to hover around three-year highs.
News & Views
The Turkish central bank (CBRT) kept its policy rate unchanged at 50% for a seventh consecutive meeting today. The policy statement didn’t alter much from previous month. Taking into account the lagged effects of monetary tightening, the Committee will make its policy decisions so as to create the monetary and financial conditions necessary to ensure a decline in the underlying trend of inflation and to reach the 5% inflation target in the medium term. The decisiveness regarding tight monetary stance will bring down the underlying trend of monthly inflation (which slightly increased in September) through moderation in domestic demand, real appreciation in Turkish lira, and improvement in inflation expectations. The latter together with pricing behavior continue to pose upward risks. EUR/TRY continues to trade close to all-time highs around 37.20.
Hungarian central bank’s influential deputy governor Virag said that he’s ready to pause interest-rate cuts for an extended period, completing the U-turn following September guidance that a 25 bps rate cut is on the table at every remaining policy meeting this year. Earlier he already suggested a skip in October, now he implies skipping all together this year. “If the external environment and inflation outlook justify, the base rate may stay unchanged for a sustained period, raising our interest premium.” The MNB is obviously closely monitoring its currency and wants to avoid an unwarranted further weakening beyond EUR/HUF 400.