Sample Category Title
Ethereum Fails to Record a Higher High
- Cryptocurrencies are mostly in demand this week
- Ethereum rallies but fails to overcome the 2,667 level
- Momentum indicators are mostly bullish
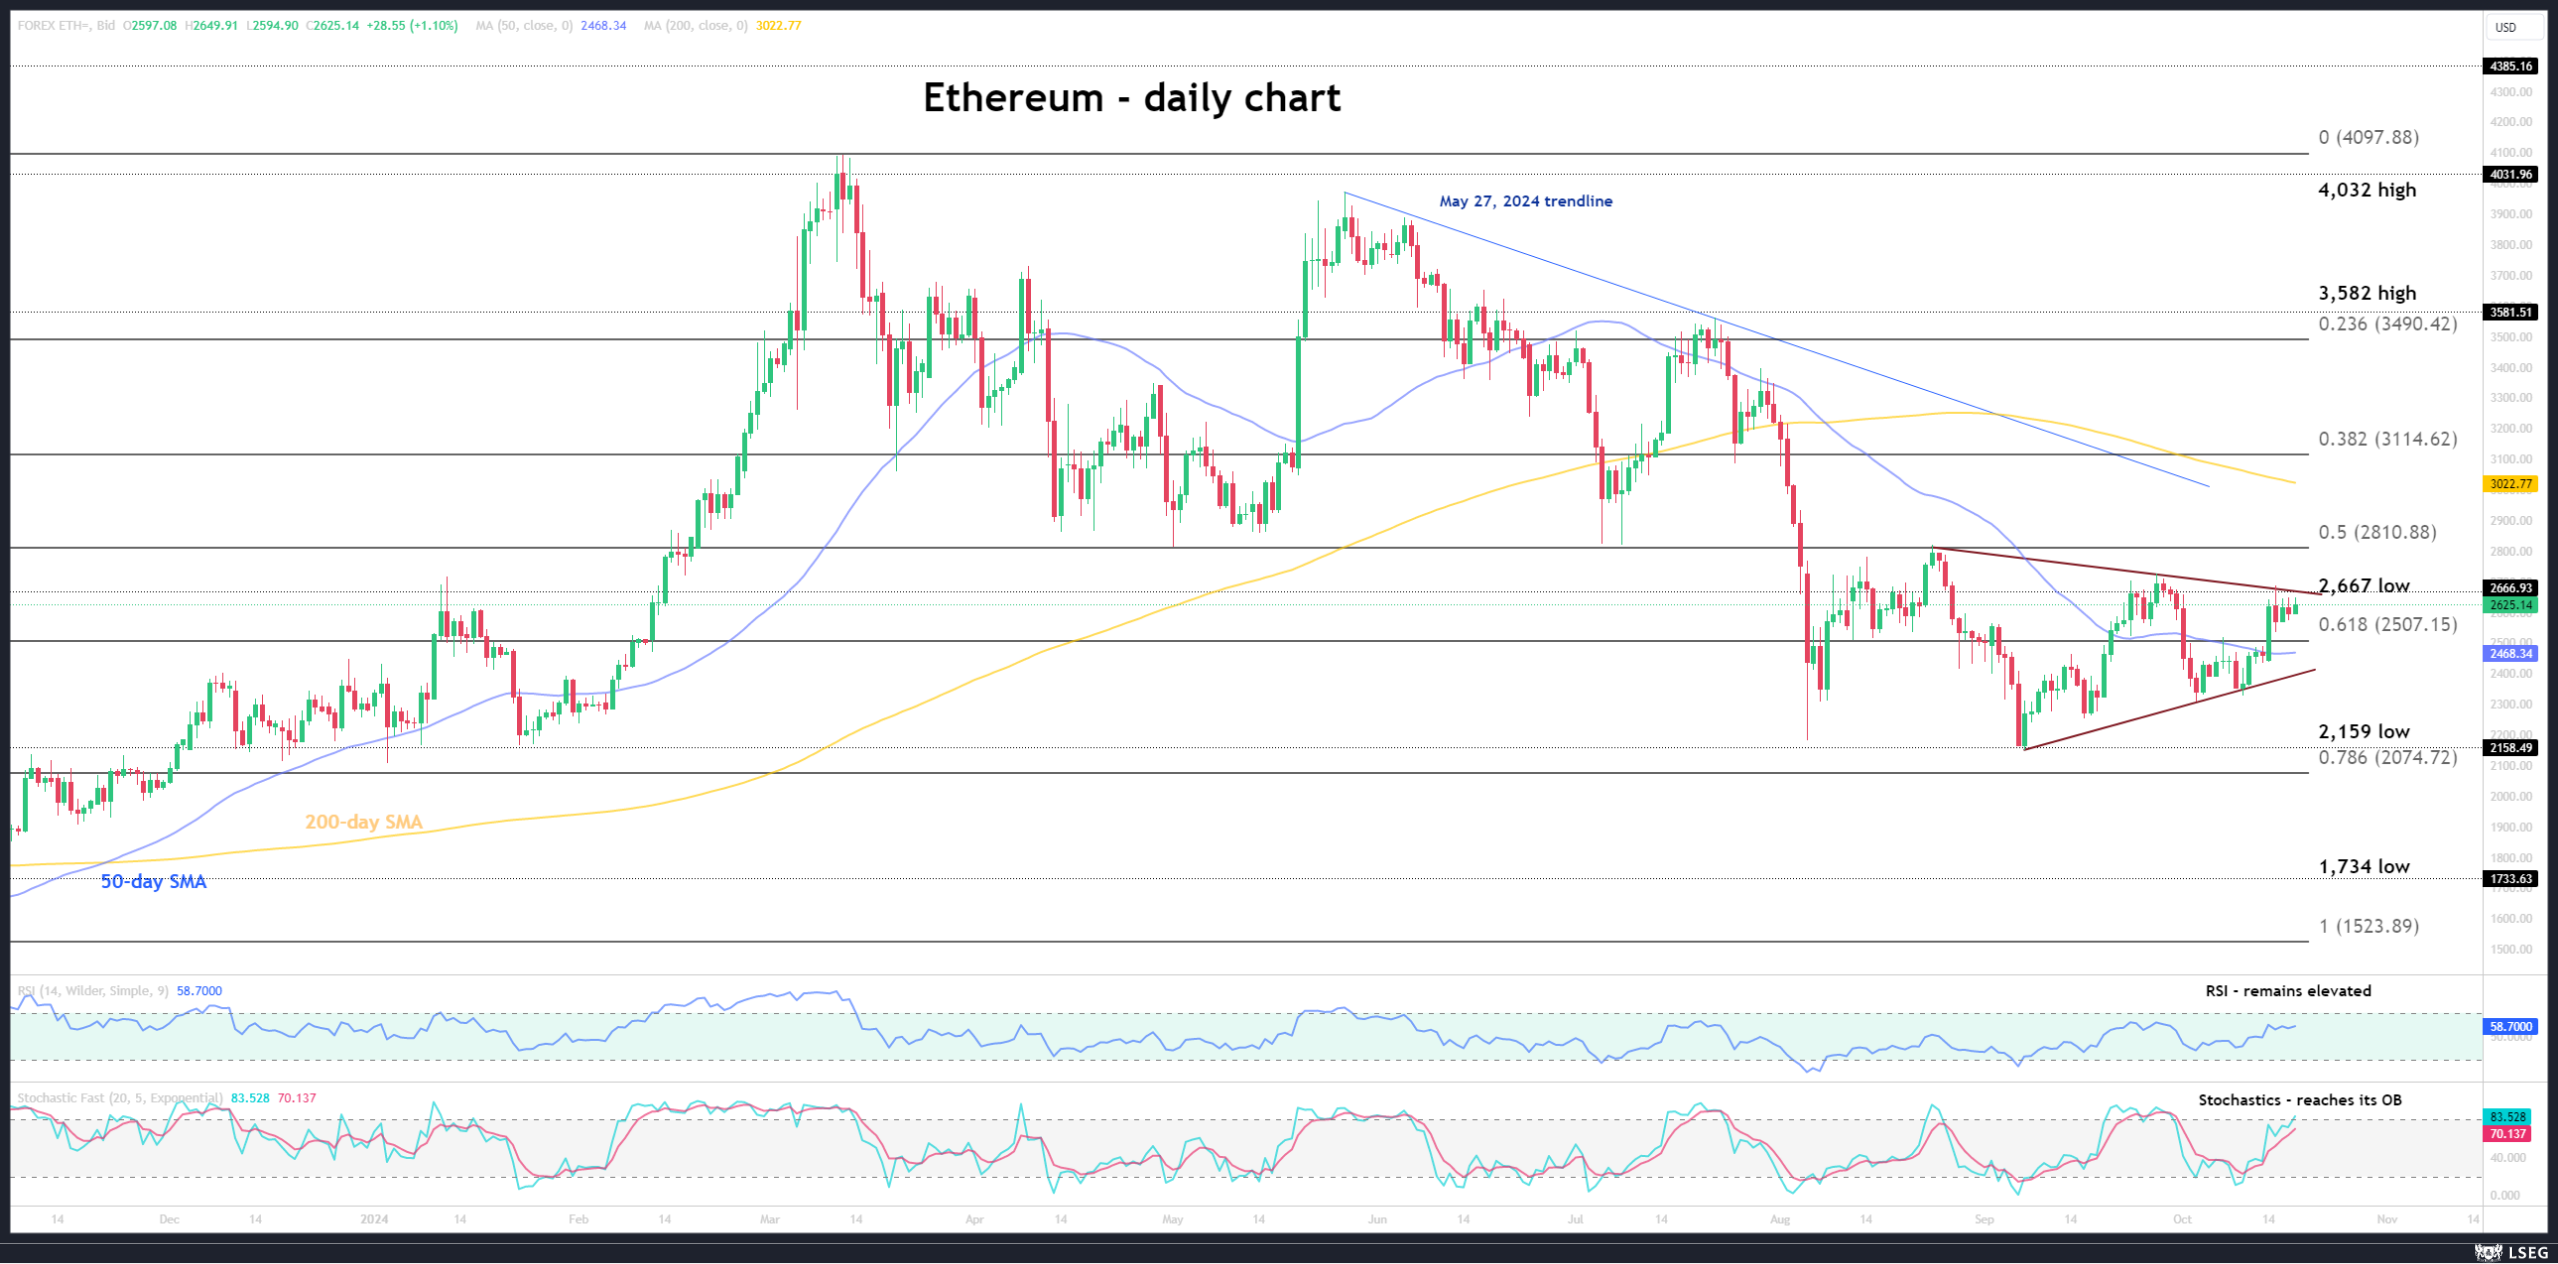
Following Monday’s strong upleg, ethereum is experiencing a few quiet sessions by trading in a tight range. It is in the green today, but it remains stuck below the mid-September 2021 low of 2,667. Contrary to bitcoin’s strong performance and despite the positive newsflow, ethereum has failed to surpass the late-September peak, and hence continues to trade inside a developing symmetrical triangle.
In the meantime, the momentum indicators are bullish. The RSI is hovering comfortably above its midpoint, revealing a decent bullish pressure in ethereum. Interestingly, the stochastic oscillator has returned inside its overbought territory (OB), building a decent gap from its moving average (MA), but it is still far from testing its early October highs.
Should the bulls remain confident, they would try to finally overcome the 2,667 level and stage a decisive breakout above the triangle pattern. If successful, they could then test the resistance set by the 50% Fibonacci retracement level of the October 13, 2023 – March 12, 2024 uptrend, and have the chance to record a new 2-month high. Even higher, the path could become trickier with the 200-day SMA being the next key resistance level.
On the other hand, the bears are anxiously trying to engineer a move lower. The 61.8% Fibonacci retracement level and the 50-day SMA stand in their way at 2,507 and 2,468 respectively. The lower trendline of the developing triangle pattern will probably be the next support area, before the bears set their eyes on the 2,159 low.
To conclude, despite Monday’s rally, ethereum has failed to take advantage of the continued positive newsflow and record a higher high.
Australian Dollar Higher as Job Growth Surges
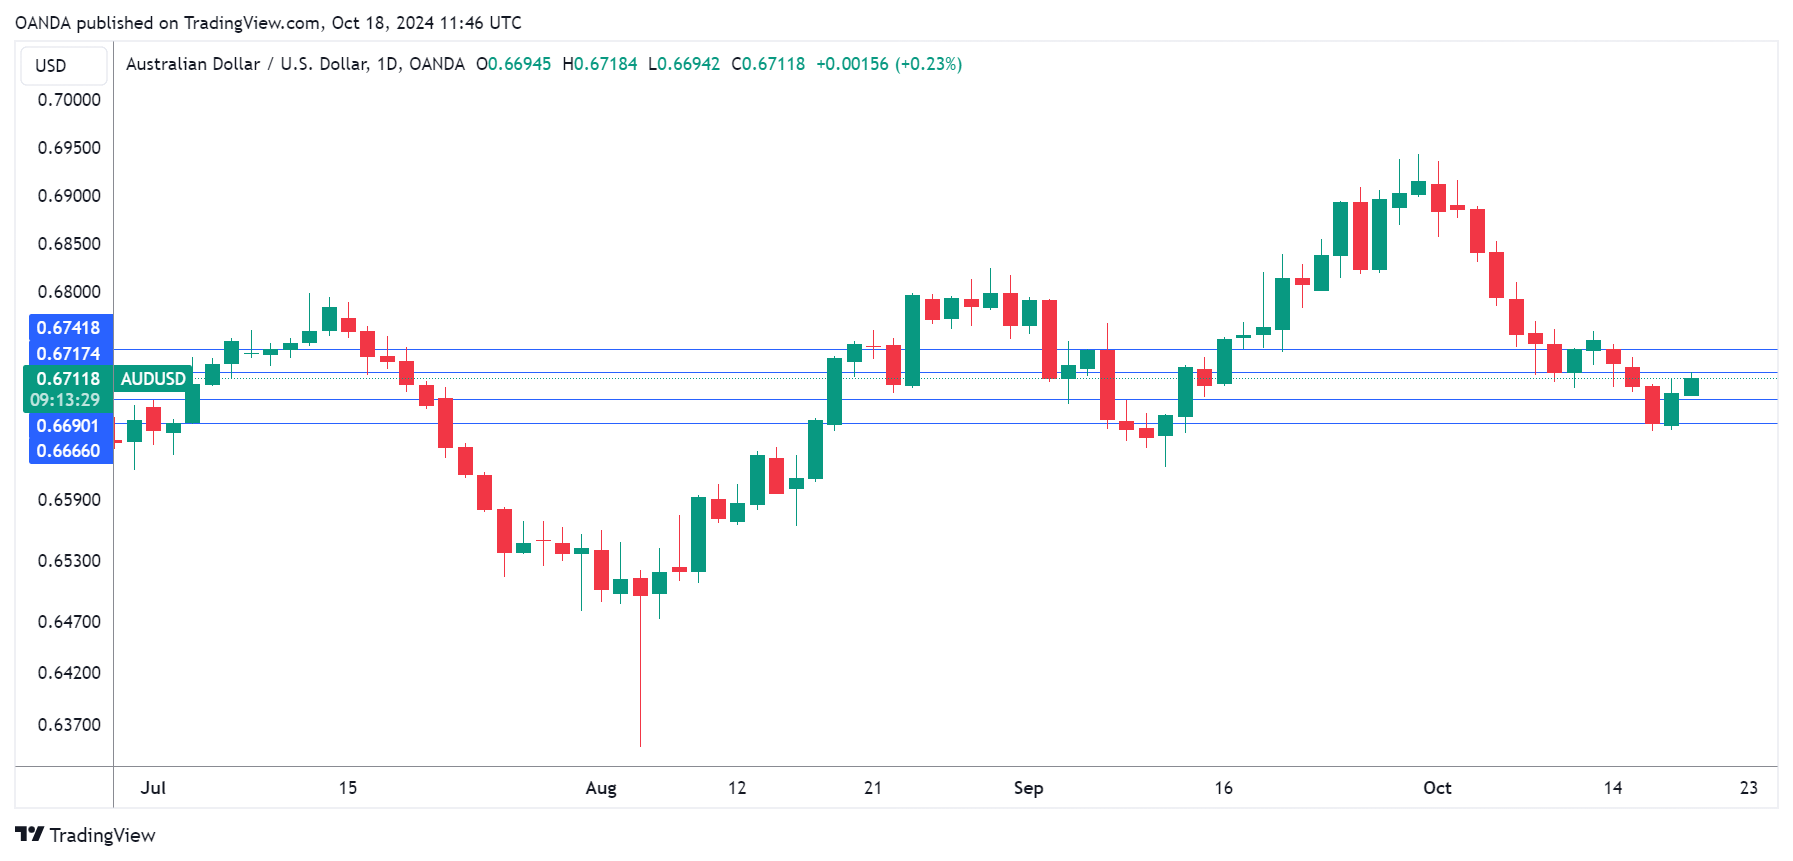
The Australian dollar is up for a second straight day on Friday. In the European session, AUD/USD is trading at 0.6712, up 0.24%. The Aussie is having a miserable October, having lost 2.9%.
Australian employment change soars
Australian job growth sparkled in September with a gain of 64.1 thousand. This was higher than the revised 42.6 thousand in August and crushed the market estimate of 25,000. The report was especially impressive as full-time employment jumped by 51.6 thousand, rebounding from -5.9 thousand in August.
The labor market remains resilient, despite the sputtering economy which has been choked by high interest rates. The Reserve Bank of Australia is yet to join the rate-cutting cycle embraced by most major central banks, with the key rate at 4.35%.
The central bank has maintained rates for almost a year and isn’t expected to start trimming until early 2025. With the labor market still tight, the RBA can afford to prolong its “higher for longer” rate stance. The RBA makes its next rate decision on November 5 and is widely expected to stay on the sidelines.
US retail sales jump
US retail sales rose 0.4% in September, above the 0.1% gain in August and beating the market estimate of 0.3%. A key driver of the strong gain was the sharp drop in gasoline prices. Annually, retail sales eased to 1.7%, below the revised 2.2% gain in August but above the forecast of 1.6%.
The positive retail sales data is a sign that the US economy posted solid growth in the third quarter. This supports the case for the Fed to deliver quarter-point rate cuts in both November and December. The Federal Reserve chopped rates by an oversized half-point in September but that hefty cut is expected to be a one-time move, barring a sudden deterioration in economic data.
AUD/USD Technical
EUR/USD Dips After ECB Lower Rates
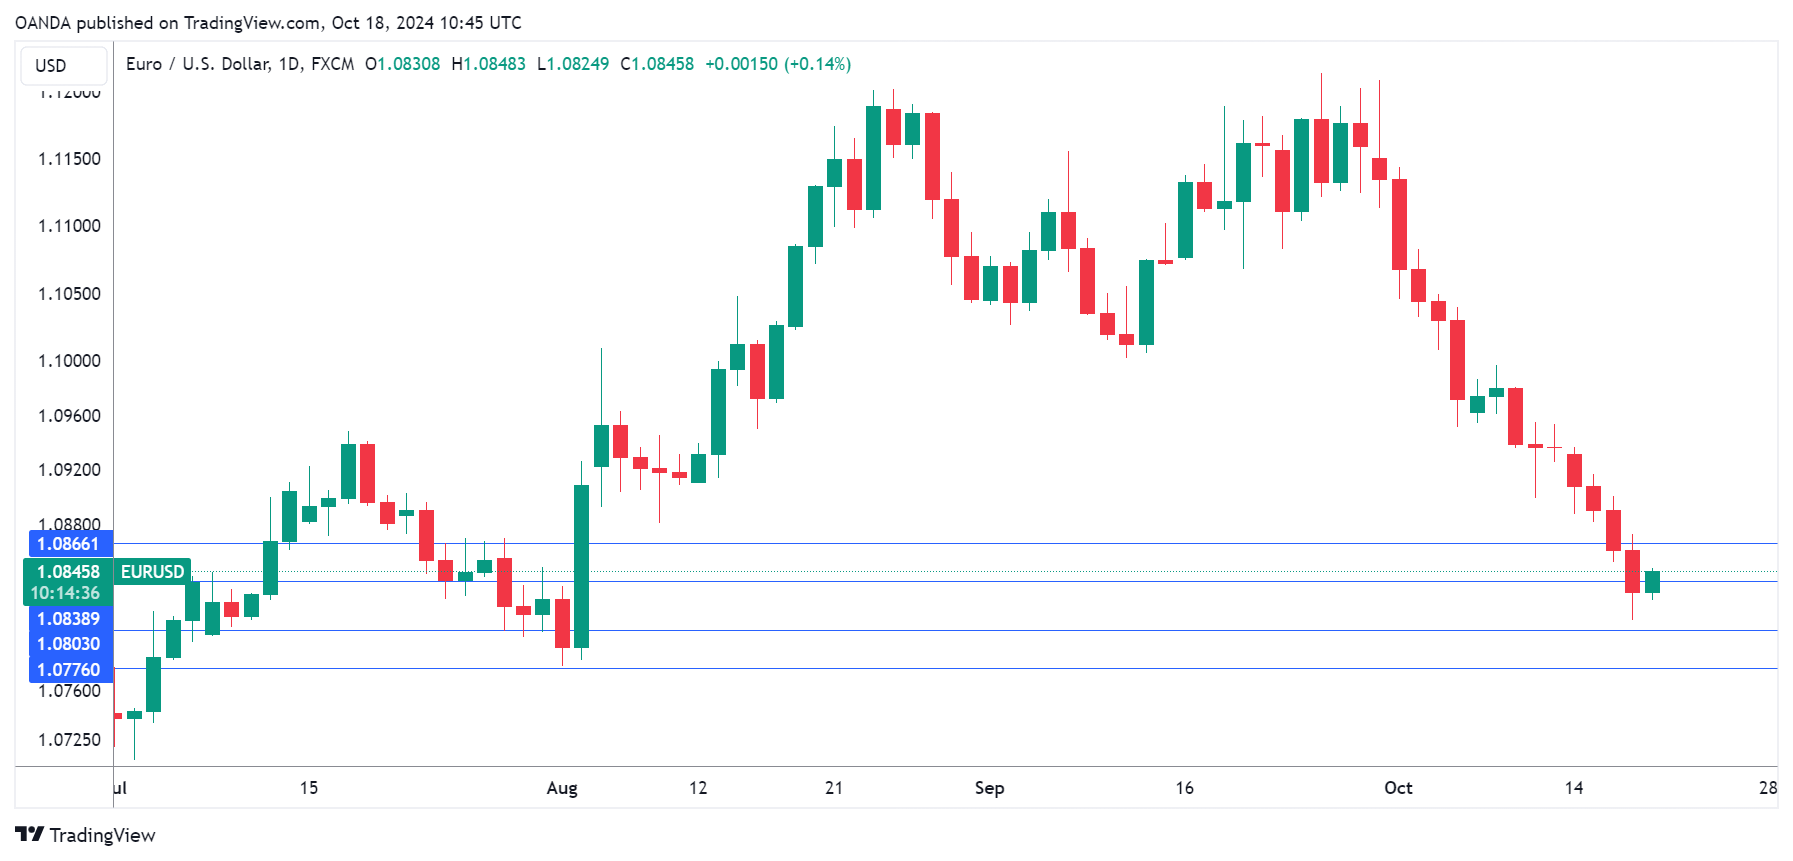
The euro can’t find its footing and has tumbled 2.7% in October. EUR/USD has stabilized on Friday and is trading at 1.0835 in the European session, up 0.05%. On Thursday, the euro dropped as low as 1.0810, its lowest level since August 2.
ECB cuts key rate to 3.25%
The European Central Bank didn’t surprise anybody with a quarter-point rate cut on Thursday, the first back-to-back rate cuts since December 2011. The markets had fully priced in the move and the euro responded with slight losses. ECB President Lagarde has discarded forward guidance and stressed that rate decisions will be on a meeting-by-meeting basis, but the markets smelled a rate cut, with low inflation and weak economic growth.
The rate statement was optimistic, noting that the “disinflationary process is well on track” and that the inflation outlook had improved due to “recent downside surprises” in economic activity.
The ECB has cut rates three times this year and is expected to remain aggressive. The markets expect are forecasting rate cuts of 25 basis points at each of the next three meetings.
The eurozone inflation release, made just before rate announcement on Thursday, showed inflation falling to 1.7% y/y, down from the initial estimate of 1.8% and below the 2.2% gain in August. The decline in inflation was helped by a sharp drop in energy prices. Services inflation remains high but eased to 3.1% y/y, down from 2.9% in August. The inflation report reached a milestone, dropping below the ECB’s target of 2% for the first time since July 2021.
EUR/USD Technical
- EUR/USD has pushed below support at 1.0901 and is testing support at 1.0901. Below, there is support at 1.0865
- 1.0956 and 1.0975 are the next resistance lines
USDJPY Adjusts Amid Mixed Signals from Japan’s Economic Data
USD/JPY is experiencing a correction phase following two days of gains, as mixed economic signals emerge from Japan. Despite ongoing expectations for monetary tightening by the Bank of Japan (BoJ), the yen faces downward pressure from a slowdown in domestic inflation, which could potentially dampen the urgency for immediate rate hikes.
In September, Japan's consumer prices increased by 2.5% year-on-year, marking a decrease from the 3.0% inflation rate recorded in August. This slowdown is the first since March and represents the lowest inflation level since April of this year. The core inflation index, a key metric for the BoJ, rose by 2.4%, down from 2.8% in August, yet has remained above the BoJ's target of 2.0% for 30 consecutive months. Notably, inflation excluding food and energy was recorded at 2.1% in September, a slight increase from 2.0% in August.
Recent comments from BoJ board member Seiji Adachi suggest a preference for moderate rate adjustments, reflecting concerns over global economic uncertainty and the domestic pace of wage increases. Additionally, the yen's persistent weakness has drawn attention from Japan's Chief Monetary Representative Atsushi Mimura, who reiterated the government's focus on monitoring exchange rate fluctuations and its stance against excessive volatility.
USD/JPY technical analysis
The USD/JPY pair recently achieved a peak at 150.30 and is now forming a decline towards 149.75, testing this level from above. Looking ahead, we anticipate a potential resurgence towards 151.15. A successful breach of this level could open the way to 152.09. Conversely, a drop below 149.70 could trigger a further correction down to 147.70. The MACD indicator supports this potential upward trajectory, with the signal line positioned above zero and poised to reach new highs.
On the hourly chart, USD/JPY has established a consolidation range between 149.75 and 150.30. The current market dynamics suggest a correction towards 149.75. Following this correction, the likelihood of a rebound to 150.65 appears feasible, setting the stage for an extended rise to 151.15. This bullish outlook is corroborated by the Stochastic oscillator, with its signal line advancing from 20 towards 80, indicating a strengthening momentum for upward movement.
Pound Rises on Strong UK Retail Sales
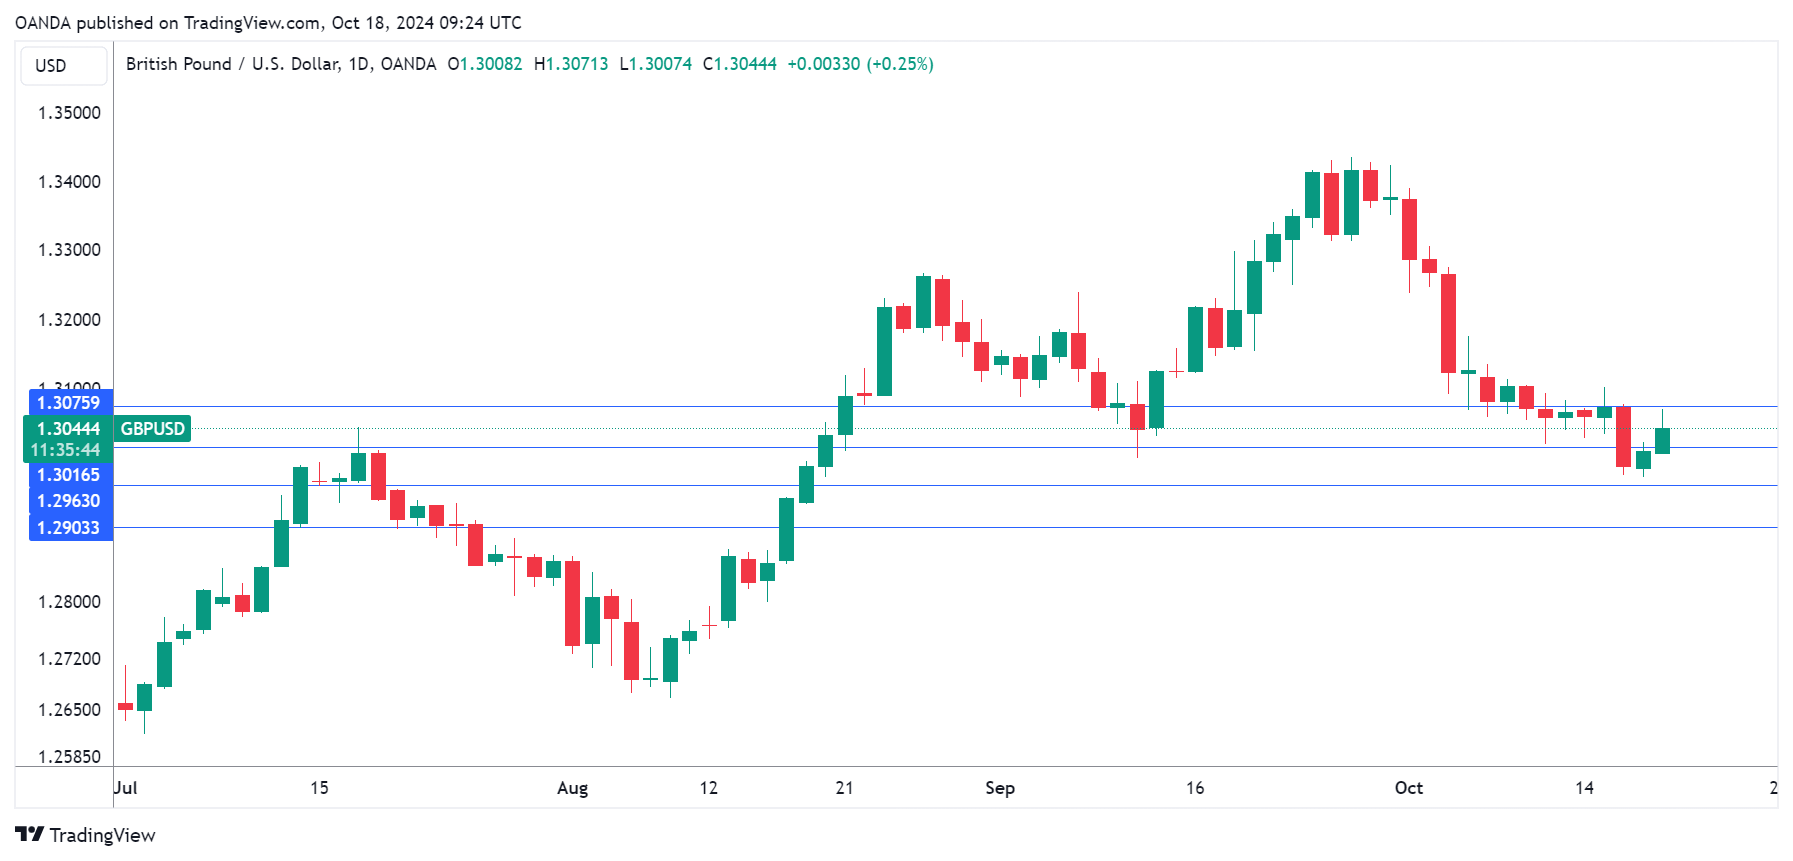
The British pound has extended its gains on Friday. In the European session, GBP/USD is trading at 1.3046, up 0.27% on the day.
UK retail sales stronger than expected
UK retail sales are moving in the right direction. Retail sales increased for a third straight month in September, rising 0.3% m/m. That was lower than the 1% increase in August but beat the market estimate of -0.3%. Annually, retail sales climbed 3.9%, up from a revised 2.3% in August and higher than the market estimate of 3.2%. This was the largest annual rise since February 2022.
The positive retail sales report will be welcome news for the government, with Finance Minister Reeves presenting the Annual budget on Oct. 30. Reeves has warned that the budget will contain “tough measures” and is expected to include spending cuts and tax hikes. Consumers have cut back on discretionary items and a tough budget would likely dampen consumer spending.
In the US, retail sales showed a solid gain in September, helped by lower gasoline prices. Retail sales jumped 0.4%, above the 0.1% gain in August and the market estimate of 0.3%. Annually, retail sales eased to 1.7%, below the revised 2.2% gain in August but above the forecast of 1.6%.
The strong September data is a positive sign that third-quarterly growth was solid, which will support the case for the Fed to deliver quarter-point cuts in November and December. The Federal Reserve chopped rates by 50-bps in September but the jumbo rate cut is expected to be a one-time move, barring a sudden deterioration in economic data.
GBP/USD Technical
- GBP/USD is testing resistance at 1.3016. The next resistance line in 1.3076
- 1.2963 and 1.2903 are the next support levels
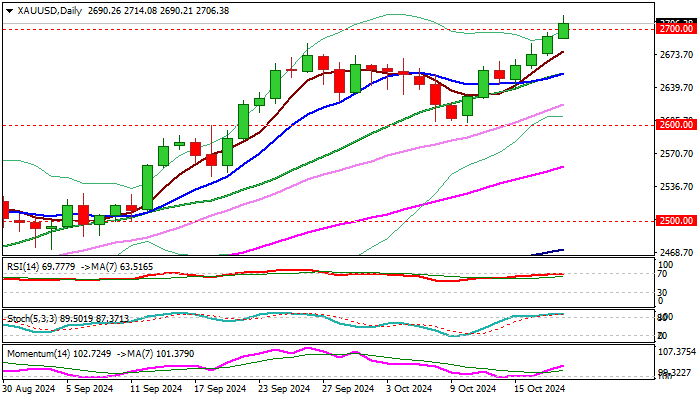
XAU/USD Outlook: Gold Hits New Historical High Above Psychological $2700 Level
Gold cracked psychological $2700 barrier and hit new historical high on Friday morning.
Looser monetary policy conditions continue to support the price, along with growing nervousness over US election, with the latest threats of further escalation of the war in the Middle East, sparking increased demand for safe haven bullion.
Fresh rise of gold price offsets forecasts of a number of markets analysts who expected the price to stay capped under $2700 until the end of the year, while the latest advance contributes to my comments from the last year and prediction that the yellow metal would hit $3000 per ounce in 2024.
Fundamentals remain key driver of gold price with very favorable conditions supporting scenario.
It is now a matter of time when the gold will reach key target, with overheated geopolitical situation to possibly spark stronger acceleration higher in case of further deterioration of crisis.
Breach of $2700 may not result in immediate clear break higher, but with consolidation preceding further gains, as daily studies are overbought.
Partial profit taking likely to result in limited dips (ideally to be contained by $2685/$2676 (former all-time high / rising 10DMA) and not to exceed climbing 10DMA ($2654) to signal a healthy correction and provide better levels to embark larger bull-trend.
Close above $2700 to generate fresh bullish signal and open way for test of Fibo projections at $2717 / $2736 and $2748, guarding $2768 and $2800.
Res: 2717; 2736; 2748; 2768.
Sup: 2700; 2690; 2685; 2676.
BoJ’s Ueda stresses vigilance amid global uncertainty, cautions on market volatility
In a speech today, BoJ Governor Kazuo Ueda highlighted the persistent uncertainties surrounding Japan’s economic recovery and global market conditions, urging caution in assessing the outlook.
Ueda emphasized the "still high" level of unpredictability in the overseas economic environment, particularly noting volatility in key markets such as the US.
"The overseas economic outlook, including that for the United States, remains uncertain, while market moves continue to be unstable," Ueda remarked.
"We must closely monitor such developments with high vigilance, and scrutinize their fallout on Japan's economic and price outlook," he said, underlining that Japan’s recovery remains fragile and exposed to global economic shifts.
GBP/USD Takes Hit While USD/CAD Remains in Uptrend
GBP/USD started a fresh decline below the 1.3200 zone. USD/CAD is rising and might aim for more gains above the 1.3820 resistance.
Important Takeaways for GBP/USD and USD/CAD Analysis Today
- The British Pound started a major decline from the 1.3400 resistance zone.
- There was a break above a key bearish trend line forming with resistance at 1.3000 on the hourly chart of GBP/USD at FXOpen.
- USD/CAD is showing positive signs above the 1.3745 support zone.
- There was a break above a major bearish trend line with resistance at 1.3765 on the hourly chart at FXOpen.
GBP/USD Technical Analysis
On the hourly chart of GBP/USD at FXOpen, the pair struggled to continue higher above the 1.3400 resistance zone. The British Pound started a downside correction and traded below the 1.3200 support zone against the US Dollar.
The pair even traded below 1.3040 and the 50-hour simple moving average. Finally, the bulls appeared near the 1.2975 level. A low was formed at 1.2973 and the pair is now consolidating losses. There was a minor recovery wave above the 23.6% Fib retracement level of the downward move from the 1.3102 swing high to the 1.2973 low.
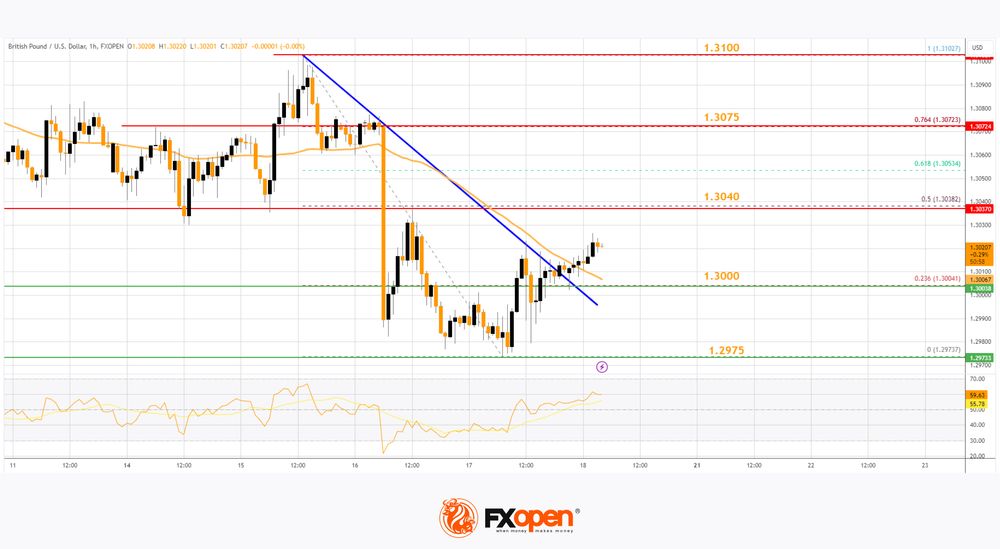
Besides, there was a break above a key bearish trend line forming with resistance at 1.3000. Immediate resistance on the upside is 1.3040 or the 50% Fib retracement level of the downward move from the 1.3102 swing high to the 1.2973 low.
The first major resistance is near the 1.3075 zone. The main hurdle sits at 1.3100. A close above the 1.3100 resistance might spark a steady upward move. The next major resistance is near the 1.3180 zone. Any more gains could lead the pair toward the 1.3220 resistance in the near term.
Initial support on the GBP/USD chart sits at 1.3000. The next major support sits at 1.2975, below which there is a risk of another sharp decline. In the stated case, the pair could drop toward 1.2900.
USD/CAD Technical Analysis
On the hourly chart of USD/CAD at FXOpen, the pair formed a strong support base above the 1.3600 level. The US Dollar started a fresh increase above the 1.3700 resistance against the Canadian Dollar.
The bulls pushed the pair above the 1.3750 and 1.3765 levels. Recently, there was a break above a major bearish trend line with resistance at 1.3765 and the 50-hour simple moving average. The pair climbed above the 50% Fib retracement level of the downward move from the 1.3838 swing high to the 1.3746 low.
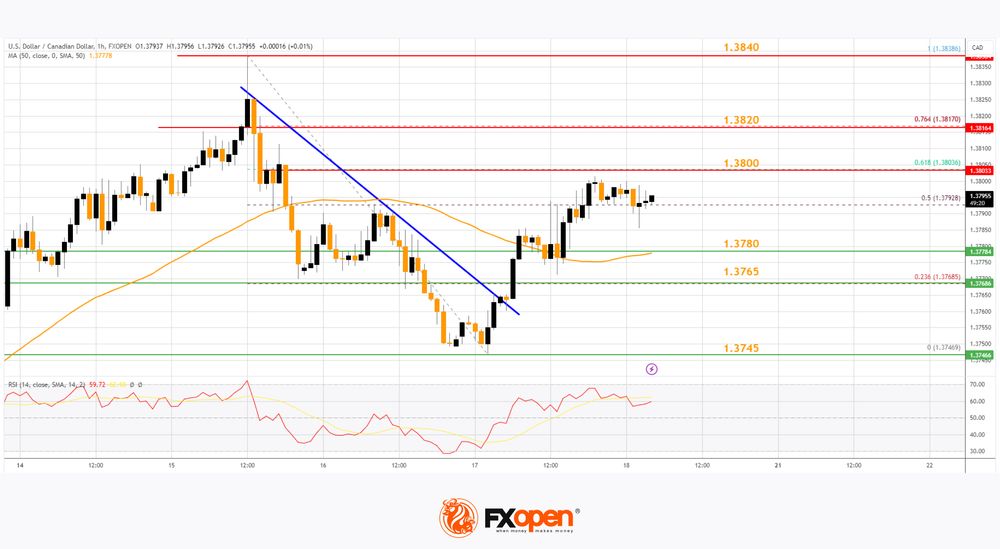
If there is another increase, the pair might face resistance near the 1.3800 level or the 61.8% Fib retracement level of the downward move from the 1.3838 swing high to the 1.3746 low.
A clear upside break above 1.3800 could start another steady increase. The next major resistance is the 1.3820 level on the same USD/CAD chart. A close above the 1.3820 level might send the pair toward the 1.3840 level. Any more gains could open the doors for a test of the 1.3910 level.
Initial support is near the 1.3780 level. The next major support is 1.3765. The main support sits near the 1.37450 zone. A downside break below the 1.3745 level could push the pair further lower. The next major support is near the 1.3700 support zone, below which the pair might visit 1.3650.
Trade over 50 forex markets 24 hours a day with FXOpen. Take advantage of low commissions, deep liquidity, and spreads from 0.0 pips. Open your FXOpen account now or learn more about trading forex with FXOpen.
This article represents the opinion of the Companies operating under the FXOpen brand only. It is not to be construed as an offer, solicitation, or recommendation with respect to products and services provided by the Companies operating under the FXOpen brand, nor is it to be considered financial advice.
EURGBP Goes Back to a Downtrend
- EURGBP charts new 2 ½-year low after UK retail sales beat estimates
- Short-term bias is skewed to the downside, but price near familiar support line
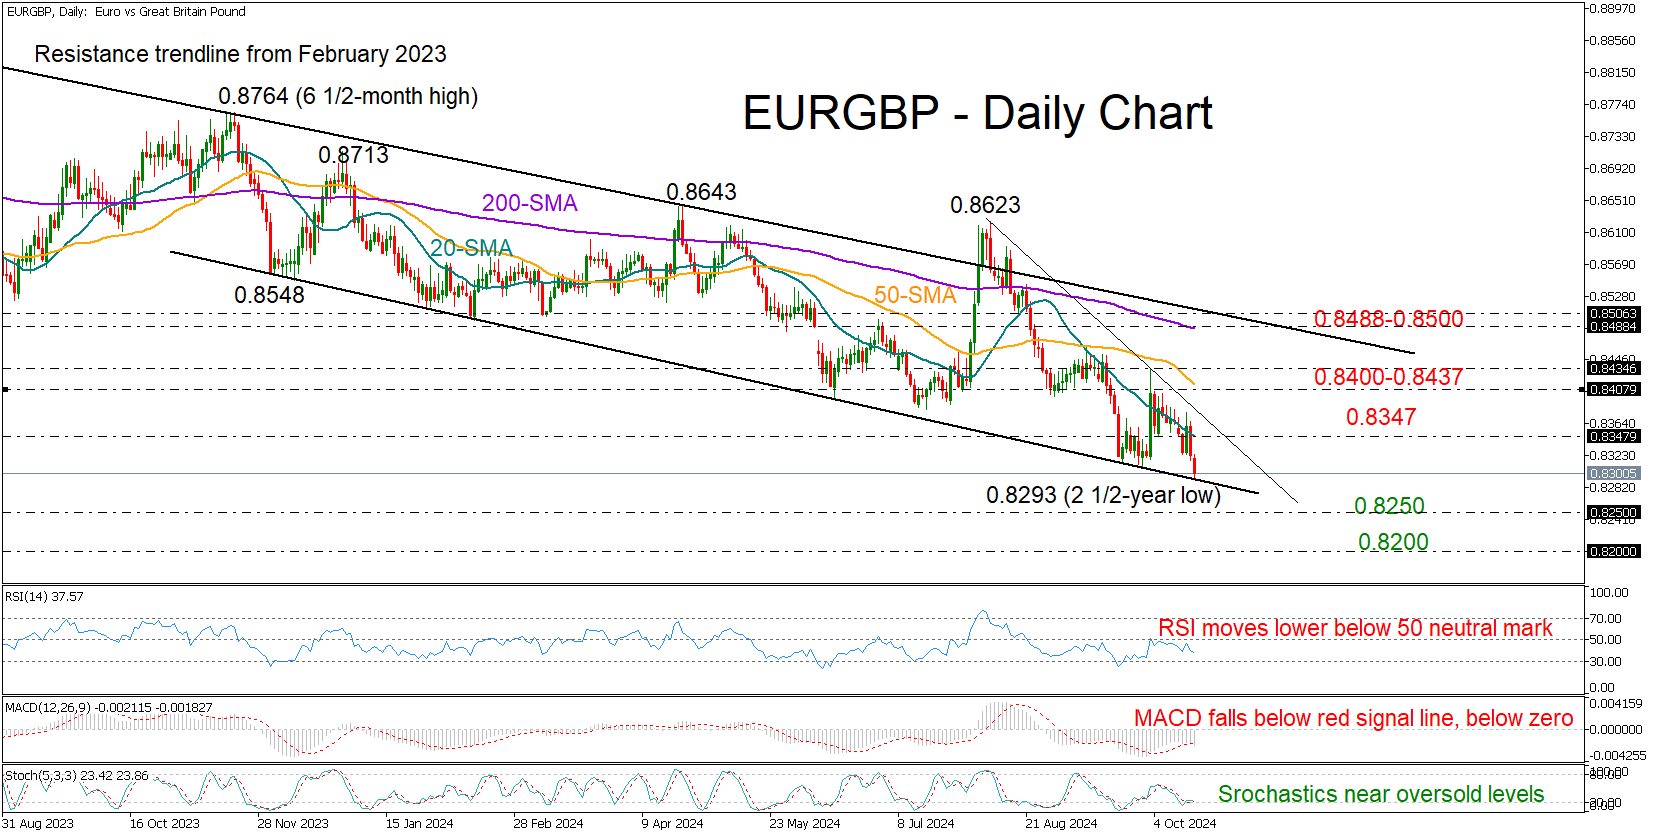
EURGBP plunged to a new 2½-year low of 0.8293, weighed by upbeat UK retail sales at 4.0% y/y and a dovish ECB policy stance, which raised concerns about the eurozone's growth.
The outlook appears grim: the RSI is declining in bearish territory, and the MACD has crossed below its signal line. However, the stochastic oscillator hints at a potential rebound from oversold levels as the price tests a critical support line established in December 2023.
If selling pressure persists below 0.8300, the pair could halt within the 0.8200-0.8250 range, a pivotal area from which the uptrend to 0.9249 began in 2022. A breach here could push the price towards 2016 levels and particularly to 0.8150.
Conversely, if buyers step in, immediate resistance could come from the 20-day simple moving average (EMA) at 0.8347. A step beyond 0.8400 could retest October's high of 0.8433 and then the 200-day SMA at 0.8488 and the falling resistance line from February 2023 at 0.8500.
In summary, EURGBP's downward trajectory continues, with limited signs of a bullish reversal on the horizon.
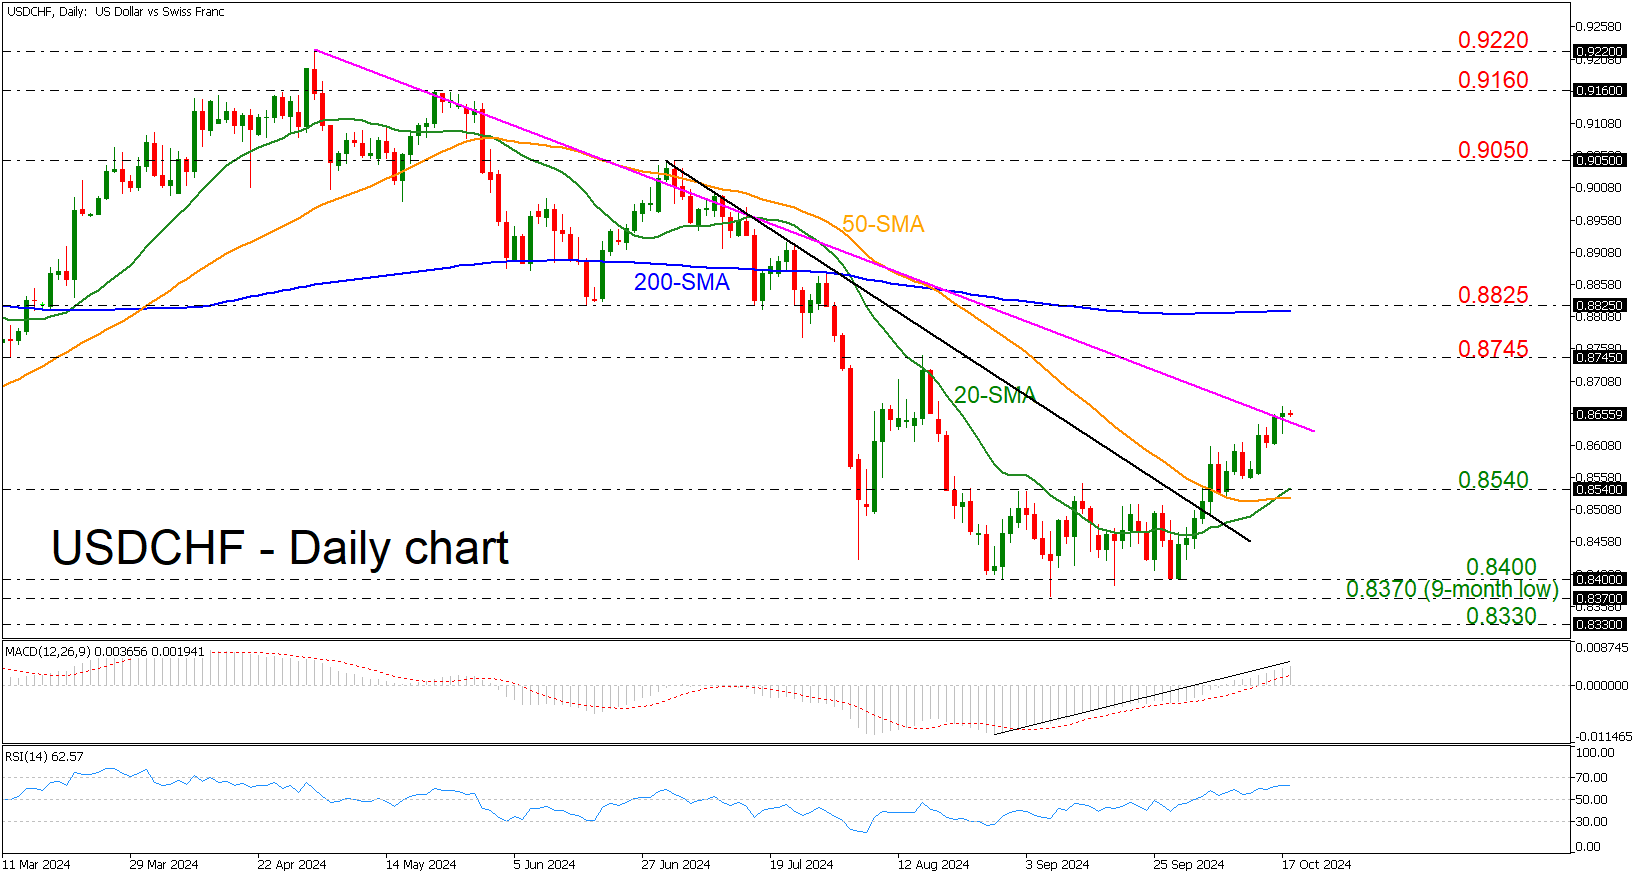
USDCHF Overcomes Medium-Term Uptrend Line
- USDCHF rebounds off 0.8400
- 20- and 50-day SMA post bullish crossover
- MACD and RSI still above their mid-levels
USDCHF has charged through its medium-term descending trend line near 0.8650 after the strong pullback from the 0.8400 round number. The momentum indicators point to a bullish bias in the near term, but there is also a risk of a negative correction. The RSI is flattening above the 50 level, while the MACD is rising above its trigger and zero lines.
If the price extends its rally, the 0.8745 resistance is the first point of call, after attention turns to the 200-day simple moving average (SMA), which lies near the 0.8825 resistance. Breaking above this area could pave the way for the 0.9050 key level.
However, should the price go into reverse, there could be some support at the 0.8540 bar, slightly above the bullish crossover within the 20- and the 50-day SMAs at 0.8530. Steeper decreases could open the door for the 0.8370-0.8400 region.
In brief, there could be some further limited gains for USDCHF in the short term before the rally pauses for breath. But the price needs to remain above the medium-term descending trend line for the pair to continue its upside structure.