
Sample Category Title
GBP/JPY Daily Outlook
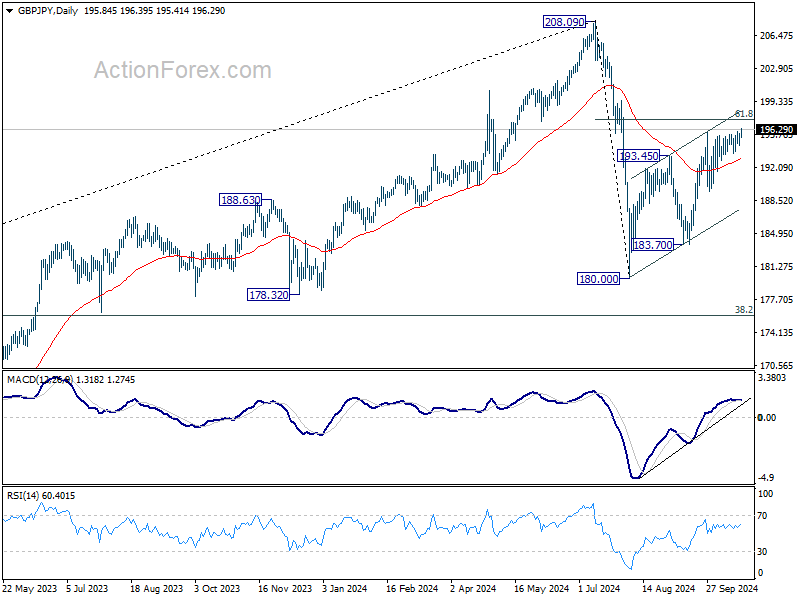
Daily Pivots: (S1) 194.99; (P) 195.44; (R1) 196.32; More...
GBP/JPY's rebound from 180.00 resumed by breaking 195.95 resistance. Intraday bias is back on the upside for 61.8% retracement of 208.09 to 180.00 at 197.35 next. Sustained break there will target 208.09 high. On the downside, below 194.55 minor support will turn intraday bias neutral again first.
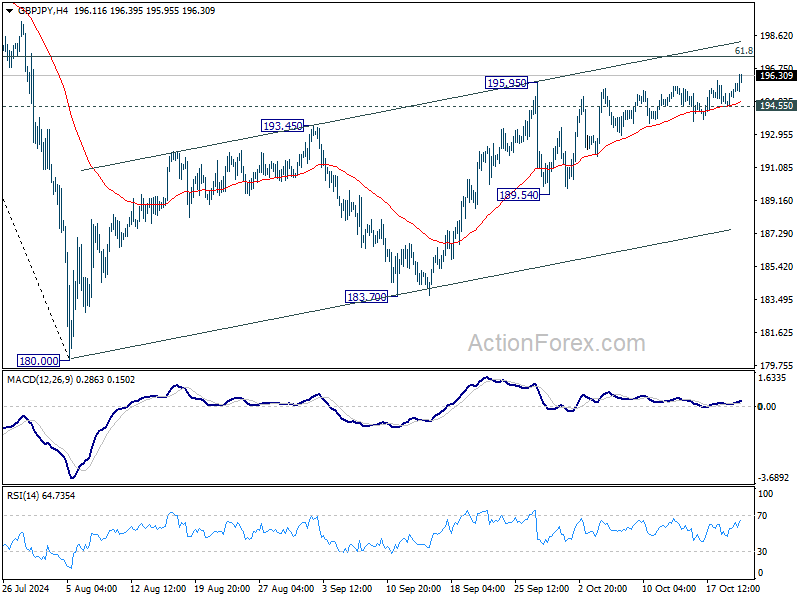
In the bigger picture, price actions from 208.09 are seen as a correction to whole rally from 123.94 (2020 low). The range of consolidation should be set between 38.2% retracement of 123.94 to 208.09 at 175.94 and 208.09. However, decisive break of 175.94 will argue that deeper correction is underway.
EUR/JPY Daily Outlook
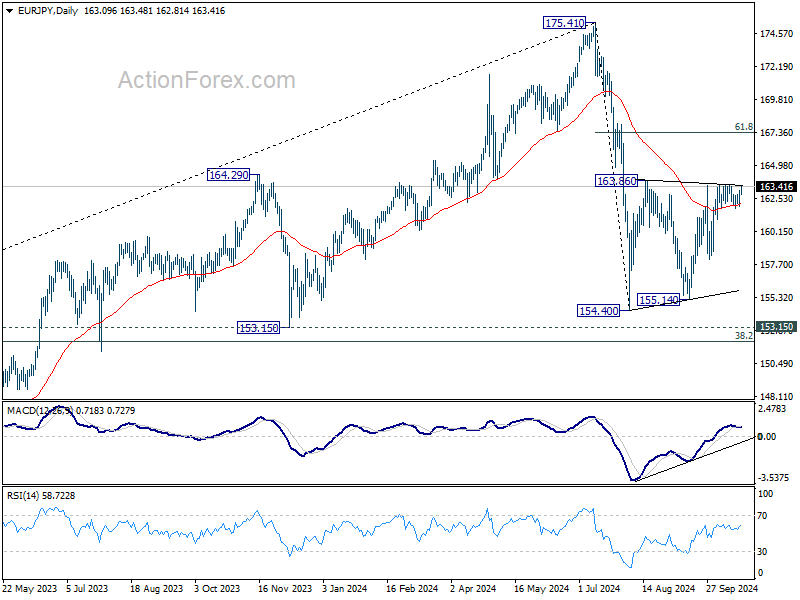
Daily Pivots: (S1) 162.37; (P) 162.77; (R1) 163.54; More....
Outlook in EUR/JPY is unchanged and intraday bias stays neutral. On the upside, firm break of 163.86 resistance will resume the rebound from 154.40 to 61.8% retracement of 175.41 to 154.40 at 167.38. On the downside, break of 161.83 minor support will turn bias back to the downside. Further break of 158.09 will target 154.40/155.14 support zone.
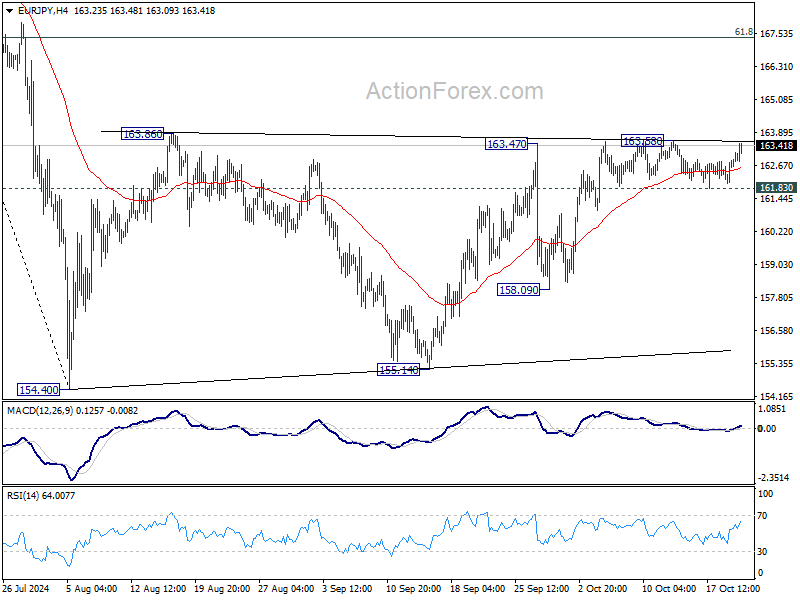
In the bigger picture, price actions from 175.41 are seen as correction to rally from 114.42 (2020 low). The range of consolidation should have been set between 38.2% retracement of 114.42 to 175.41 at 152.11 and 175.41 high. However, decisive break of 152.11 would argue that deeper correction is underway.
EUR/GBP Daily Outlook
Daily Pivots: (S1) 0.8318; (P) 0.8329; (R1) 0.8340; More...
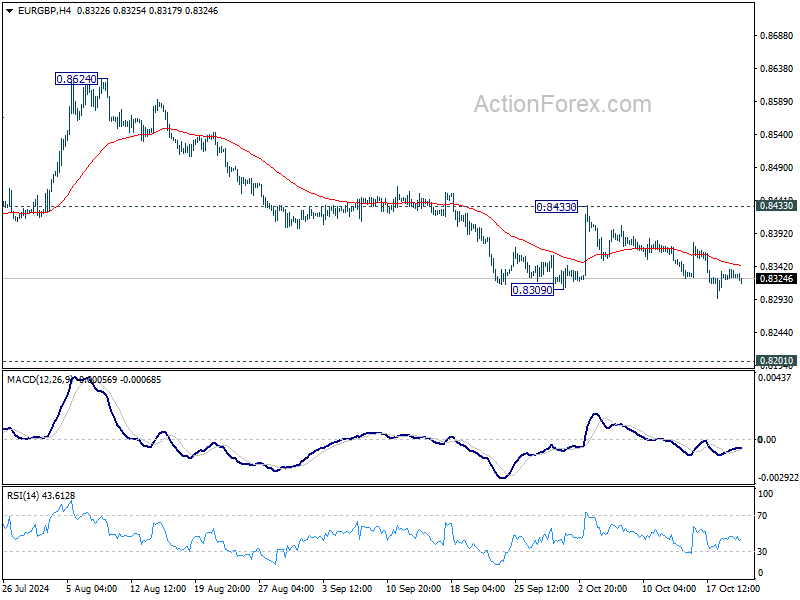
As long as 0.8433 resistance holds, EUR/GBP's down trend is still in progress for 0.8201 key support next. Strong support could be seen from there to bring rebound. But for now, break of 0.8433 resistance is needed to indicate short term bottoming. Otherwise, outlook will stay bearish in case of recovery.
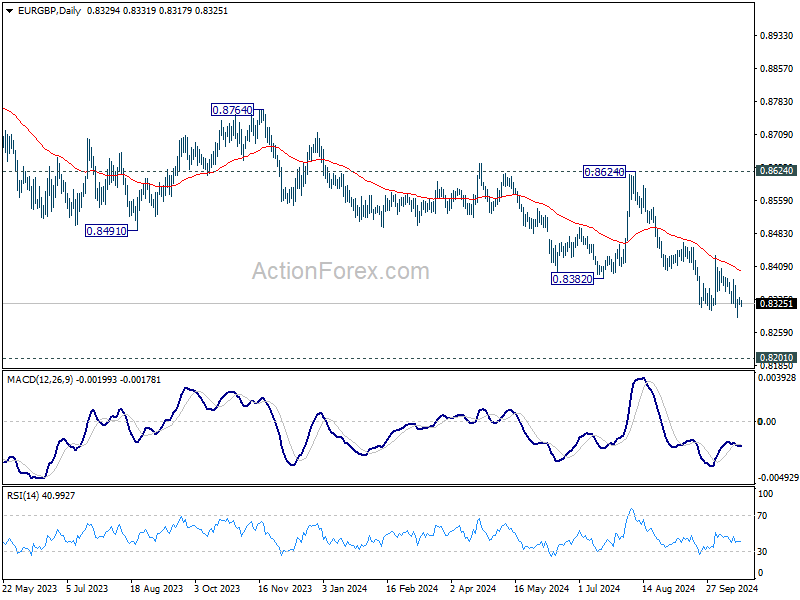
In the bigger picture, down trend from 0.9267 (2022 high) is in progress. Next target is 0.8201 (2022 low), but strong support should be seen there to bring rebound. However, outlook will remain bearish as long as 0.8624 resistance holds even in case of strong rebound. Decisive break of 0.8201 will indicate long term bearish reversal.
EUR/AUD Daily Outlook
Daily Pivots: (S1) 1.6182; (P) 1.6222; (R1) 1.6281; More...
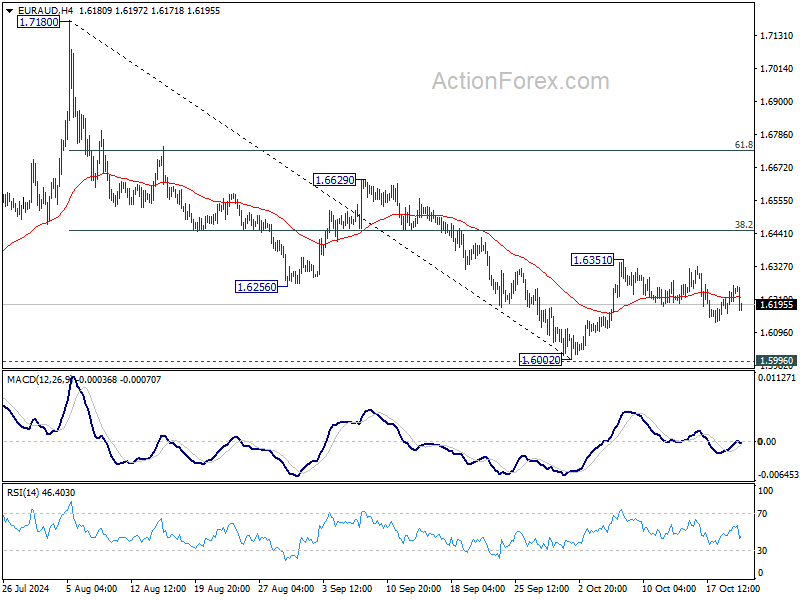
EUR/AUD's decline from 1.6351 is still in progress and further fall would be seen towards 1.6002 low. On the upside, however, break of 1.6351 will resume the rebound from 1.6002 to 38.2% of 1.7180 to 1.6002 at 1.6452.
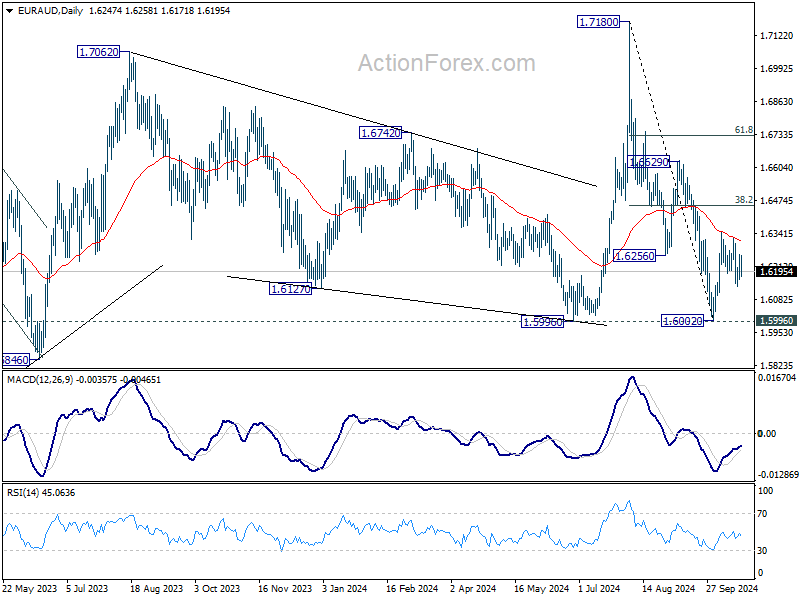
In the bigger picture, as long as 1.5996 cluster support holds (38.2% retracement of 1.4281 to 1.7062 (2023 high) at 1.6000), up trend from 1.4281 (2022 low) is still expected to resume at a later stage. However, decisive break of 1.5996 will argue that the medium term trend has reversed and turn outlook bearish.
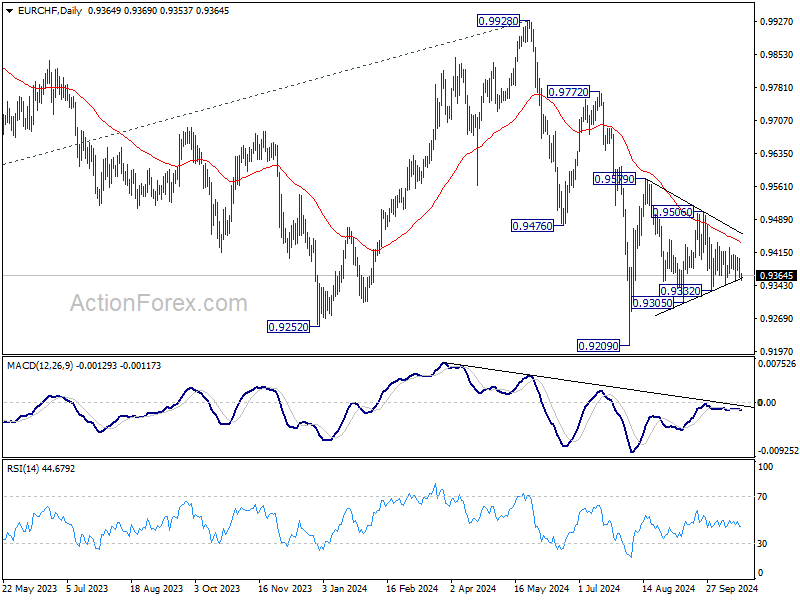
EUR/CHF Daily Outlook
Daily Pivots: (S1) 0.9351; (P) 0.9377; (R1) 0.9392; More....
EUR/CHF is staying in converging range and intraday bias stays neutral for the moment. On the downside, break of 0.9332 will resume the fall from 0.9579 towards 0.9209 low. On the upside, break of 0.9506 will turn intraday bias to the upside for 0.9579 resistance and above.
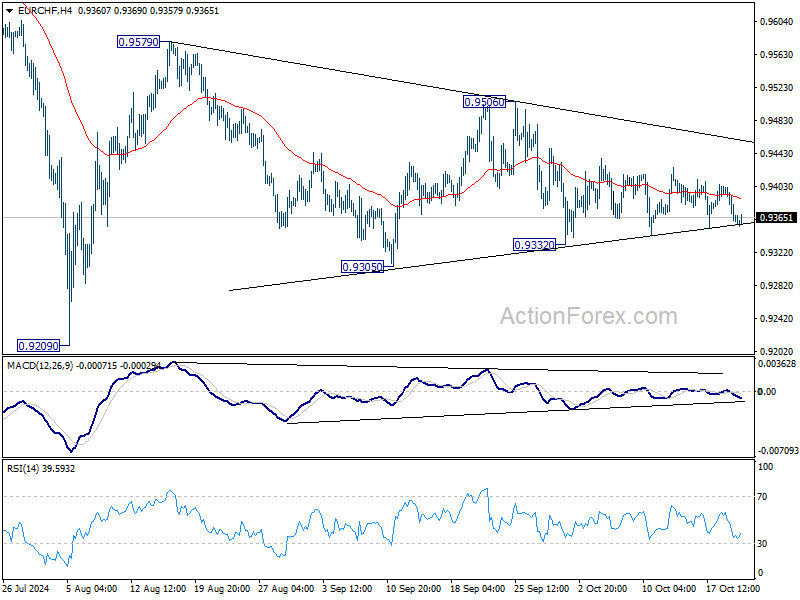
In the bigger picture, fall from 0.9928 is seen as part of the long term down trend. Repeated rejection by 55 D EMA (now at 0.9439) keeps outlook bearish for breaking through 0.9209 low at a later stage. Nevertheless, sustained trading above 55 D EMA will confirm medium term bottoming and bring stronger rebound back towards 0.9928 key resistance.
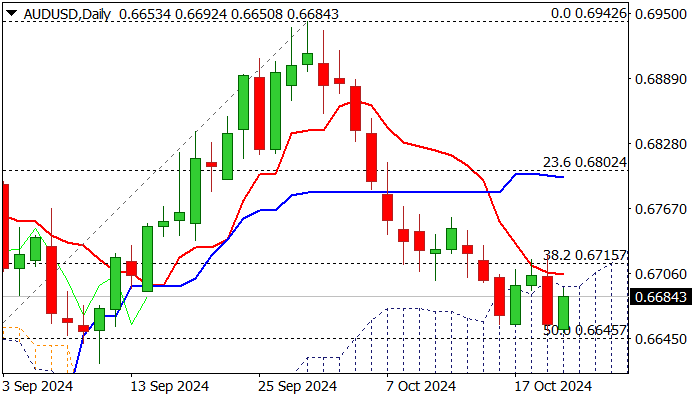
AUD/USD Outlook: Bounce from New Multi-Week Low Needs to Clear Key Barriers to Sideline Larger Bears
AUDUSD bounces from new six-week low in early Tuesday trading after bears repeatedly faced strong headwinds from solid supports at 0.6645/27 (50% retracement of 0.6348/0.6942 / 200DMA).
Fresh recovery attempts pressure strong barriers at 0.6695 (100DMA / daily cloud top) with firm break here needed to ease downside pressure and open way for extension through recent congestion top (0.6723) break of which to generate initial reversal signal on formation of a double-bottom pattern (0.6658/50).
Technical picture is negative on daily chart and bears will keep control as long as the price holds within current consolidation range, with near term risk to remain shifted to the downside for renewed attack at 0.6645/27 pivots, violation of which to expose daily cloud base / Fibo 61.8% (0.6586/75).
Res: 0.6695; 0.6705; 0.6723; 0.6759.
Sup: 0.6645; 0.6627; 0.6586; 0.6575.
In Run-Up to US Elections, By Default USD Strength Could Continue
Markets
US yields closed this week’s opening session 8.3 bps (2-yr) to 11.3 bps (10-yr) higher. For the US 2-yr yield, it was the highest close since mid-August and above the strong 4%-resistance area. The US 10-yr yield finished above 4.2%, completely erasing the August market-meltdown setback to 3.6% mid-September. Don’t go searching for any eco data to explain yesterday’s dynamics. Once September US eco data (payrolls, CPI inflation, retail sales) ruled out the need for the Fed to stick to its bold opening move, focus gradually turned from the November 7 Fed meeting to that other key event the same week, November 5 US presidential elections. Both candidates continue to be neck and neck in the polls. As we near ballot date, markets especially prepare for the potentially most eruptive outcome which would be a Trump win. Recall that a Trump presidency would add $7.5tn to an already yawning $22tn cumulative deficits over the next decade (Harris: +$3.5tn). These bloated public finances in an interest rate environment which can no longer be labelled by acronyms like ZIRP of NIRP cry for a return of credit risk premia. We see the same thing happening in Europe, with underperformance of bonds from countries like France and Belgium compared to countries who have finances better in check (eg Portugal, but also Italy for the moment). In theory, such worries should trigger more bear steepening of yield curves. The relatively strong increase at the front end of the US curve might be linked to comments from Minneapolis Fed Kashkari who wondered whether the neutral rate is higher still (economic resilience) than policy makers currently take into account (already a reset compared to pre-pandemic levels) and who stressed that rates will be higher if deficits go to the moon. The latest upleg in US yields has been primarily driven higher real rates instead of inflation expectations. German yields shadowed the US move yesterday, with yields ending the session 7.2 bps (2-yr) to 9.9 bps (10-yr) higher. On FX markets, the dollar closed at its best level against the euro since the weak July payrolls report (Aug 2). EUR/USD changes hands at 1.0820, preparing for a test of 1.0778 support. In the run-up to US elections, by default USD-strength could continue not only because of yield and economic divergence, but also because of a negative Trump-premium for the USD’s counterparts fearing a very hawkish trade policy. We expect current market to continue today given the thin eco calendar (only Richmond Fed business survey). Speeches by BoE Bailey and ECB Lagarde are wildcards for trading.
News & Views
Brazil’s central bank chief Campos Neto sees “this huge de-anchoring” of inflation expectations from the 3% target as he explained last month’s decision to return to rate hikes to 10.75% after the 4-month pause that followed a cutting cycle (from 13.75% to 10.50%). The inflation convergence towards target has stalled, he said. Services inflation is a particular worry and a tight labour market indicates that it needs to be monitored closely. It’s “a puzzle” to the central bank governor why the labour market continues to be this strong. He said the fiscal narrative is only part of the answer. With economic growth having consistently surprised to the upside, Campos Neto thinks there is a structural element as well following the range of reforms implemented over the past 5 to 10 years. The central bank’s next meeting is November 6, in between the US elections and the Fed meeting but that doesn’t necessarily means they won’t act, especially with the Brazilian real hovering close to record lows (USD/BRL 5.7).
Bank of England rate setter Megan Greene in an Op-ed for the Financial Times said she favoured a gradual approach to monetary easing. Her comments contrast with those of governor Bailey who called for a more activist stance. Greene said rate hikes have spurred consumers to save more. This higher-than-historical savings rate of >10% easily tops that in the US (5%) and was also driven out of precaution in the wake of successive (pandemic and energy) shocks. Real consumption as a result is a mere 1.5% above pre-Covid levels compared to 13% in the US even as British real incomes have been rising for more than a year now. For Greene there’s a risk that lowering the policy rate may trigger the exact opposite move, releasing pent-up demand that’s currently stored in savings. One opposing risk factor is the full impact of higher mortgage rates that has yet to pass through. But given the uncertainty, Greene said the central bank should move cautiously.
Aussie Unsettled as US Election Risks Rise
AUD/USD starts the week fragile, trading at 5½ week lows in the mid-0.66s. The local and international data slate is thin this week, but consequential events loom in late October and early November - Q3 CPI (30 Oct), US Oct payrolls (1 Nov) and the US election and the RBA (both 5 Nov).
A stellar Sept. Aussie jobs report last week briefly helped AUD regain some composure. Employment grew by a strong 64.1k, an impressive gain after 5 consecutive stronger than expected monthly prints totalling more than 200k. Unemployment was unchanged in the month, from a downwardly revised at 4.1% last month.
Local interest rate markets dialled back RBA rate cut expectations on the strong jobs data, trimming pricing for their February 2025 meeting to -20bp, from -25bp. For all of 2025, rates markets now expect 3 x 25bp rate cuts, having priced in some risk that the RBA could deliver 4 x 25bp cuts before the jobs data.
AUD/USD encouragingly reclaimed the 0.6700 handle into the back-end of last week. But bigger crosswinds are taking over in the new week, sending AUD back to lows in the mid-0.66s. More encouragingly, AUD/JPY is holding above 100.0 and AUD/NZD is still sitting above 1.1000.
The Harris-Trump US presidential election race has become a crucial consideration, and with swing-state polls trending towards Trump, markets are pricing in a greater risk of more fiscal stimulus and trade tariffs.
Long term US yields have already backed up considerably in recent weeks, around 50bp, as US jobs and inflation data came in stronger, undercutting Fed rate cut prospects. But yields have risen further to start the week, touching 3-month highs at 4.19%. Matching that, the tone from Fed officials has shifted in recent weeks. The strong message is that the 50bp Sept. rate cut was a one-off to recalibrate and reposition policy amid shifting risks. Going forward a more measured and slower pace of Fed rate cuts is favoured.
Fedspeakers early this week have continued to reinforce that message. At the same time, “Red sweep” US election bets are taking over.
High quality polls point to an evenly divided Harris-Trump race, within the margin of error. But there has been a clear trend favouring Trump in swing state polls lately. Just as critically, Republicans are consolidating their advantage to win majorities in both houses of Congress, altogether boosting expectations for a “Red sweep”.
The widespread belief is that divided governments produce more moderate spending and tax outcomes, and as such it is favoured by markets. But a “Red sweep” would tip the risks towards larger parts of Trump’s agenda getting through congress, including an extension of his 2017 tax cuts (due to expire in late 2025) and another reduction in the corporate tax rate. The independent Committee for a Responsible Budget estimates that Trump’s policy proposals will add USD7.5trn to US deficits over a 10 year window.
Trump is also proposing a blanket 10% tariff on all US imports and a 60% tariff on China imports, effectively tripling and broadening the China levies applied in his 1st term. The combined impact of tax cuts and tariffs point to a disruptive picture for global trade and adds to US inflation risks.
Policy news out of Beijing remains broadly reassuring and analysts are bumping up their China growth forecast for 2024 and 2025.
Plans are afoot for a large debt swap plan to alleviate the dire state of local government finances. Additional capacity to clear unsold housing inventory is also in the works, by allowing local governments to issue bonds to purchase unsold homes. China’s Housing Ministry last week announced plans to expand their white-list property funding support program – to CNY4trn (around USD550bn). This plan speeds up the delivery of unfinished presold homes, via special loans to banks that are then channelled to property developers.
But there are still a lot of hurdles. Even with cheap funding, banks are cautious about taking on property credit risk, given the sheer scale of excess inventory across lower tier China cities. Iron ore prices seem to suggesting much the same. Iron ore prices are at around $100t, well down from their highs closer to $115/t hit earlier in the month.
Preliminary October PMIs are the only release on Australia’s local calendar this week. PMIs are a key monthly data point for US and Eurozone markets, but in Australia the series is yet to develop any real credibility with markets.
The global calendars are pretty quiet too. The IMF’s Autumn annual meeting in Washington will produce a few headlines, including comments from BoE Governor bailey, ECB president Lagarde and RBNZ Governor Orr.
The Fed’s Beige Book, an anecdotal summary of economic conditions across the US, is also out. While this report mostly falls under the radar for markets it is thought to be one of Chair Powell’s favourite barometers. The hard US data in recent weeks points to another robust growth performance in Q3, above 3% annualised. Soft surveys and anecdotes, including the Beige Book portray softer conditions.
Japan's holds a snap general election this weekend. Polls show that the LDP, led by newly installed Prime Minister Ishiba, and their coalition partner, will probably win, but with a much reduced majority. Ishiba is promising a decent spending package if he wins, to cushion cost of living pressures. That will figure into the BoJ's thinking on the outlook and could lead to some volatility in the yen crosses early next week.
Altogether there isn’t a lot for AUD in this week’s calendars. Late October and early November looks a lot more consequential - Q3 CPI (30 Oct), US Oct payrolls (1 Nov) and the US election and the RBA (both 5 Nov).
Tuesday
-2024 Annual IMF/World Bank meetings, Washington
Wednesday
-Eurozone ECB President Lagarde speaks
-UK BoE Governor Bailey speaks
Thursday
-NZ RBNZ Governor gives speech
-Australia, Japan, Eurozone, UK, US, Oct prelim manufacturing and services PMI.
-Eurozone ECB President Lagarde speaks
-UK BoE Governor Bailey speaks
-US Fed Beige Book
-Canada BoC monetary policy decision
Friday
-
Weekend
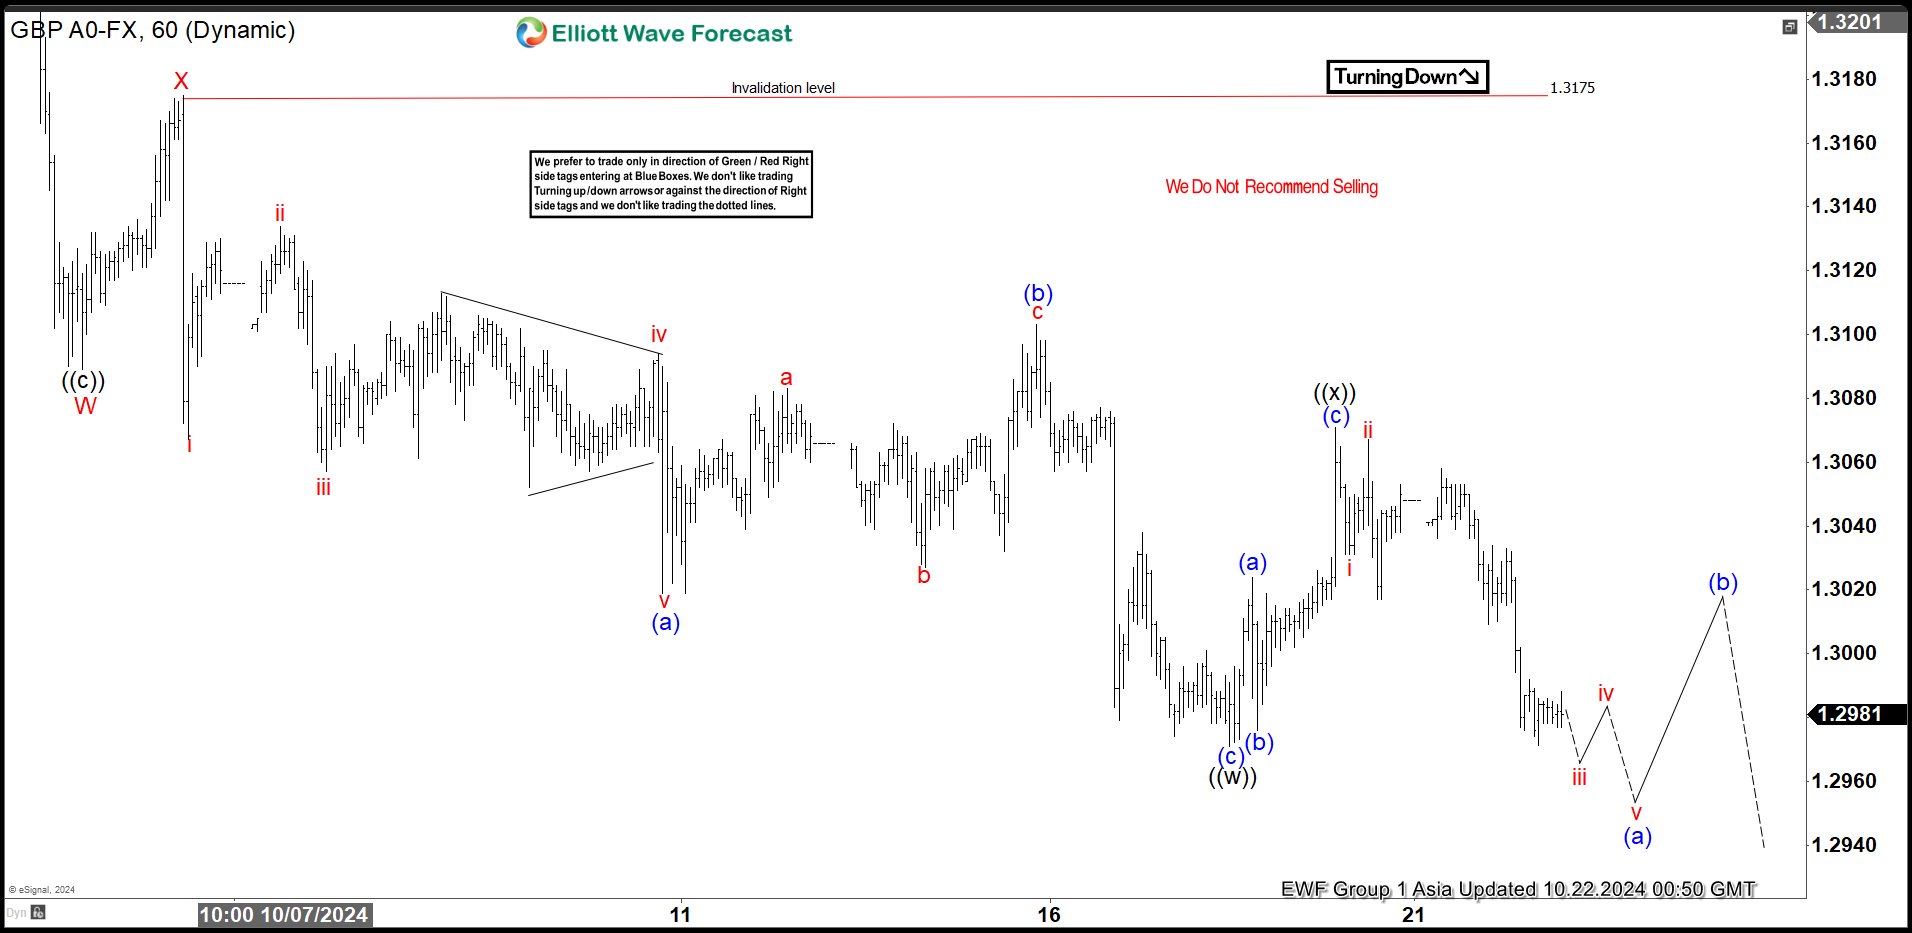
GBPUSD Elliott Wave Double Three Correction in Progress
After forming the low on September 26, 2022 low, GBPUSD shows an incomplete higher high bullish sequence. This suggests the right side is higher and dips therefore should see support in 3, 7, or 11 swing. The pair is currently correcting cycle from 10.4.2023 low. Internal subdivision of the correction is unfolding as a double three Elliott Wave structure. Down from September 26, 2024 peak, wave W ended at 1.3089 and wave X ended at 1.3175 as 1 hour chart below shows.
Pair has resumed lower in wave Y with internal subdivision as a double three in lesser degree. Down from wave X, wave (a) ended at 1.3019. Wave (b) rally ended at 1.31 and wave (c) lower ended at 1.297. This completed wave ((w)) in higher degree. Bounce in wave ((x)) ended at 1.307 with internal subdivision as zigzag. Up from wave ((w)), wave (a) ended at 1.302 and wave (b) ended at 1.297. Wave (c) higher ended at 1.307 which completed wave ((x)). Pair has resumed lower in wave ((y)). Near term, as far as pivot at 1.3175 stays intact, pair has scope to see further downside. Potential support below is at 100% – 161.8% Fibonacci extension of wave W. This area comes at 1.262 – 1.283.
GBPUSD 60 Minutes Elliott Wave Chart
GBPUSD Elliott Wave Video
https://www.youtube.com/watch?v=pQMcye1ERRQ
Bonds and Equities Trade Heavy in Slow Start to the Week
In focus today
Today the Hungarian Central Bank will announce its rate decision, with the market expecting the policy rate to be kept at 6.5%.
Otherwise, market focus will remain on the earnings season and central bank communication following a poor start to the week for most asset classes.
Economic and market news
What happened yesterday
In the US, Treasury yield on the benchmark 10-year bond rose as high as 4.17%. Wall Street lost ground after strong gains last week as indices were down, see the equities section below. Investors are awaiting earnings for 114 S&P 500 companies throughout the week, including Tesla TSLA.O, Coca-Cola KO.N and Texas Instruments TXN.O.
Generally, the hawkish side of the Fed was on the wire yesterday, advocating for a data-driven and gradual cutting cycle approach. For instance, Daly (voting member) was concerned about tight policy impacting labour markets, supporting rate cuts if inflation continues lower. Non-voting member Schmid highlighted that the Fed should focus on minimizing financial market volatility when cutting rates, while Kashkari mentioned that rates could be cut faster if labour market weakens significantly.
In the EU, the European Central Bank Policy maker Gediminas Simkus (hawk and voting member) said the ECB is likely to cut key interest rates down to its 'natural' level between 2% and 3%, however further cuts may be necessary if the fall in inflation becomes entrenched.
In the UK, Bank of England interest rate-setter Megan Greene (hawk) said the central bank should stick to gradual rate cuts given the uncertainty of consumption. This comes as British inflation fell below 2% and Bank of England Governor Andrew Bailey (dove) saying that the central bank could move aggressively if inflation pressures continued to weaken. Investors are expecting a 25 basis-point reduction in the bank rate at both Bank of England's November meeting and December meeting, whereas our base case is for Bank of England to cut in November but stay put in December.
In Oil markets, prices gained following last week's more than 7% decline. This comes as tensions rise in the Middle East following Israeli forces besieging hospitals and shelters in the northern Gaza Strip. Meanwhile investors continue to evaluate the size of the expected Israeli retaliatory attack on Iran as a response to the ballistic missile attack on 1 October.
Equities: Global equities closed lower yesterday, with broad-based declines across regions. The US stood out on the strong side, showing strength particularly in the technology sector, which contributed to another day of cyclical outperformance. There was scant macroeconomic data, but the data available, such as the falling German producer prices - which continue to surprise on the downside - suggests that lower yields could be anticipated. Therefore, it is difficult to attribute the rise in yields yesterday to inflation, especially noting that the long end of the curve saw the most significant increase. Clearly, several factors are at play here, as evidenced by the unusual sector rotation observed yesterday. In the US yesterday: Dow -0.8%, S&P 500 -0.2%, Nasdaq +0.3%, and Russell 2000 -1.6%. Most Asian markets are lower this morning, with China bucking the trend. Futures in Europe are presenting a mixed picture, while in the US, futures are lower this morning.
FI: There was a substantial rise in global bond yields yesterday on the back of rising oil prices and concerns about fiscal policies. Hence, 10Y US Treasury yields rose some 10bp, while 2Y US Treasury yields rose 7bp. There was a similar move in Europe, where the move was led by Italy as 10Y Italian yields rose some 15bp, while Bunds rose 10bp.
FX: The USD dominated majors and saw broad gains yesterday with EUR/USD falling close to 1.08 and USD/JPY rising firmly above 150. For Scandies, it was a relatively quiet day. Both EUR/SEK and EUR/NOK traded in tight ranges.