
Sample Category Title
GBP/USD Mid-Day Outlook
Daily Pivots: (S1) 1.2955; (P) 1.3007; (R1) 1.3036; More...
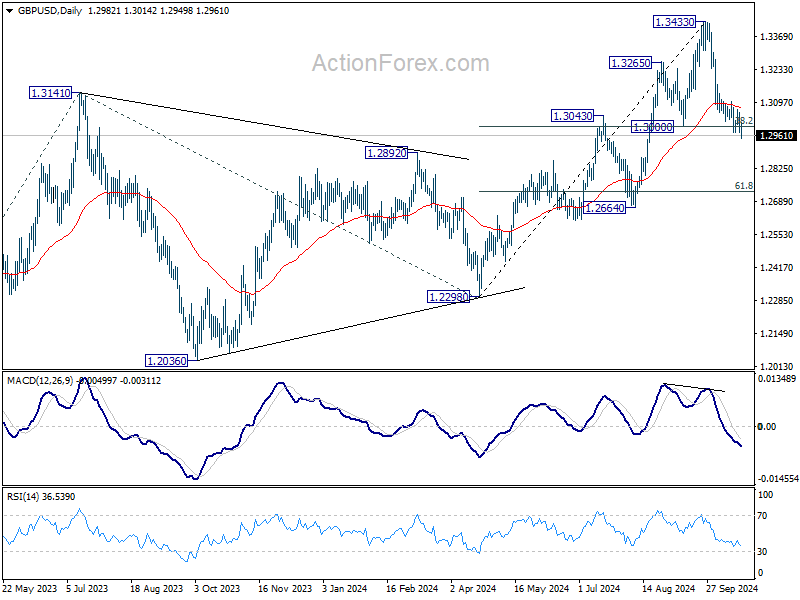
GBP/USD's fall 1.3433 resumed by breaking 1.2973 temporary low and intraday bias is back on the downside. Sustained trading below 1.3000 cluster support (38.2% retracement of 1.2298 to 1.3433 at 1.2999) will argue that whole rise from 1.2298 has completed and bring deeper fall to 61.8% retracement at 1.2732. On the upside, break of 1.3070 minor resistance will turn bias back to the upside for stronger rebound.
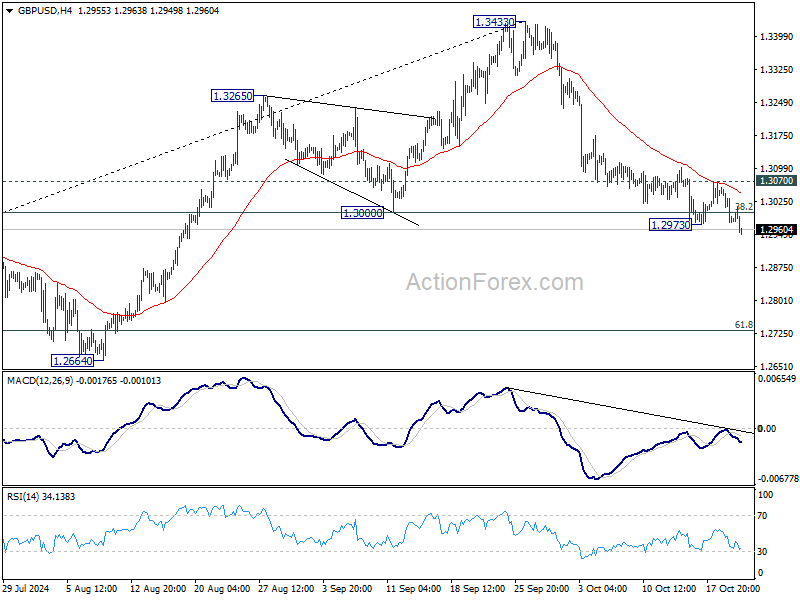
In the bigger picture, considering mildly bearish divergence condition in D MACD, decisive break of 1.3000 support will suggest that a medium term top is already formed at 1.3433. Price actions from there would be tentatively seen as correcting the up trend from 1.0351 (2022 low). In this case, deeper fall would be seen to 1.2298 structural support, strong support should be seen there to bring rebound.
Canadian Dollar Flat, BoC Poised to Cut Rates
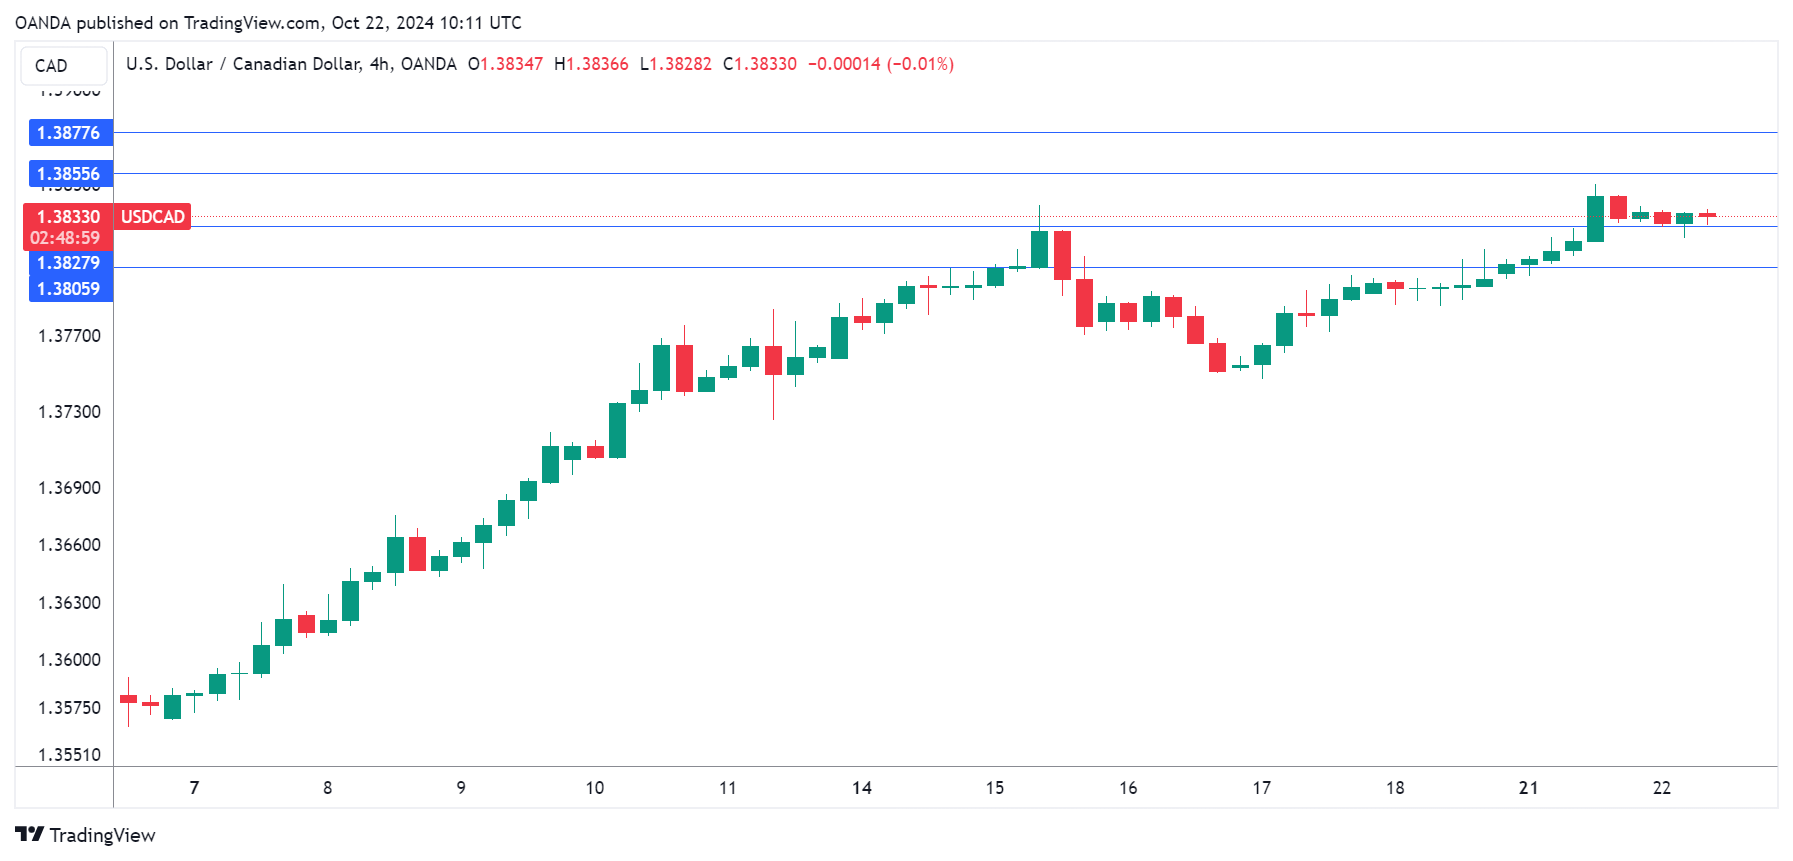
The Canadian dollar is unchanged on Tuesday. In the European session, USD/CAD is trading at 1.3831 at the time of writing. The Canadian dollar is under pressure and is having a miserable October, down 2.2%.
BoC expected to chop rates by 50 bps
The Bank of Canada makes its next interest rate decision on Wednesday and the central bank is widely expected to cut rates for a fourth time this year. Will the BoC deliver a modest 25-basis point cut as in previous meetings, or opt for an aggressive 50-bp cut?
The markets anticipate an oversized 50bp cut, as economic growth has been weak, wage growth remains high and inflation is heading lower. Inflation dropped to 1.6% y/y in September, below expectations and moving back below the BoC’s target of 2% for the first time in three years.
With inflation largely contained, the BoC is keeping a close eye on the employment front, but that has made the rate path more complicated. The September employment report showed a strong increase in job growth and a drop in unemployment. The strong job numbers indicate that the labor market remains in decent shape and supports a smaller 25-bps cut.
BoC policymakers will have to decide on the size of the cut and may face the same dilemma at the following meeting in December. The current cash rate of 4.25% is too high and although the BoC has trimmed the rate by 75 bp this year, more needs to be done to boost the economy. The key question is how aggressive will the BoC be in its rate-cutting cycle, which will continue well into 2025.
USD/CAD Technical
- USD/CAD tested support at 1.3827 earlier. Below, there is support at 1.3805
- 1.3855 and 1.3877 are the next resistance lines
EURJPY Slightly Bullish Ahead of Key Obstacles
- EURJPY still consolidating but immediate bias is bullish
- Major resistance area lies ahead
EURJPY has been trading within a narrow sideways range since early October, but the immediate bias has turned positive over the last couple of sessions. The stochastic oscillator is trending upwards, while the RSI is slightly above its 50 neutral level.
The price reached a two-month intra-day peak of 163.65 earlier on Tuesday before pulling back, reflecting a very weak upside momentum. But even if the bulls manage to stay in control and plough ahead, getting past the 164.45-165.00 region will be very difficult.
The 200-day simple moving average (SMA) is blocking the way at 164.46, while the 50% Fibonacci retracement of the July-August downleg stands at 164.90. Furthermore, the top of the Ichimoku cloud overlaps with the 50% Fibonacci, underscoring the significance of this resistance region.
Nonetheless, a successful breakout above 165.00 would shift the medium-term picture from neutral to bullish and clear the way towards the 61.8% Fibonacci of 167.38.
If, though, the bulls fail to make much progress and the positive momentum fades, there’s likely to be strong support around the 20-day SMA just above the 162.00 mark. Slipping below this level would bring the 50-day SMA under the spotlight at 160.81 before sellers turn their attention to the 23.6% Fibonacci of 159.34.
A drop beneath the 23.6% Fibonacci would also take the price below the Ichimoku cloud, risking a return to the bearish phase.
In brief, EURJPY still has a chance of resuming its rebound from the September low, but reclaiming the crucial 165.00 handle will not be easy.

Cable – Bears Look for Push Though Daily Cloud Base After Consolidation
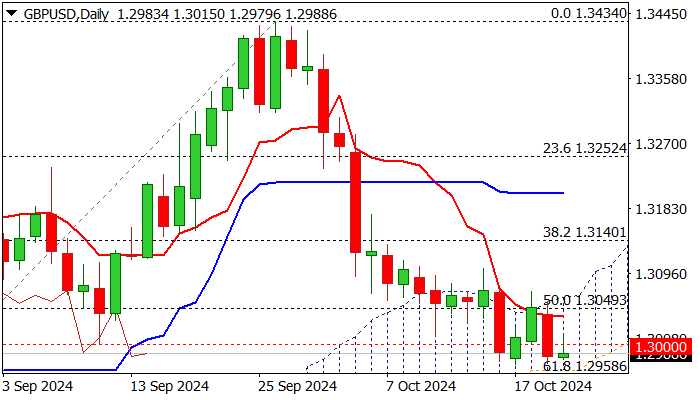
Cable is holding in extended consolidation around cracked psychological 1.30 support as larger bears are taking a breather for consolidation above key supports.
Near-term price action holds within daily Ichimoku cloud (spanned between 1.3063 and 1.2965) with consolidation range being capped by cloud top and falling 10DMA, which adds to bearish bias.
Negative momentum remains strong on daily chart and Tenkan/Kijun-sen diverged after creating bear-cross, maintaining downside pressure.
Bears eye key supports at 1.2960 zone (daily cloud base / Fibo 61.8% of 1.2864/1.3434 / 100DMA), firm break of which to generate strong bearish signal for continuation of larger downtrend from 1.3434 (2024 high of Sep 26) towards next targets at 1.2846 (Fibo 76.4%) and 1.2798 (200DMA).
Only sustained break above daily cloud would defer and open way stronger bounce.
Res: 1.3000; 1.3034; 1.3063; 1.3102
Sup: 1.2965; 1.2958; 1.2900; 1.2846
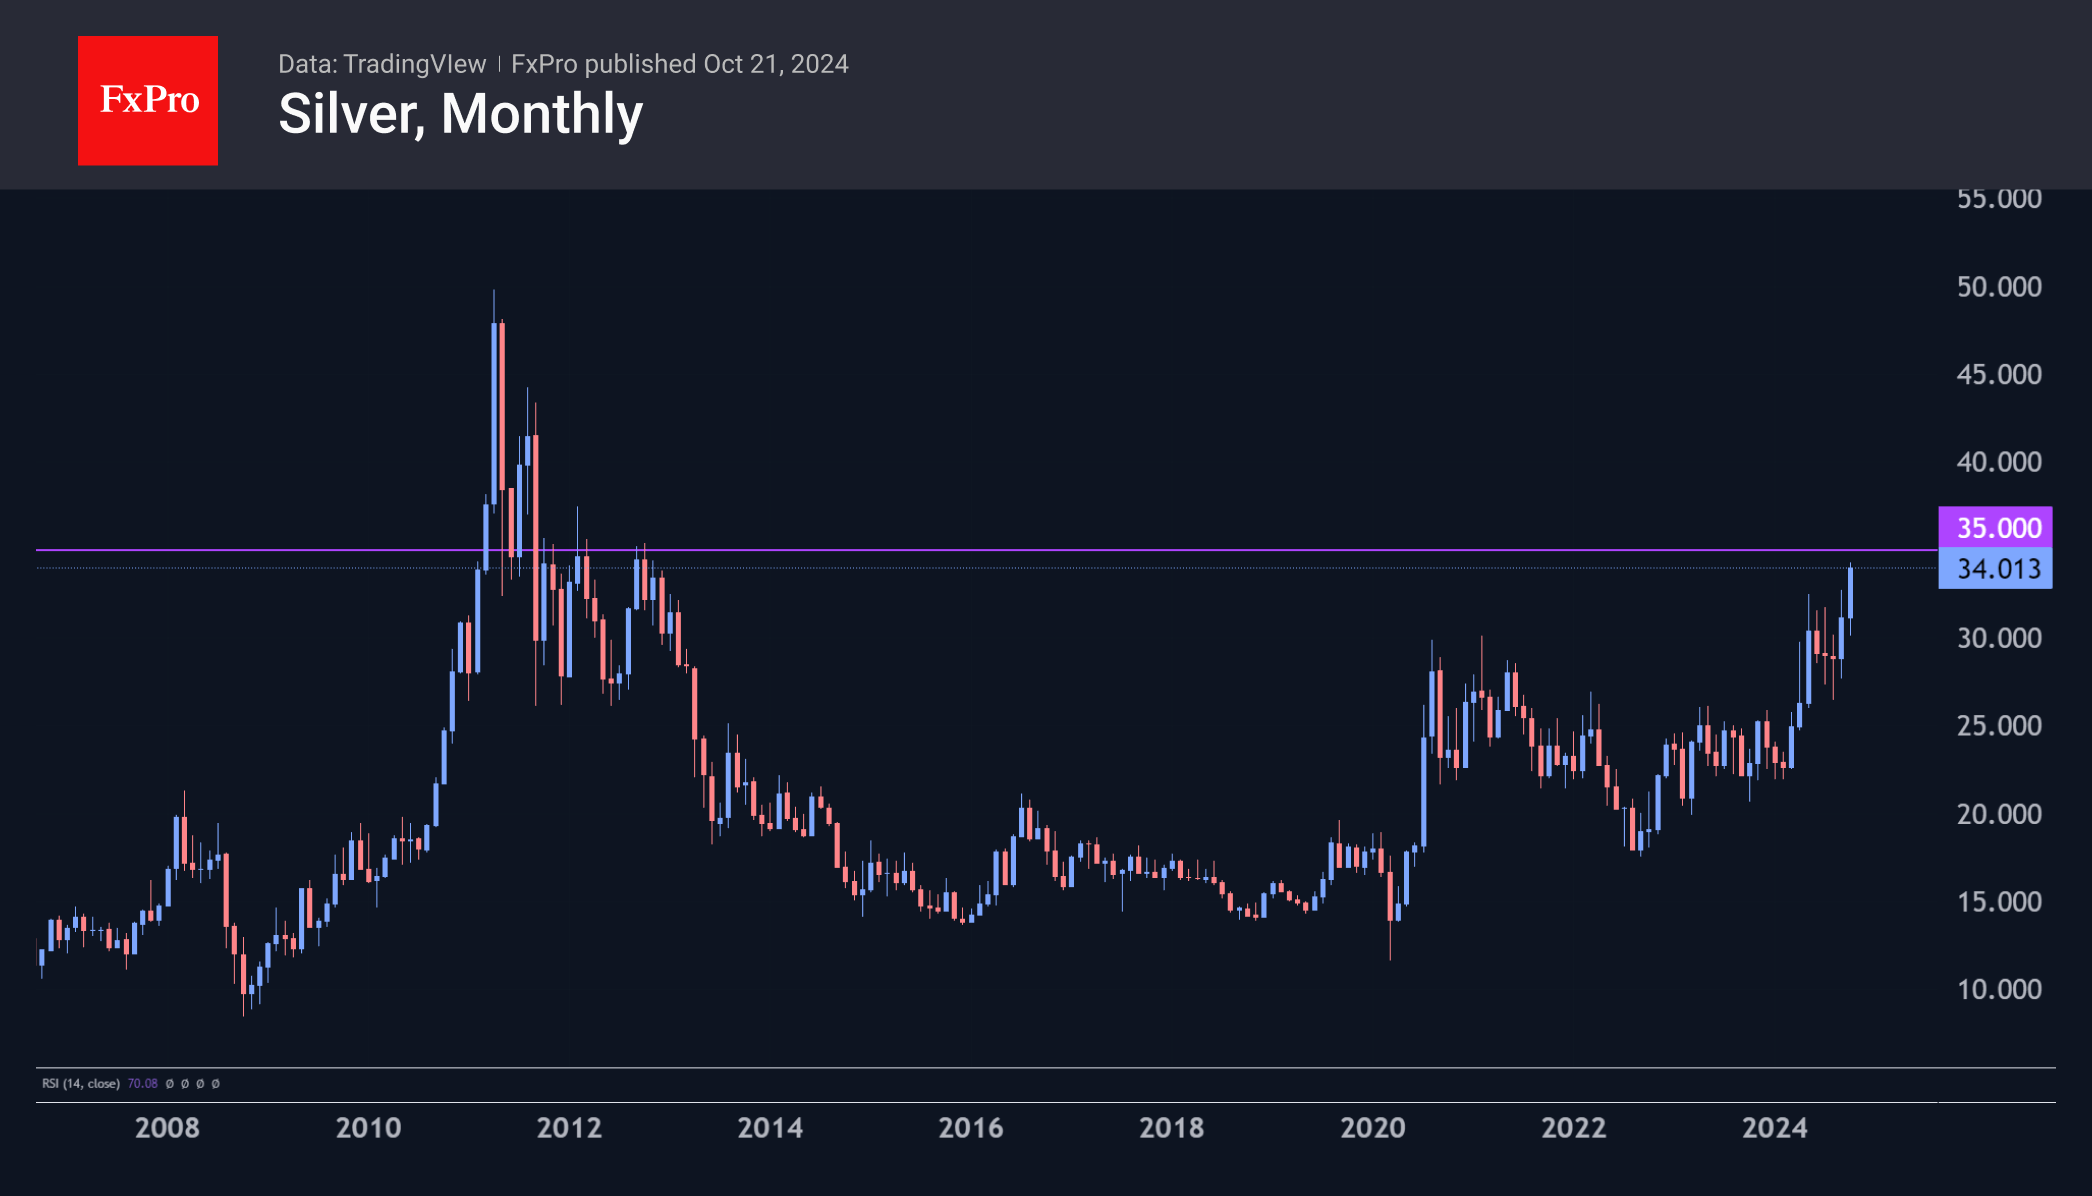
Silver: Shakeout, but Not the End of the Mega-Rally Ahead
Silver revived last week and made a decisive move on Friday to renew multi-year highs. At the start of the new week, the price was above $34 per troy ounce, a level last seen in November 2012.
Since May this year, prices have pulled back several times, but silver broke through resistance at $32 and rose more than 7% on Friday, adding to Monday’s 1.3% gain.
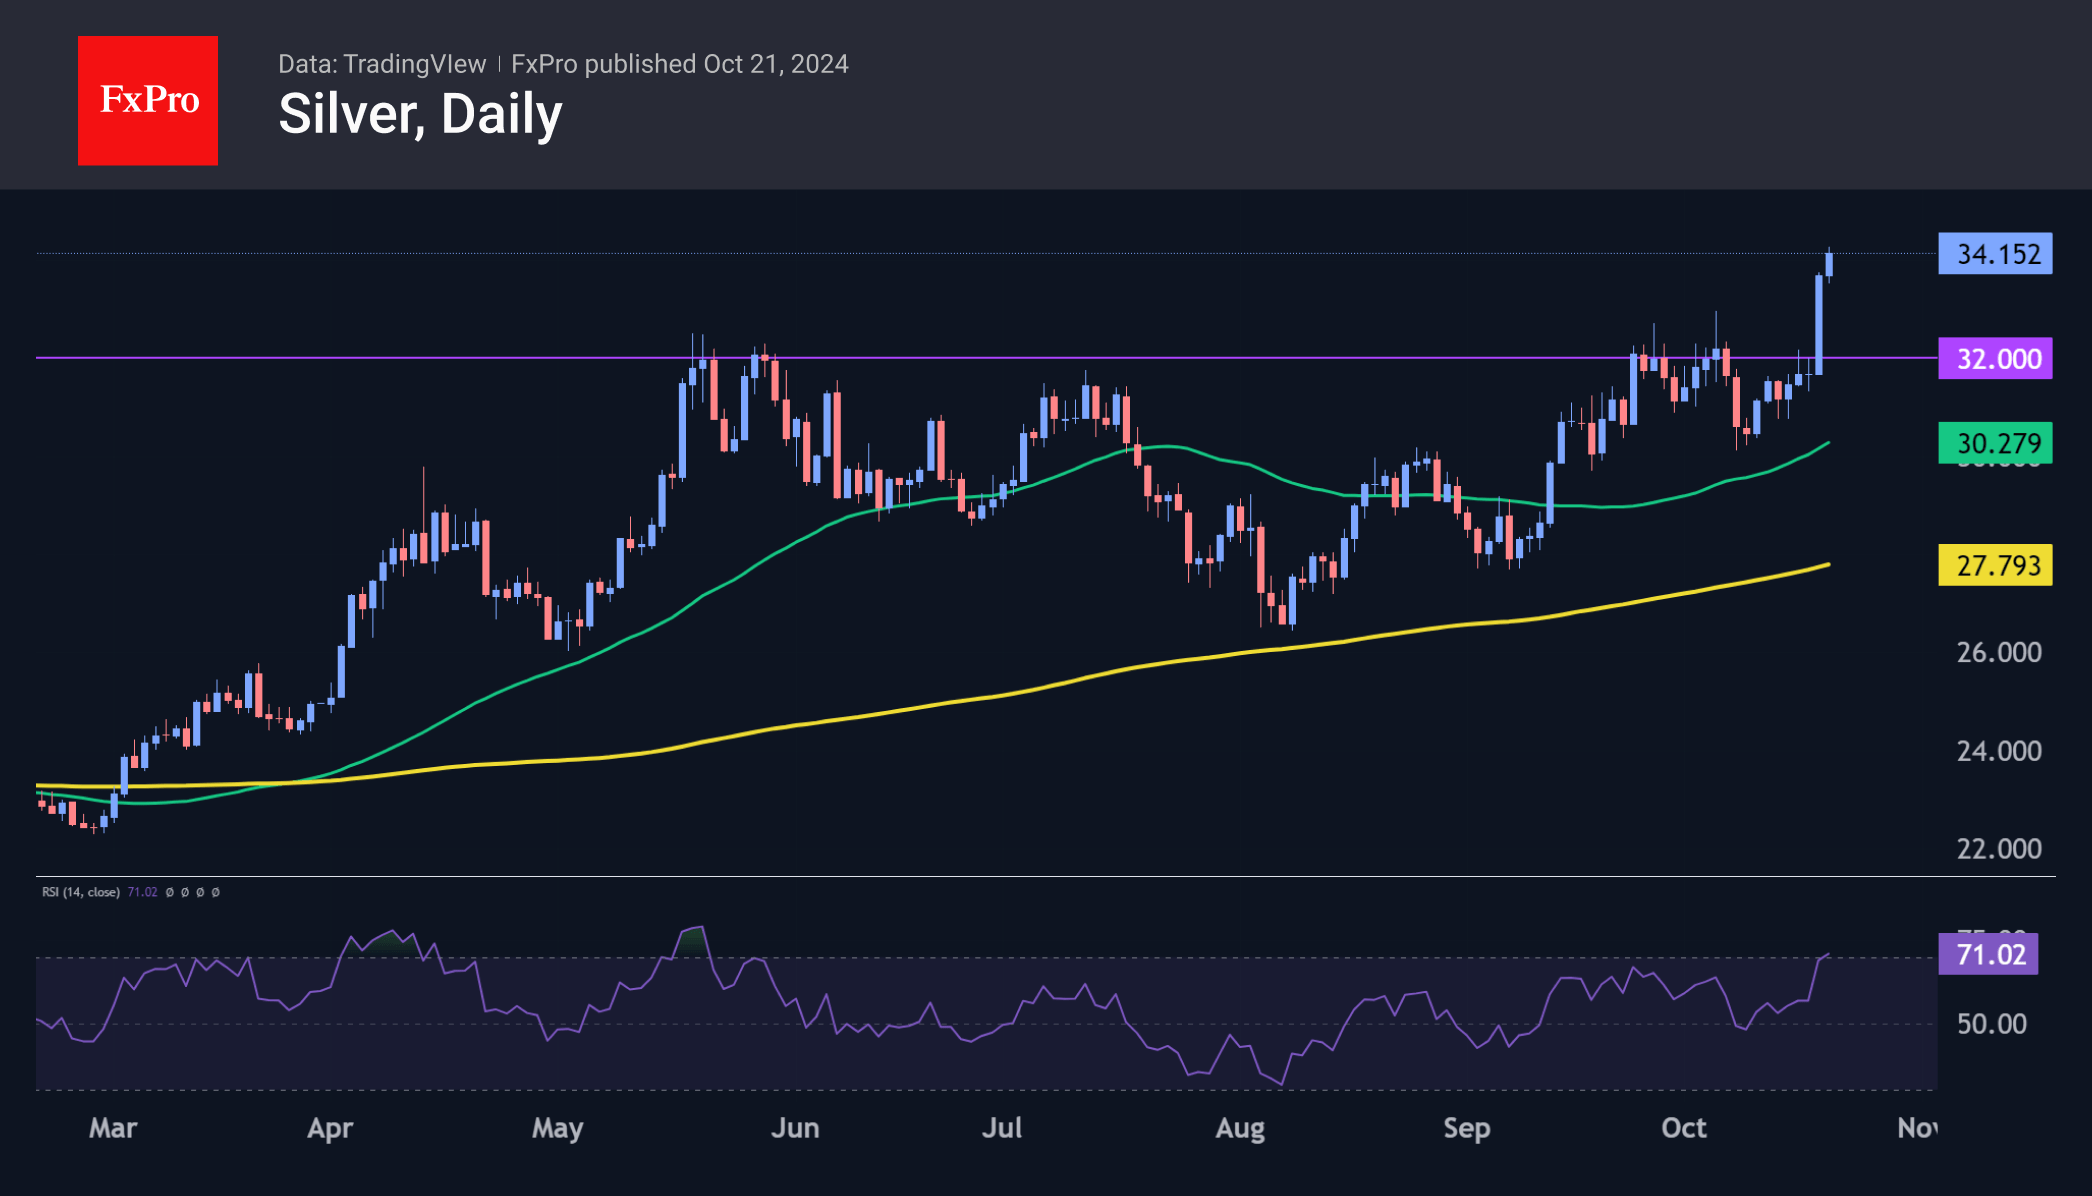
The Relative Strength Index (RSI) has surged above 70 on the daily chart, indicating that silver may be approaching ‘overheated’ territory, particularly as RSI readings near 80. However, this range is also often accompanied by accelerating gains.
The next potential upside target for silver looks to be the $35 area, where the 2012 rally ended after the 2011 sell-off. However, a potential shakeout of short- and medium-term bullish positions in the $32–$35 range could pave the way for long-term buyers to step in decisively. This shift may set the stage for silver to target a new all-time high, potentially surpassing the $50 mark reached in April 2011.
Crypto Market Stumbles During Climb
Market Picture
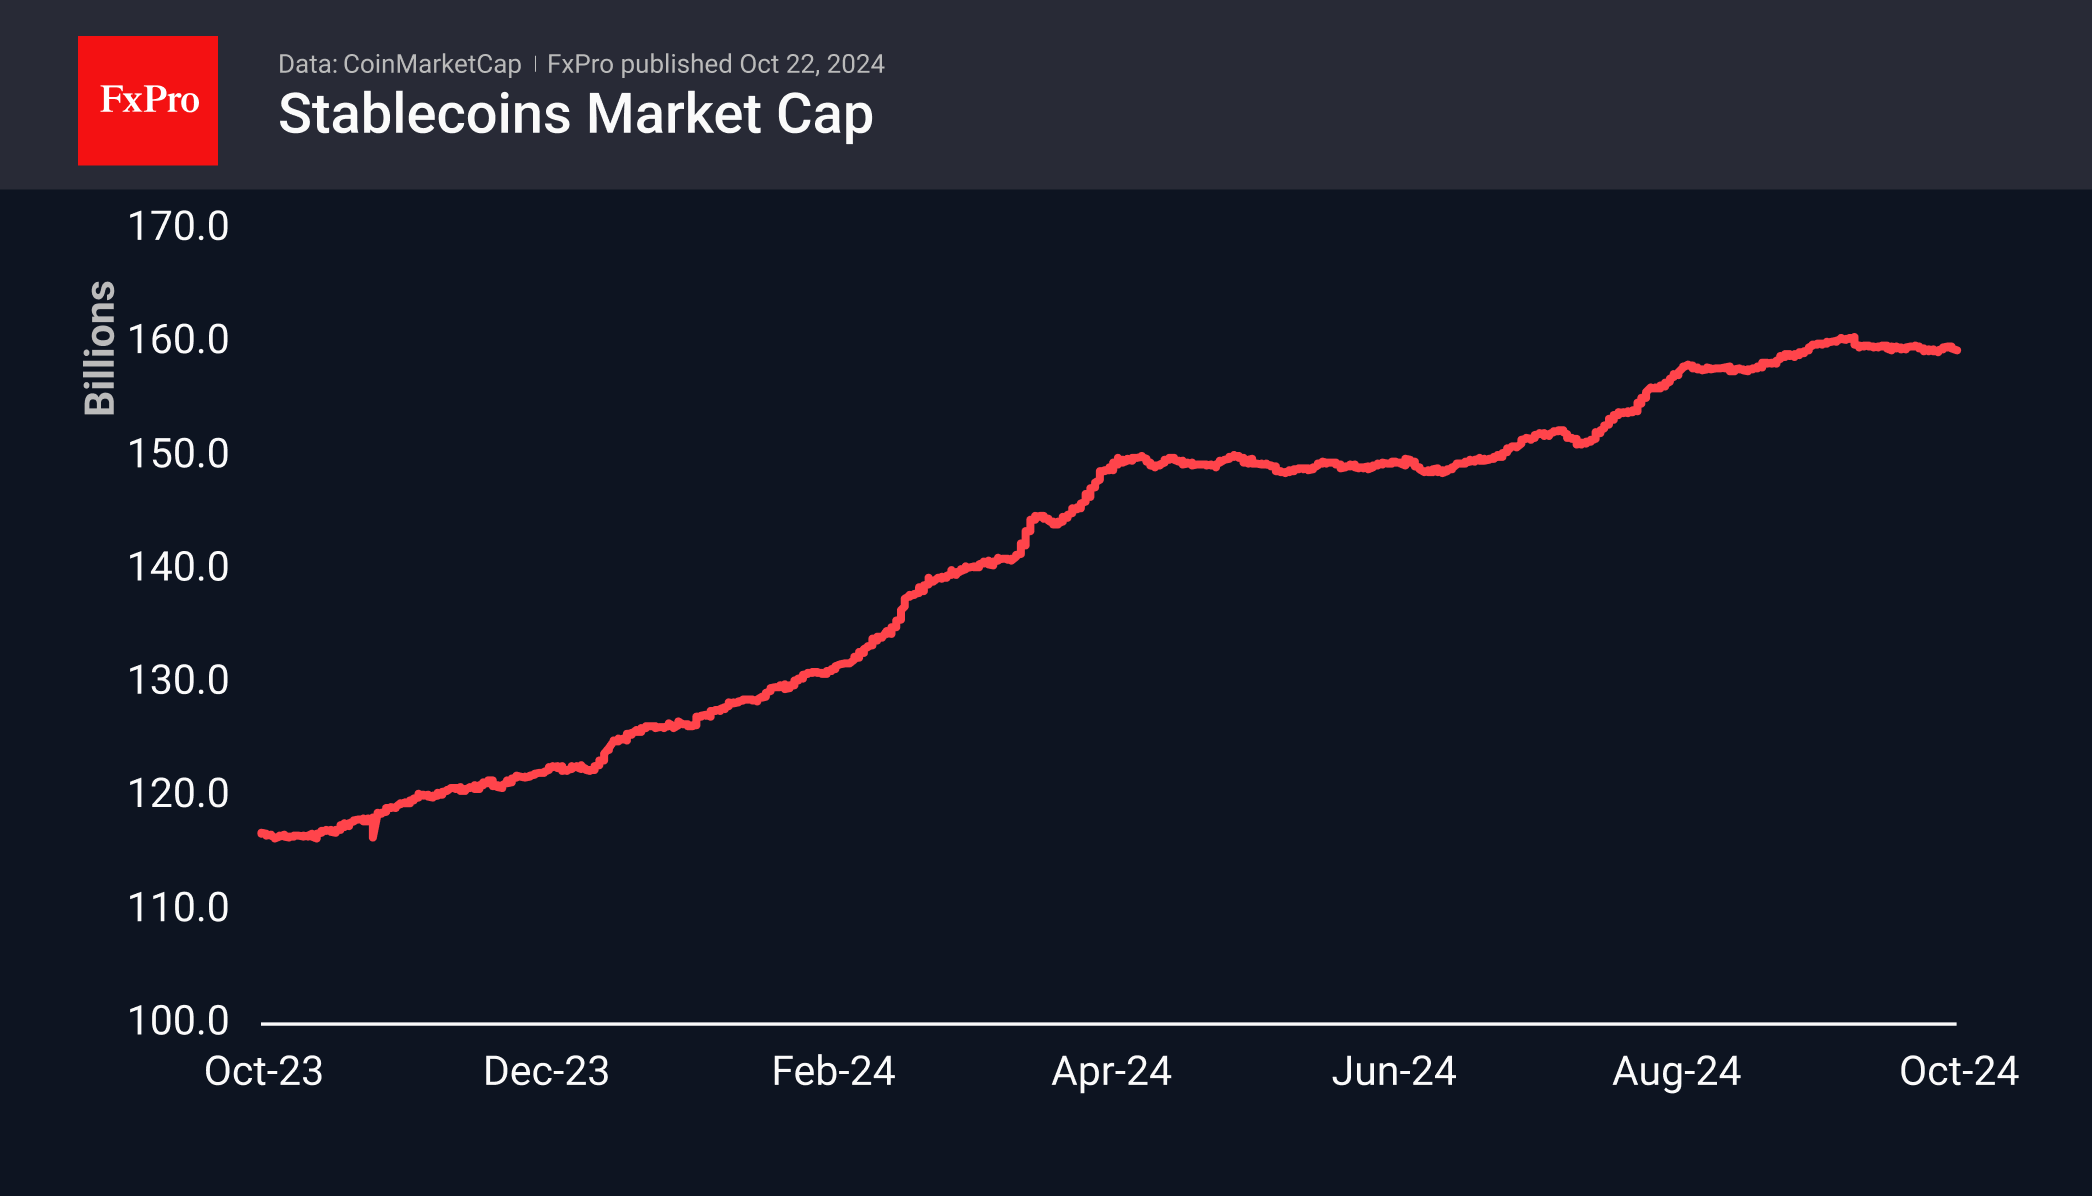
Cryptocurrency capitalisation has corrected 1.8% over the past 24 hours to $2.34 trillion. However, these figures reflect a partial recovery from earlier lows of around $2.27 trillion earlier in the day. For now, this appears to be a case of profit-taking during the upward trend, but it’s worth keeping an eye on the market dynamics over the next few days.
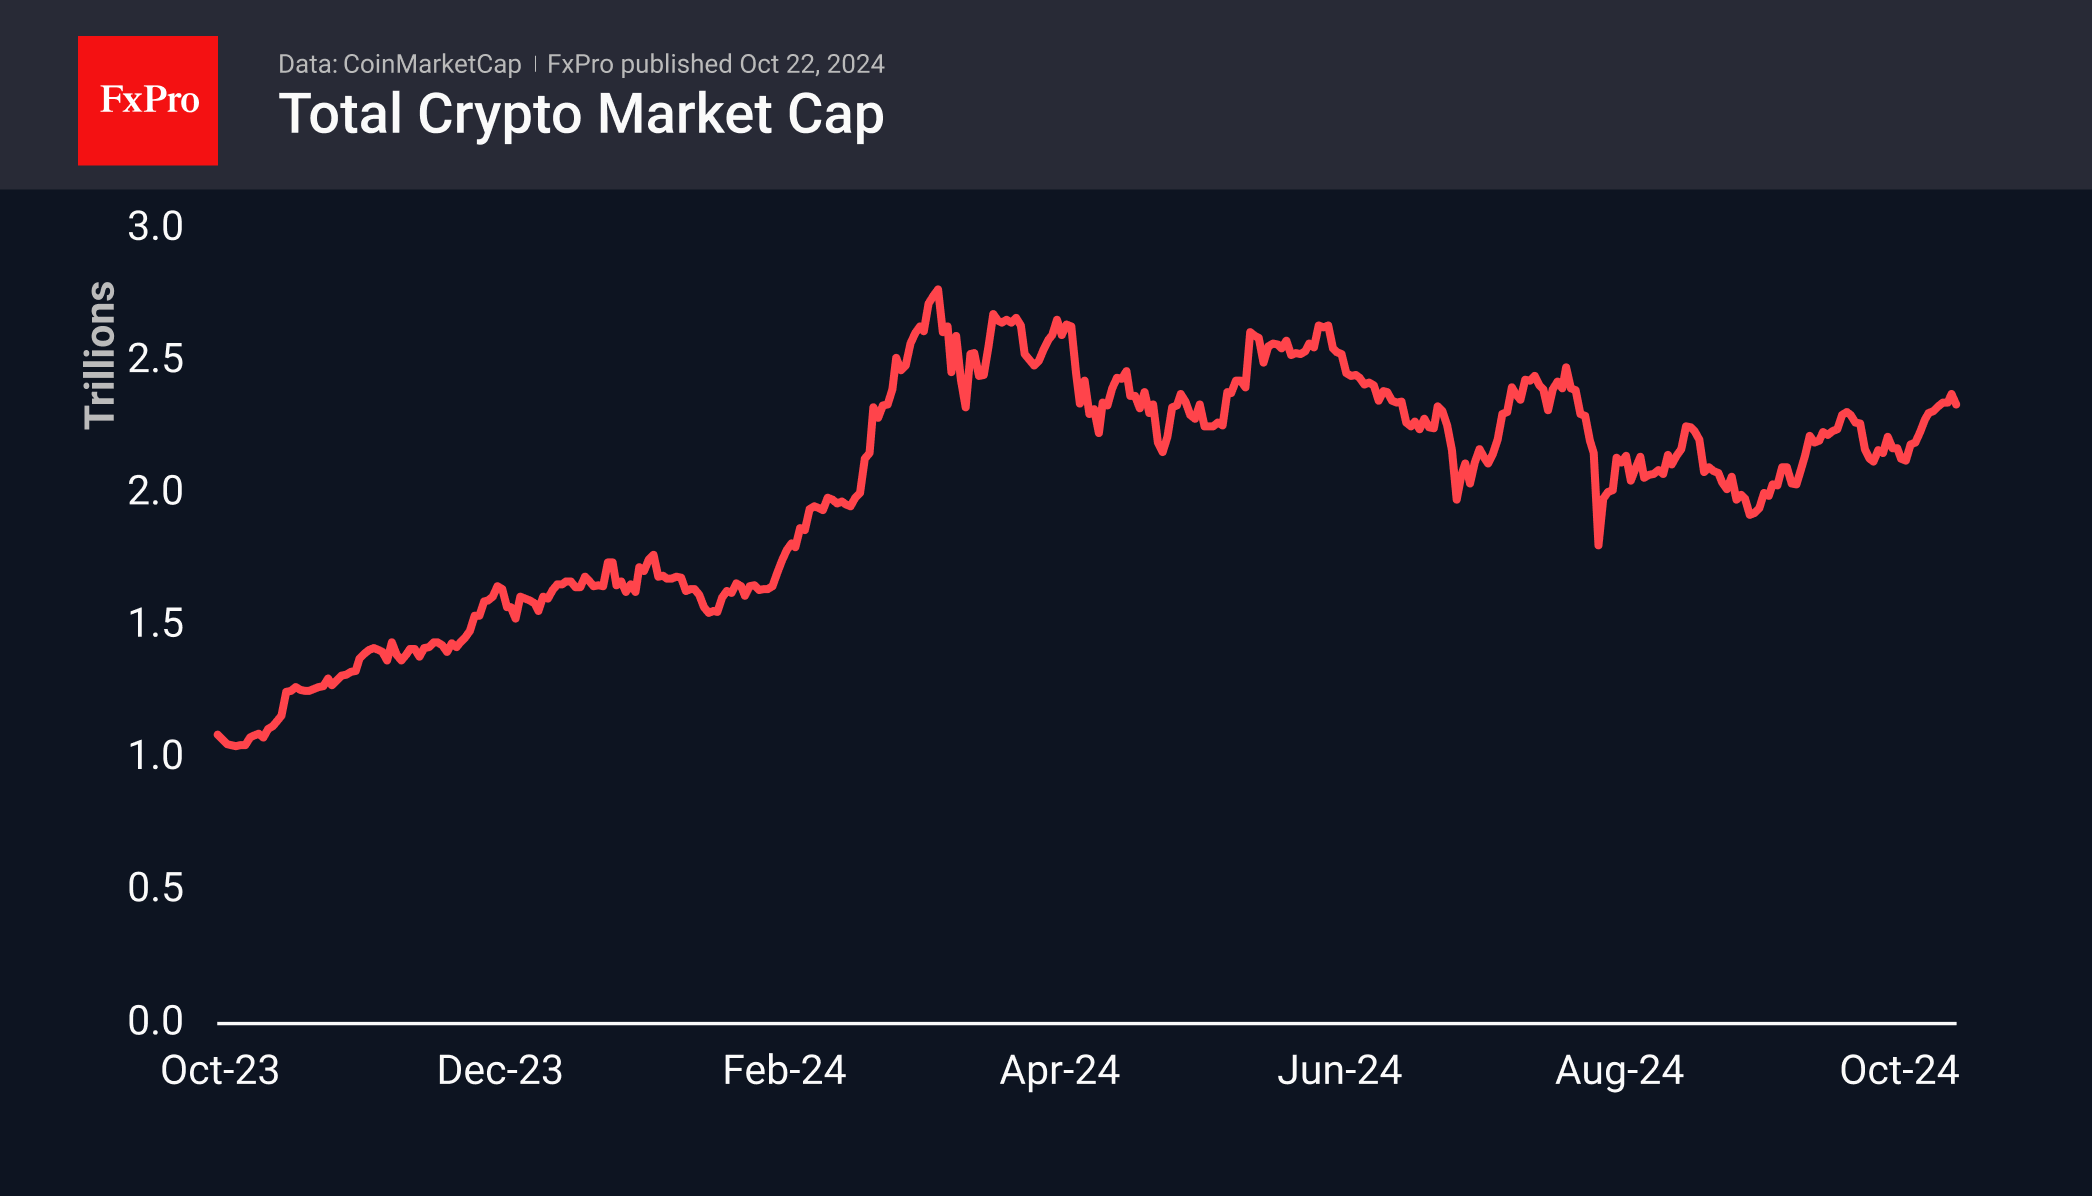
Stablecoin volume has not increased since late September, setting up a potential pause in the growth of the broader cryptocurrency market, as stablecoins are often seen as liquidity for quick purchases of coins of interest. The previous growth momentum was from August to September, when the overall crypto market capitalisation pushed off the bottom.
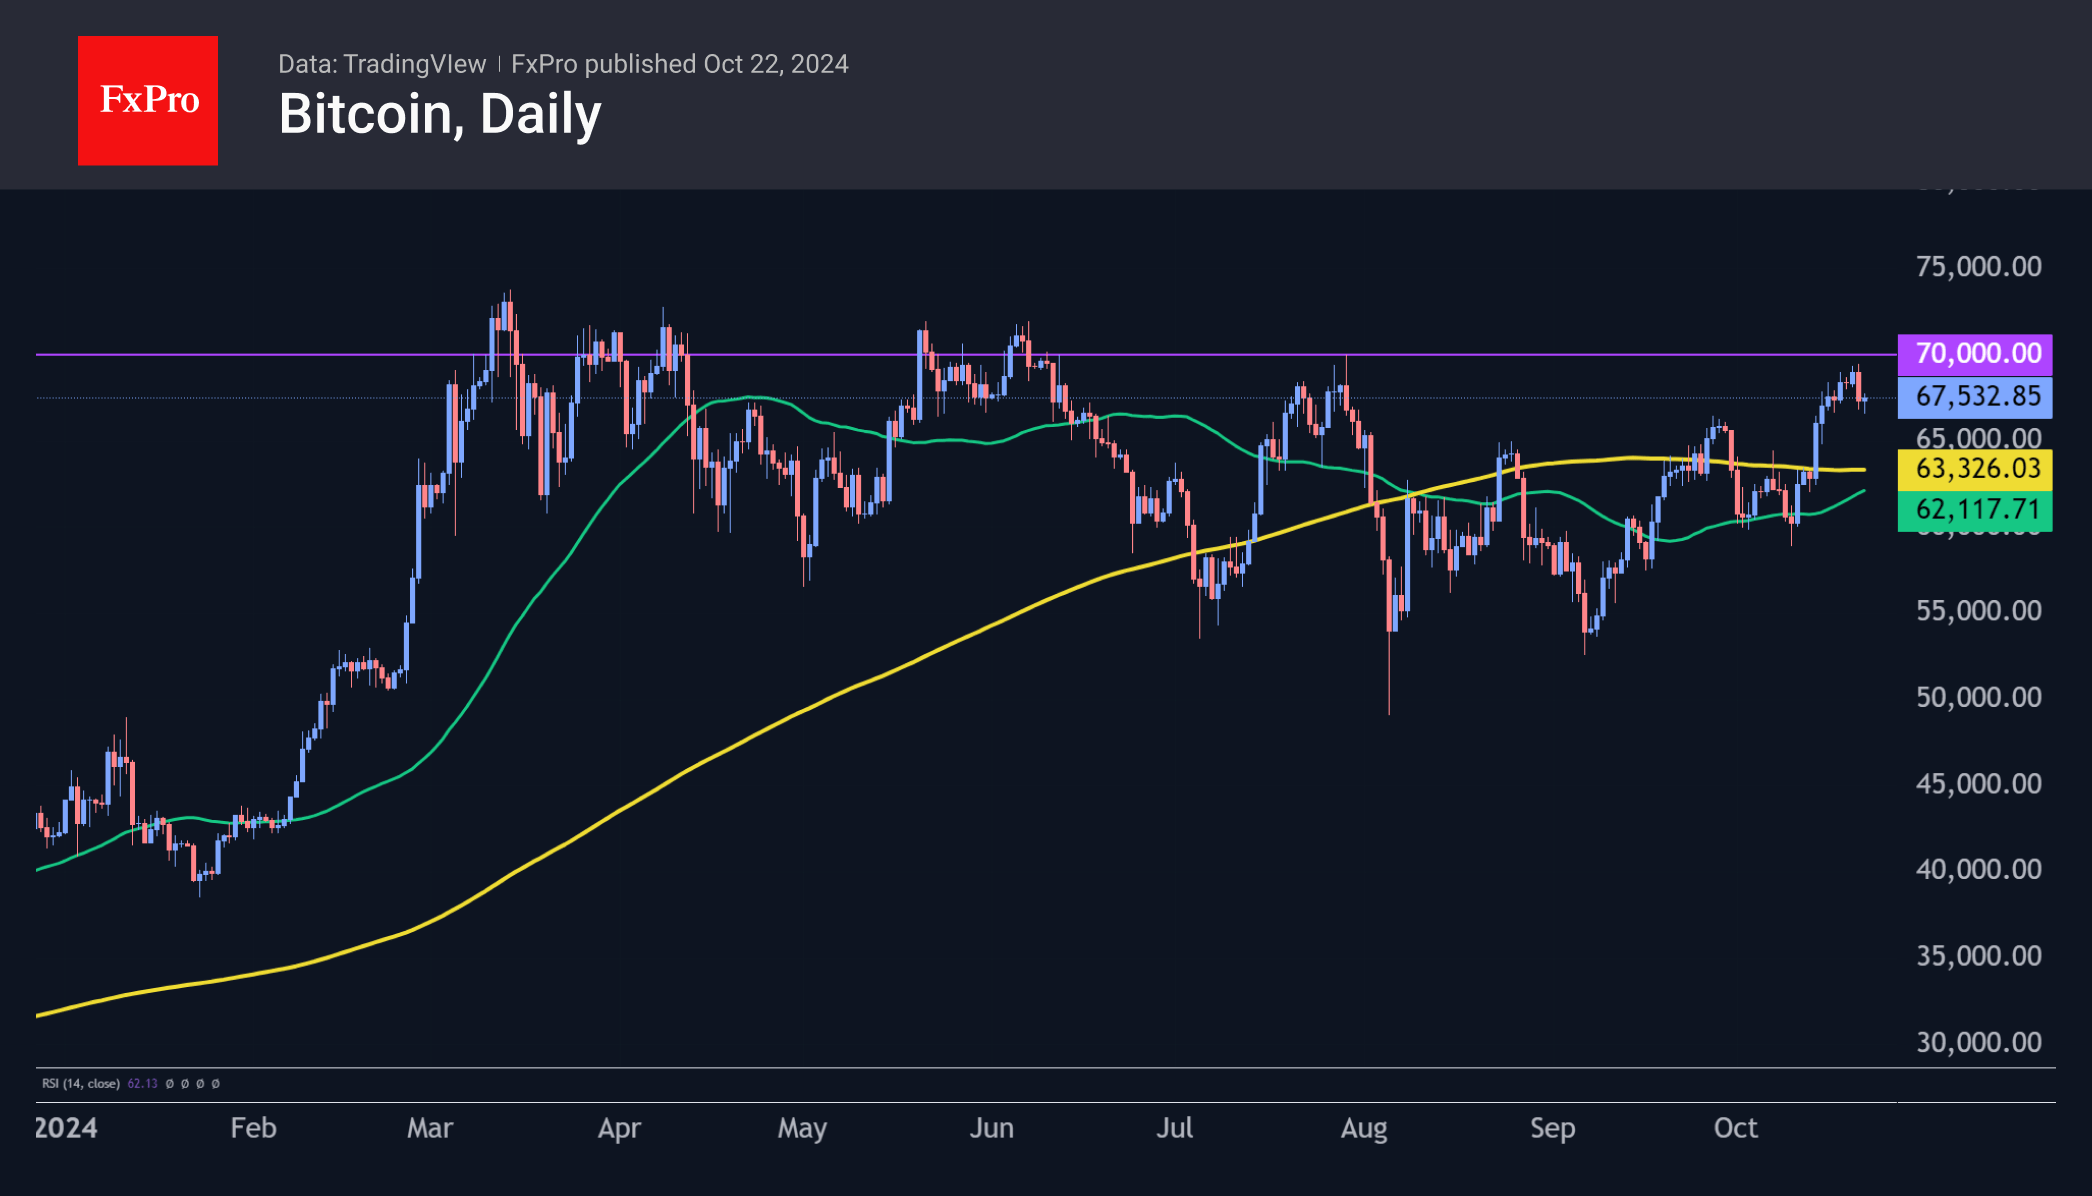
The main reason for the entire crypto market’s subsidence seems to be Bitcoin, which the bears defended against an assault on the $70K level. They intensified selling at $69.5K early in the day on Monday and dropped the price to $66.5K on Tuesday morning.
News Background
According to CoinShares, global investment in cryptocurrency funds rose to $2.199 billion last week, following inflows of $407 million the week before. The figure was the highest in the last 13 weeks. Investments in Bitcoin rose by $2.134 billion, Ethereum by $58 million, and Solana by $2.4 million. Investments in multi-crypto asset funds decreased by $5 million.
Trading volume grew by 30%, and assets under management approached $100 billion.
According to Coinglass, total open interest (OI) in bitcoin futures reached a record $40.6 billion. In terms of coins, the figure was 592,000 BTC, the highest since December 2022.
The Bitcoin network’s hashrate updated the historical maximum. On October 19, it reached 791 EH/s for the first time, according to data from Cloverpool (formerly BTC.com), reflecting miners’ capacity build-up. The seven-day average hash rate reached 703 EH/s, according to Glassnode.
According to JPMorgan, US-listed public miners achieved a record 28.9% share of the global Bitcoin hashrate in October. Since the halving, these companies have increased their share by 8%, highlighting their ‘efficiency and financial advantages’.
AUD/USD Struggles for Stability: Chances are Slim
The AUD/USD pair is attempting a recovery toward 0.6681, though the prospects seem uncertain as the pair remains near a six-week low. The strengthening of the US dollar and the rise in US Treasury yields, driven by expectations of a confident victory for Donald Trump in the upcoming US presidential election, are weighing heavily on the Australian dollar.
Despite ongoing expectations for interest rate cuts by the US Federal Reserve in November and December, signs of stability in the US economy further bolster the US dollar. However, the market is tempering its expectations for further monetary easing next year.
On the domestic front, Australia's recent labour market data was positive. September figures showed a job increase of 64.1k, significantly above the forecasted 25.0k. The unemployment rate held steady at 4.1%. Investors are now looking forward to upcoming PMI data, which could provide further insights into the health of Australia's economy.
Despite these positive domestic indicators, China's influence remains a critical factor for the Australian dollar, given its role as Australia's primary trading partner. The market has deemed recent stimulus measures in China insufficient, adding to the challenges for the AUD.
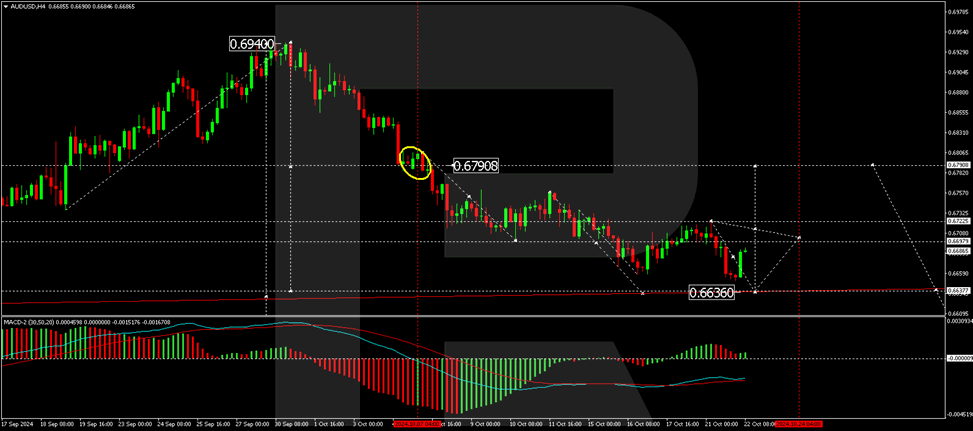
Technical analysis of AUD/USD
The AUD/USD is downward towards the target level of 0.6636. Upon reaching this target, the market may form a new consolidation range at these lows. If an upward breakout occurs, a correction towards 0.6790 might be considered. The MACD indicator supports this scenario, with its signal line below zero and poised for potential growth, suggesting a possible shift in momentum.
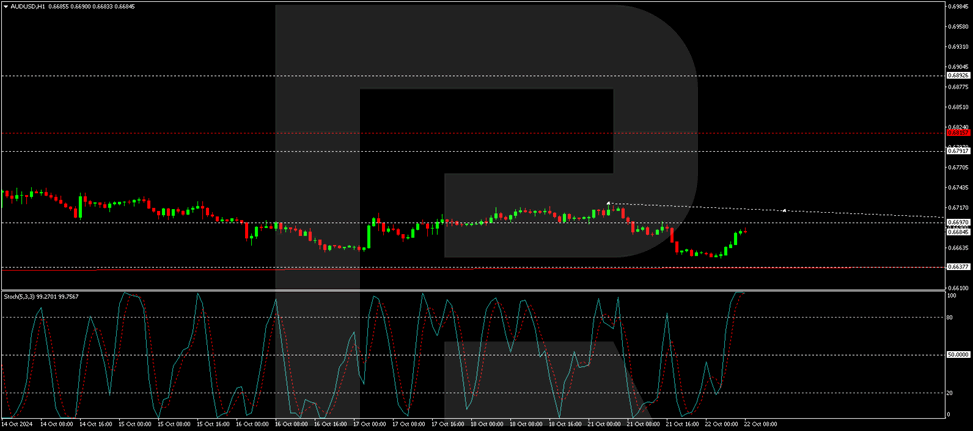
On the hourly chart, AUD/USD has completed a downward wave to 0.6650, followed by a correction to 0.6690. Another downward movement towards 0.6636 is anticipated today. A subsequent growth wave towards 0.6722 may develop if this level is reached. The Stochastic oscillator backs this outlook, with its signal line currently above 80 but expected to descend sharply towards 20, indicating the potential for further downward movement before any recovery.
Gold Technical: Bullish Acceleration in Progress Reinforced by “Trump Trade”
- Republican president nominee Donald Trump prospect of winning the White House has increased in the past week based on data from betting markets.
- Resurgence of “Trump Trade” narrative has triggered a positive feedback loop into Gold (XAU/USD).
- An increase in tail-risk hedging activities also led to higher demand for Gold (XAU/USD).
- Watch the US$2,590 key medium-term support on Gold (XAU/USD)
Since our last publication, the price actions of Gold (XAU/USD) have staged the bullish breakout and cleared above the US$2,640/715 medium-term resistance. The yellow metal has rallied by 9.6% from 11 September to Monday, 21 October current all-time high of US$2,740.
“Trump Trade” narrative has reinforced the uptrend in Gold
The “Trump Trade” narrative has gained traction in the recent week due to rising odds of Trump winning the US election based on data from betting markets (60%Trump versus 39% Harris based on Real Clear Politics data as of 20 October).
Given that Trump’s “generous” corporate tax cuts proposal to reduce the tax rate to 15% from 21% will likely widen the US federal deficit further, in turn leading the market to question the credit standing of the US government (such as the prospect of more frequent government shutdowns) that may see an erosion of confidence in US Treasuries and strengthened Gold (XAU/USD).
Gold is being used as tail-risk hedge
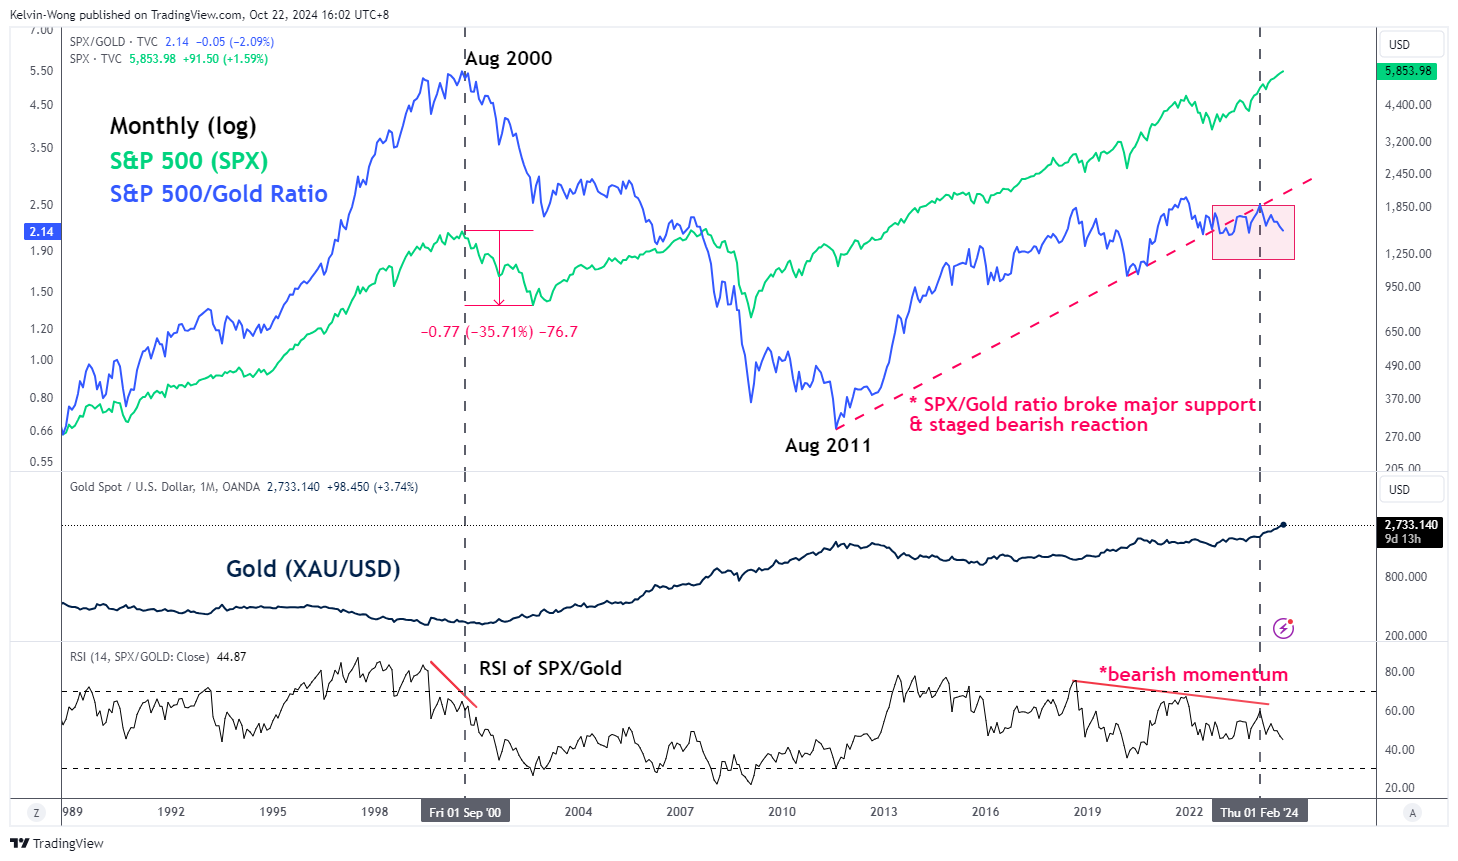
Fig 1: S&P 500 & S&P 500/Gold ratio long-term secular trends as of 22 Oct 2024 (Source: TradingView, click to enlarge chart)
Trump’s proposed tax and trade tariffs policies are likely to reignite upward inflationary pressures in the medium to long-term.
In addition, geopolitical risk premium has not been totally eradicated yet in the Middle East due to the ongoing Israel-Hamas war.
Hence, higher inflationary pressure and an increase in geopolitical risk premium are deadly concoctions that may lead to stagflation which in turn can spark a potential risk-off episode in the global financial markets.
In the lens of technical analysis, the ratio chart of S&P 500 over Gold (XAU/USD) together with its monthly RSI momentum indictor of the S&P 500 / Gold (XAU/USD) ratio has displayed a significant underperformance of S&P 500 against Gold (XAU/USD) since February 2024 (see Fig 1).
Similar observation has been detected in the past during the peak of the Dot.com bubble in August 2000 before the S&P 500 staged a major correction of 35% over the next two years.
Therefore, the recent heightened demand for Gold (XAU/USD) is likely reinforced by portfolio tail-risk hedging activities as well.
Medium-term uptrend remains intact
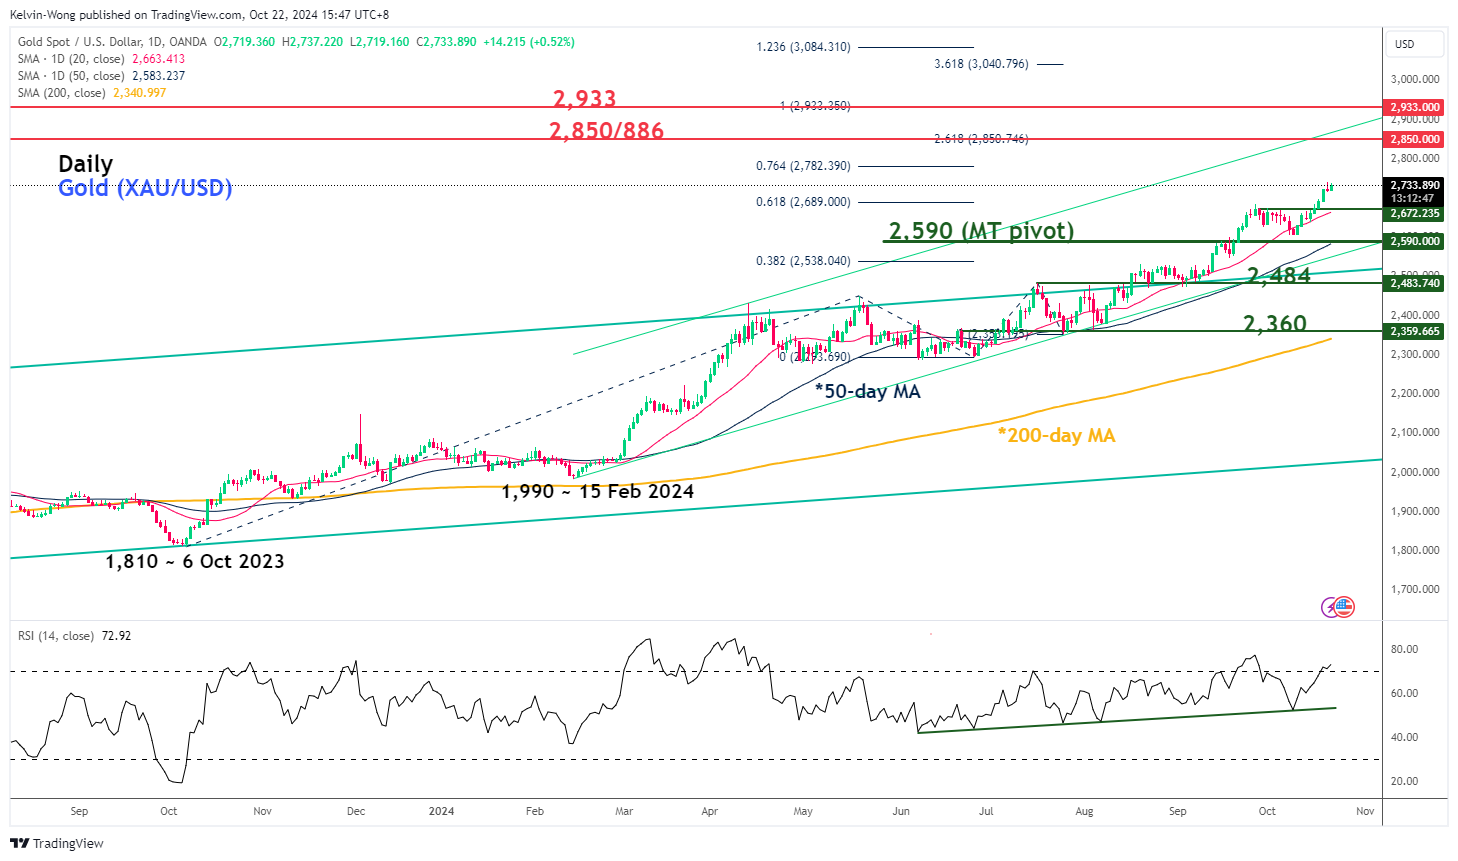
Fig 2: Gold (XAU/USD) medium-term & major trends as of 22 Oct 2024 (Source: TradingView, click to enlarge chart)
The price actions of Gold (XAU/USD) have been trading firmly above its rising 20-day and 50-day moving averages since 9 August 2024 supported by a parallel ascending trendline support seen in the daily RSI momentum indicator (see Fig 2).
These observations suggest that medium-term upside momentum remains intact for Gold (XAU/USD).
Watch the US$2,590 key medium-term pivotal support for the potential continuation of the impulsive up move sequence for the next medium-term resistances to come in at US$2,850/886 and US$2,933 (also the upper boundary of the medium-term ascending channel from 15 February 2024 low).
On the flipside, failure to hold at US$2,590 negates the bullish tone for a multi-week correction sequence to unfold within its major uptrend phase to expose the next medium-term supports at US$2,484 and US$2,360 (also the 200-day moving average).
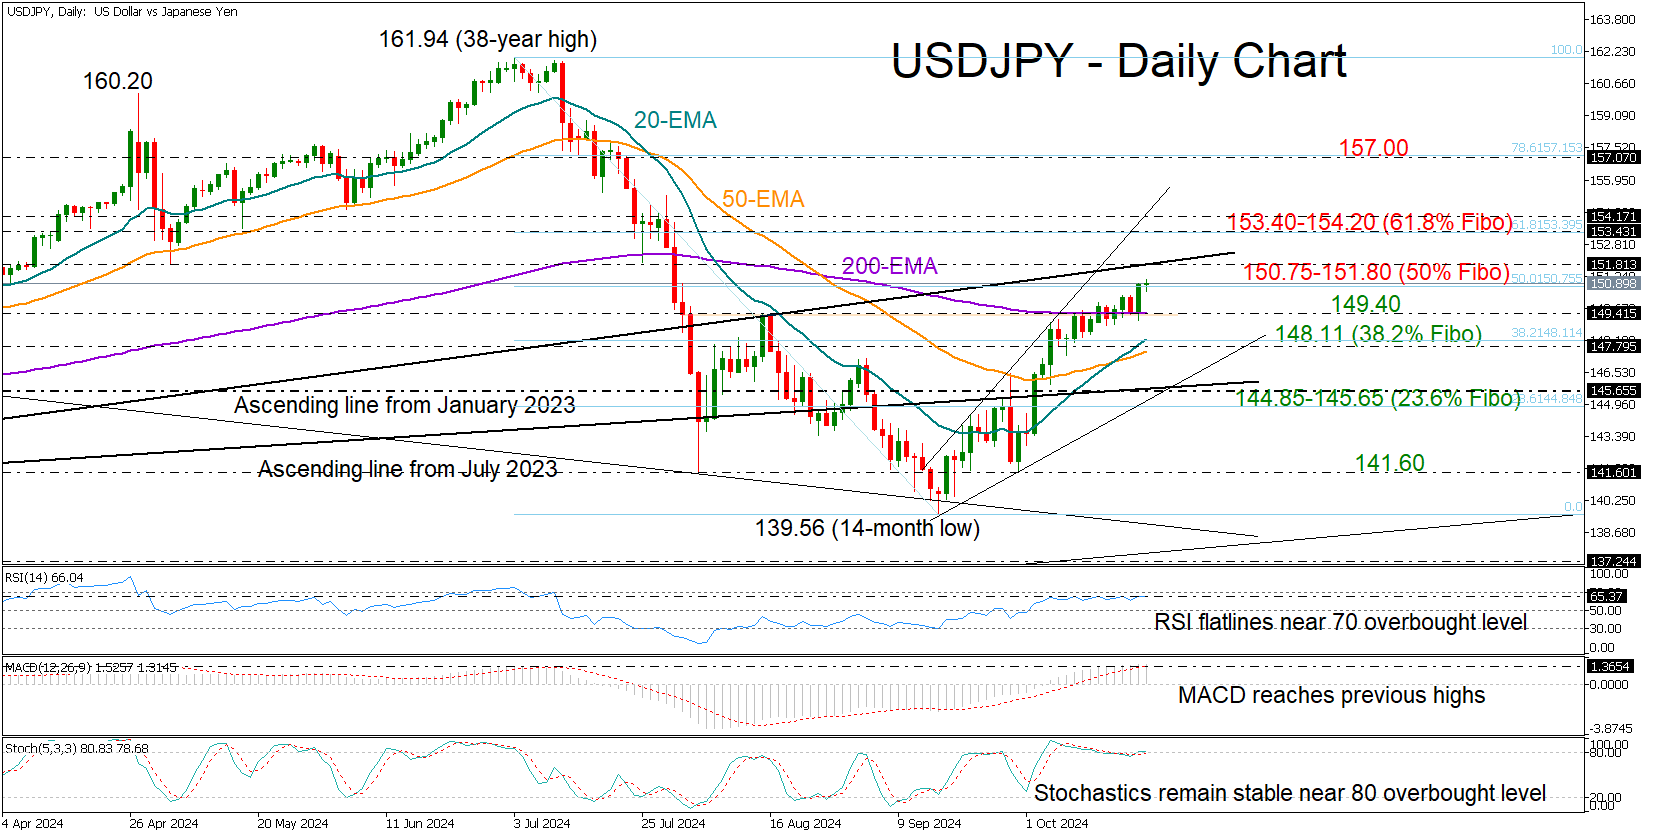
USDJPY Poised for a Bullish Trend Reversal
- USDJPY jumps back into the 150 area after two months
- Caution needed due to overbought conditions
USDJPY kicked off the week on a strong note, rising at a faster pace to close above the 150.00 mark for the first time since August. The pickup in the price confirms a bullish breakout above the August high of 149.40 and the 200-day exponential moving average (EMA). Now, all eyes are on the important trendline, which has shifted from support to resistance, sitting at 151.80—this level previously led to a dip to a 14-month low.
That said, it's worth noting that technical indicators are raising some red flags. The Relative Strength Index (RSI) and the stochastic oscillator are flatlining near their overbought levels. Note that the 50% Fibonacci retracement of the July-September downtrend is currently keeping the bulls in control around the 150.75 level.
In trend signals, the recent crossover between the 20-day and 50-day EMAs is instilling a sense of optimism, suggesting any pullbacks might be short-lived.
If buyers step in and push above the 151.80 resistance, the next area of resistance might develop between 153.40 and 154.20, which aligns with the 61.8% Fibonacci level. A sustained move higher could peak near the 157.00 level.
On the flip side, a pullback might initially retest the 200-day EMA at 149.40. If this base breaks this time, the 20-day and 50-day EMAs may come to the rescue near the 38.2% Fibonacci level at 148.11. Any further declines could lead the price toward the 144.85-145.65 range.
In summary, while USDJPY bulls have shown impressive strength lately, there are signs of exhaustion in the short term. A slight correction in the bullish trend seems likely before we see new higher highs.
XAG/USD Analysis: Silver Price Approaching $35
Precious metal prices are fluctuating near multi-year highs due to safe-haven demand driven by:
→ Uncertainty surrounding the U.S. elections,
→ Ongoing tensions in the Middle East,
→ Expectations of central banks lowering interest rates.
As seen on the XAG/USD chart, silver prices:
→ Are near their highest levels in 12 years,
→ Are approaching the $35 mark,
→ Have risen by over 43% since the start of the year.
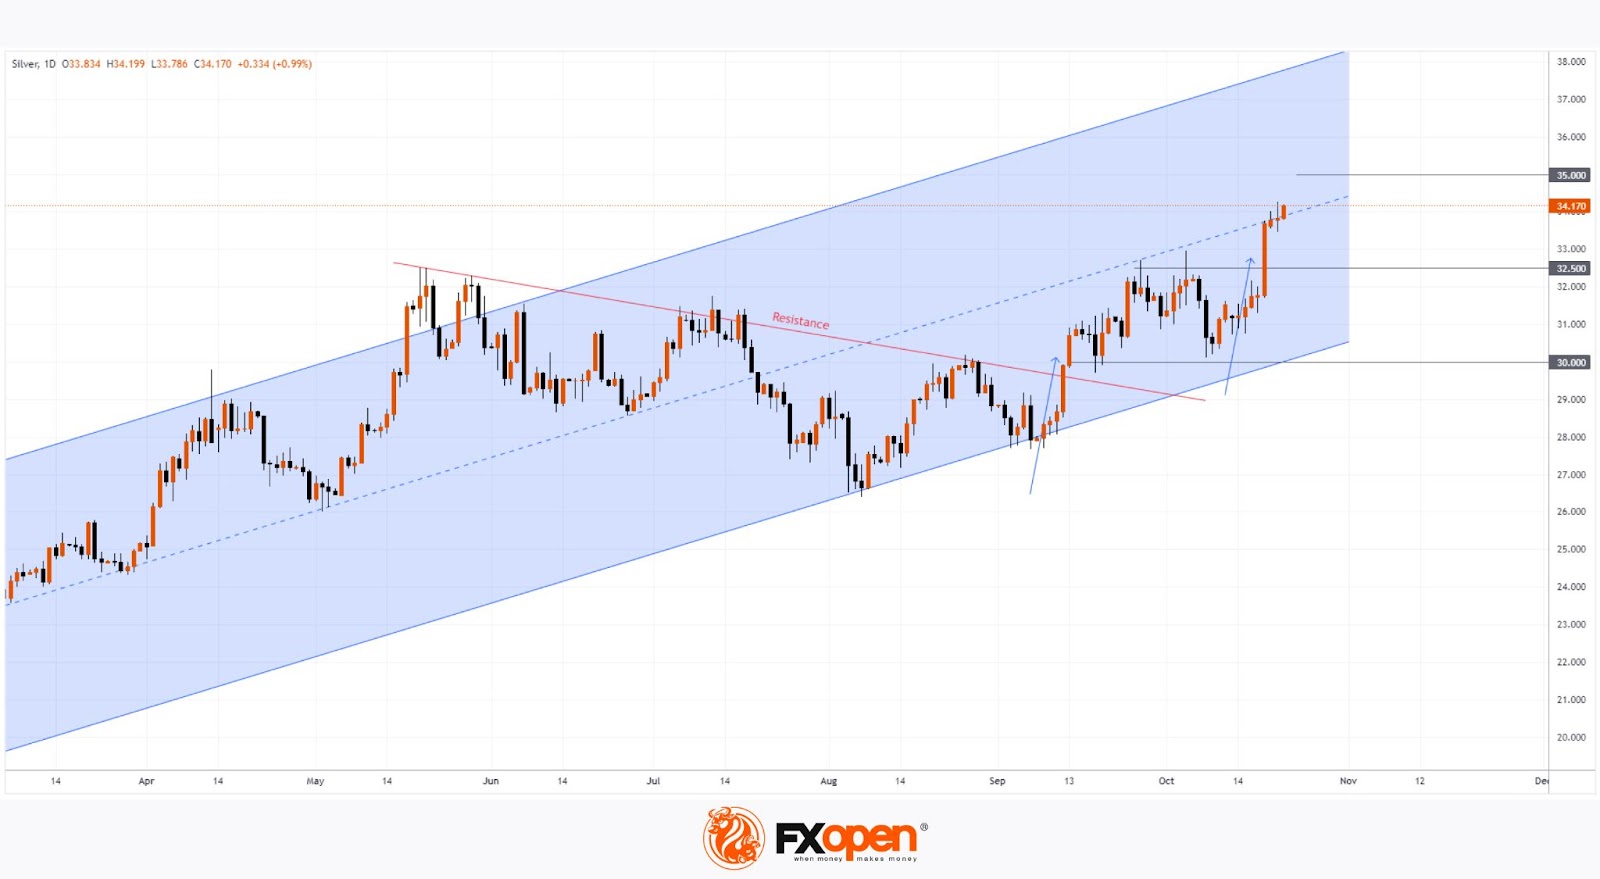
Technical analysis of the XAG/USD chart indicates that silver is following an upward trend (shown in a blue channel), with the current price near its median line. This suggests a potential balance between supply and demand, which could stabilise price fluctuations.
Key observations:
→ A red resistance line on the chart reflects a corrective phase within the blue channel.
→ Breaking through this resistance in September triggered a strong bullish impulse (marked by a blue arrow).
→ This impulse was so robust that it pushed the price above the psychological $30 level, turning it into support.
A similar pattern might emerge in the future. After another strong bullish move (marked by a second blue arrow), the $32.5 level could also become a support area.
Read analytical Silver price forecasts for 2024 and beyond.
Start trading commodity CFDs with tight spreads. Open your trading account now or learn more about trading commodity CFDs with FXOpen.
This article represents the opinion of the Companies operating under the FXOpen brand only. It is not to be construed as an offer, solicitation, or recommendation with respect to products and services provided by the Companies operating under the FXOpen brand, nor is it to be considered financial advice.