Sample Category Title
Japanese Election Could Hold Key to Next BoJ Hike
- Japanese snap election will be held on Saturday, October 27
- Governing LDP party vying for another win but outcome uncertain
- BoJ’s outlook could be clouded if LPD doesn’t achieve majority
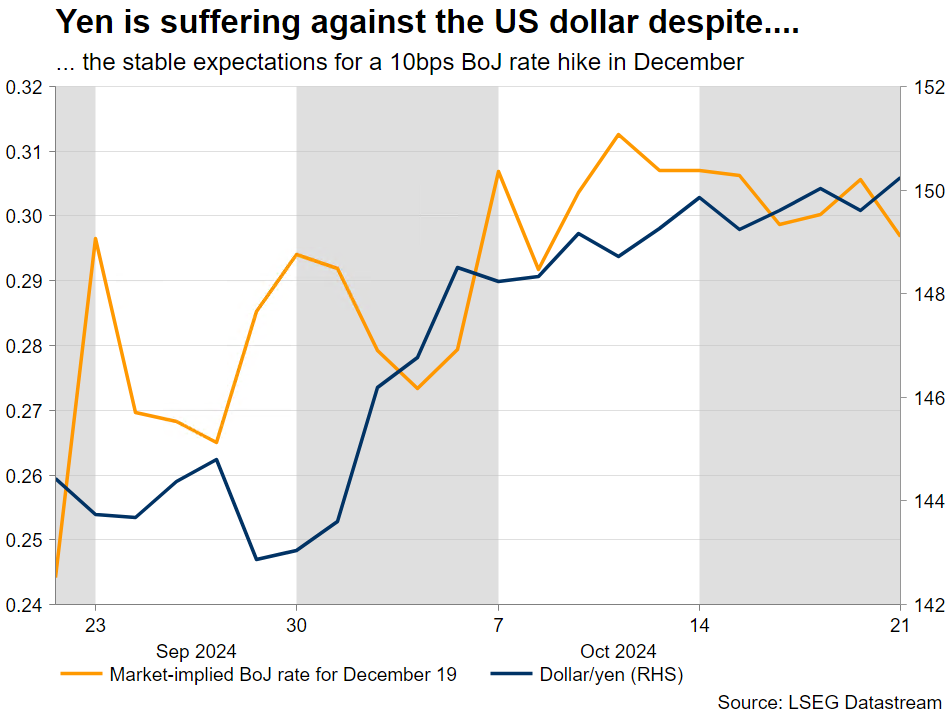
- Yen could suffer if the new government focuses more on fiscal policy
Japan holds elections on October 27
Just a few days before the key US presidential election and the much-discussed November 7 Fed meeting, Japan will hold a general election. This is a key moment for the country and especially the Bank of Japan, which after almost 18 years managed to hike interest rates and appears willing to continue tightening its monetary policy stance.
Why was snap election called?
The former Prime Minister (PM) Kishiba was forced to resign in August on the back of a number of scandals. Ishiba won the internal Liberal Democratic Party (LDP) contest and upon becoming the new PM, he announced snap election for October 27, one year before the scheduled date, despite holding a strong majority in the lower house.
The profile of the next PM
Ishiba rose to the top LDP spot after a handful of unsuccessful attempts, most notably losing to former PM Abe in 2012 by a handful of votes. Ishiba has always been very vocal about defence and foreign affairs, talking about an Asian NATO and strengthening Japan's military to counter China's aggression.
He is not overly fond of fiscal consolidation despite Japan’s debt-to-GDP rising north of 250%. Ishiba has a clear preference for stimulus packages and has announced a support package to help rural areas cope with rising costs. Interestingly, Ishiba has talked about revising the current flat, non-progressive tax structure in Japan. He looks more determined to implement changes compared to his predecessor, but his strategy will be ultimately defined by the election results and the strength of the economy.
Ishiba’s view about the BoJ
Upon news of Ishiba’s win in the LDP run-off, the market cheered with the yen gaining and stocks falling as he was seen as clearly more pro-hawkish than his main competitor, Takaischi. However, since taking over and during the pre-election campaigning, Ishiba and the new economic minister have changed the tune.
Comments like "we are not in an environment for additional rate hikes" and "the BoJ should be careful about raising rates given it takes time to completely exit deflation" are prime examples of the new LDP leadership back peddling on its original stance. BoJ’s independence is not questioned, but, as history has shown, only the combination of fiscal and monetary policies could produce results in Japan.
The market is still pricing in a 70% chance for a 10bps rate hike on December 19, but such a move clearly depends on the October 27 outcome and on external factors like the US presidential election, the Fed decisions and the developments in the Middle East. At least, the BoJ hawks might still be able to smile as there are reports that the largest union Rengo is aiming for a more than 5% wage hike for next year’s spring wage negotiations.
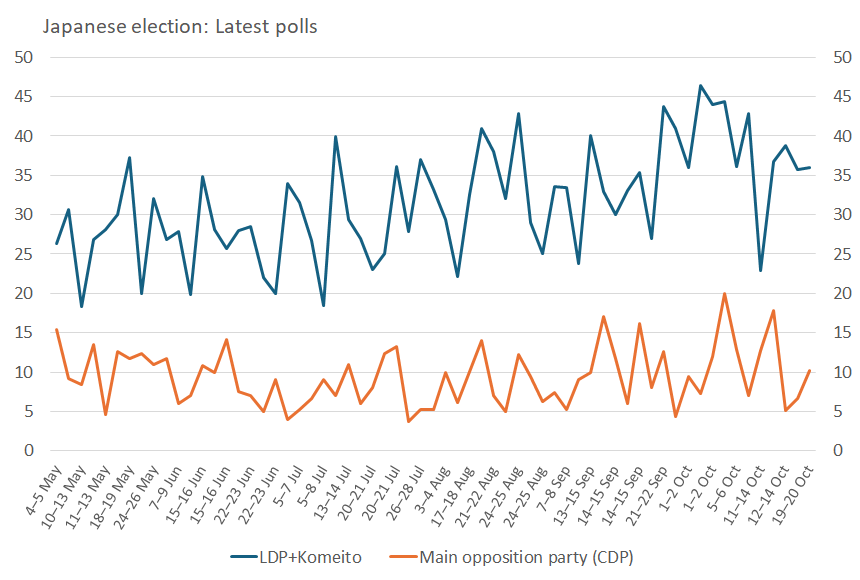
Majority is not guaranteed according to the latest polls
Following the declaration of the snap election, most polls had the LPD easily winning the 233 seats needed for a majority and forming another government with its junior partner, the Komeito party. However, the most recent polls have opened the door to the possibility of the LDP performing quite badly on October 27 and potentially falling short of achieving an outright majority.
Main scenarios for the election
(1) Easy win by LDP and a new government with Komeito – 60% probability
Despite almost 40% of the voters being still undecided and the numerous LDP scandals, the opposition remains fragmented and hence the Japanese public will most likely give LDP another chance.
A strong win would allow Ishiba to implement his strategy about brave fiscal expansion, possibly at the expense of a tighter monetary policy stance. The BoJ would remain open to further rate hikes, but the lack of coordination could diminish the current dynamics. The yen could suffer from the removal of the biggest tailwind with dollar/yen underperforming and rising again below the 152 area.
(2) Weak result by LDP and its allies but still achieve the necessary majority – 30%
This scenario is gaining traction according to the latest polls. In this outcome, the new PM Ishiba might be forced to seek more coordination with the BoJ. He has finally managed to become the PM, and he will do everything to remain in charge.
Understandably, Ishiba will still pursue his fiscal expansion plans with questionable funding sources as tax increases will hit consumption again. But the chance of a December BoJ rate hike will remain alive with the yen possibly reversing some of its recent underperformance.
3/ No majority achieved, search for further coalition partners follows or new election – 10%
This is probably the worst scenario for the BoJ as the political unrest could force Ueda et al to postpone any rate decision unless the mist clears. Negotiations for a grand coalition would follow and potentially result in an agreement, especially as minority governments are extremely rare in Japan.
In this case, the yen will remain under pressure with dollar/yen continuing its journey north. This rally could really pick up speed if the incoming US data prints remain on the strong side.
Brent Crude – Oil Rises on China Rate Cuts But Middle East Uncertainty Lingers
- Oil prices rose due to Chinese rate cuts and Middle East uncertainty.
- The IMF downgraded its global growth forecast to 3.2%.
- Technically, Further upside is possible if conditions remain consistent. Geopolitics remains key.
Oil prices are enjoying a mini renaissance to start the week thanks to Chinese rate cuts and the ongoing and ever changing situation in the Middle East. This has been the rhetoric and driving force over the past few weeks and not much has changed.
Every data release from China or potential ceasefire discussions in the Middle East are resulting in swings in oil prices. The China situation may have more long lasting impact though as an economic slowdown in China means one for the rest of the world.
This was made more evident following the IMF revising down its global growth forecast to 3.2%. A slight downgrade but a downgrade nonetheless, pointing to the scope of downside risks in global markets. The IMF warned that the risks could come from further wars or trade protectionism, something which has become a hot topic on the US election campaign trail.
The projections by the IMF showed growth to remain mediocre in the medium term with a lot of uncertainty. There was also a downgrade to China’s 2025 forecasted growth by the IMF to 4.8% from a previous 5%. This brings the IMF in line with many institutions who have done the same in recent weeks.
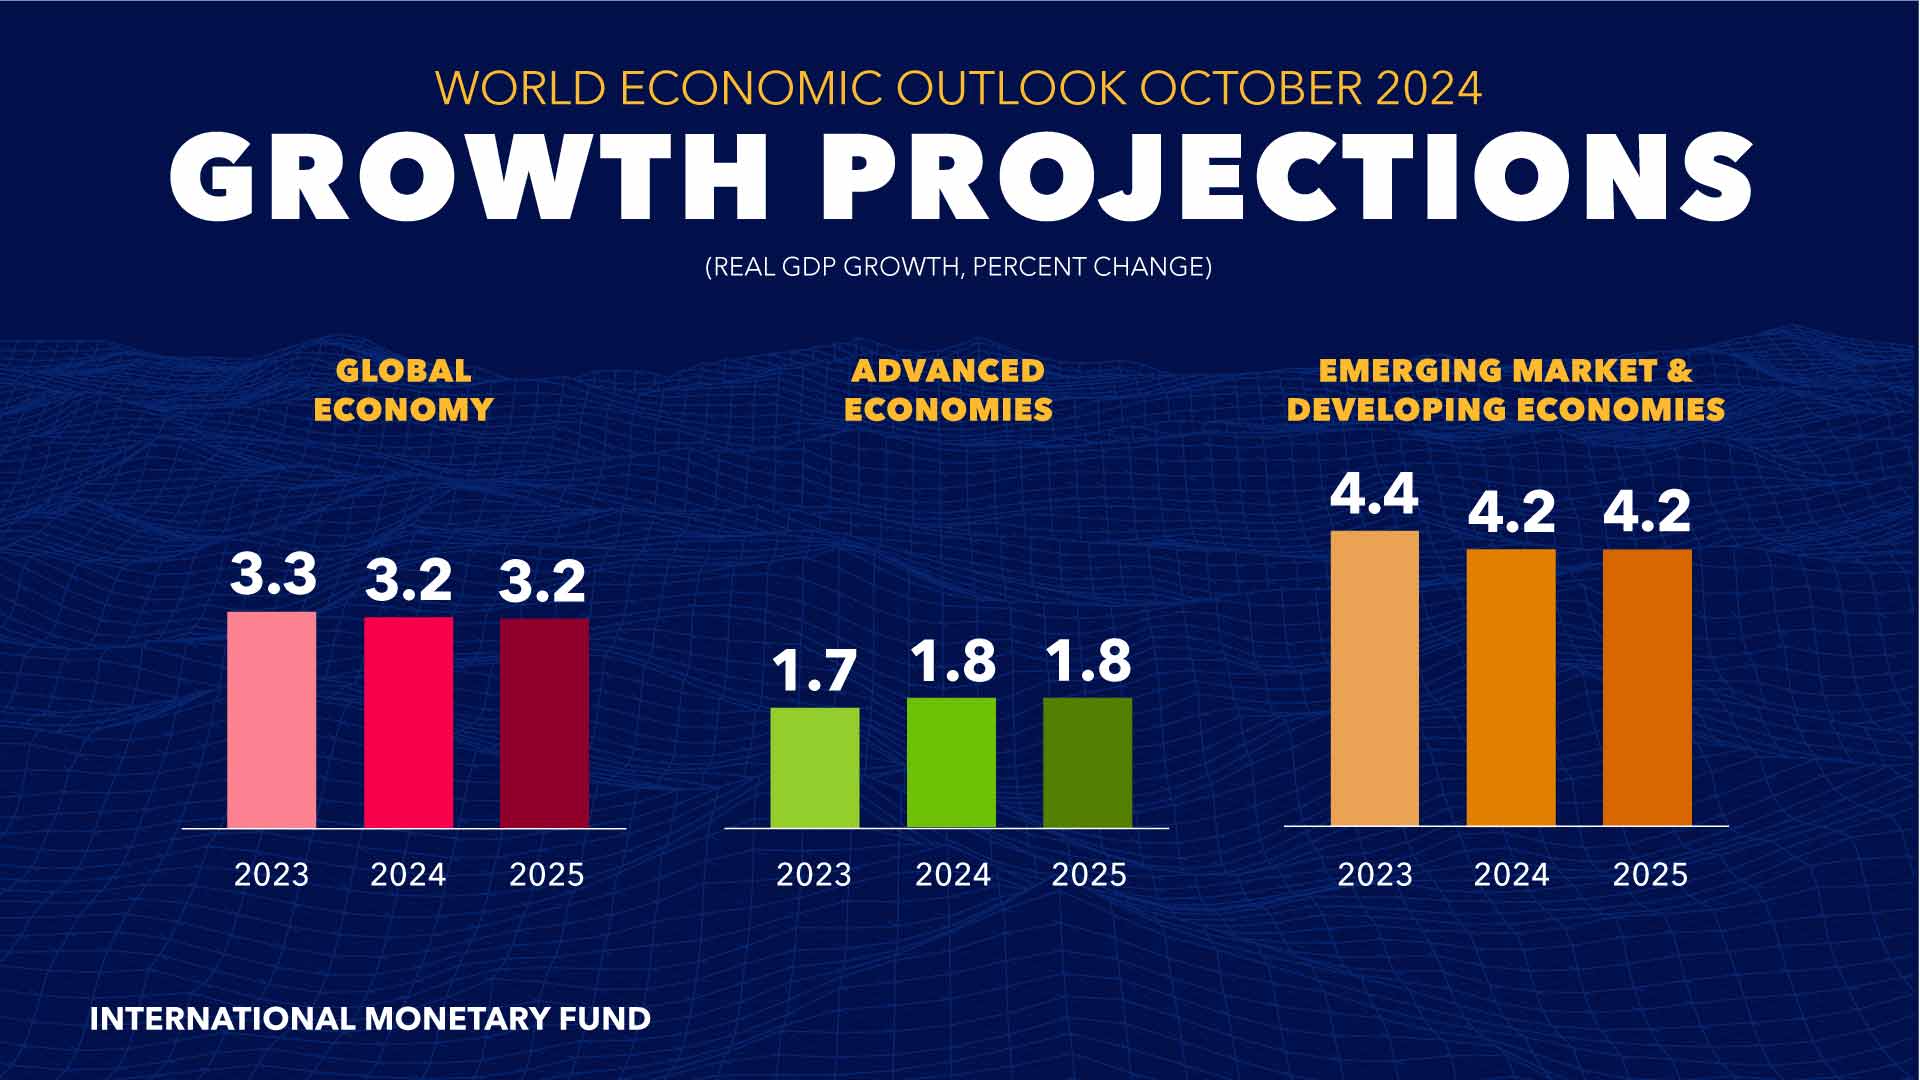
Source: IMF
Another sign that points to a potential slowdown in China comes from demand and supply dynamics. According to Commersbank’s commodity analyst, China was oversupplied by 930k barrels p/d in September.
The oil market in China is a concern. This is evident from China’s implied oil demand, which is calculated by subtracting net exports of oil products from the amount of crude oil processed. Exports have been on the decline and many hope the recent stimulus will help local demand as well. Only time will tell if the stimulus is enough.
The Week Ahead
There is a lack of high impact US data this week with eyes firmly focused on the geopolitical situation in the Middle East. Wednesday we get inventory data filtering through from the API and Thursday from the EIA, both of which could stoke some short-term volatility and moves for oil prices.
Download the Full IMF Report HERE: https://www.imf.org/en/Publications/WEO/Issues/2024/10/22/world-economic-outlook-october-2024
Technical Analysis
From a technical perspective, Oil has retested and hugged the descending trendline for the last 5 days before moving higher this morning.
Brent Crude Oil Daily Chart, October 22, 2024
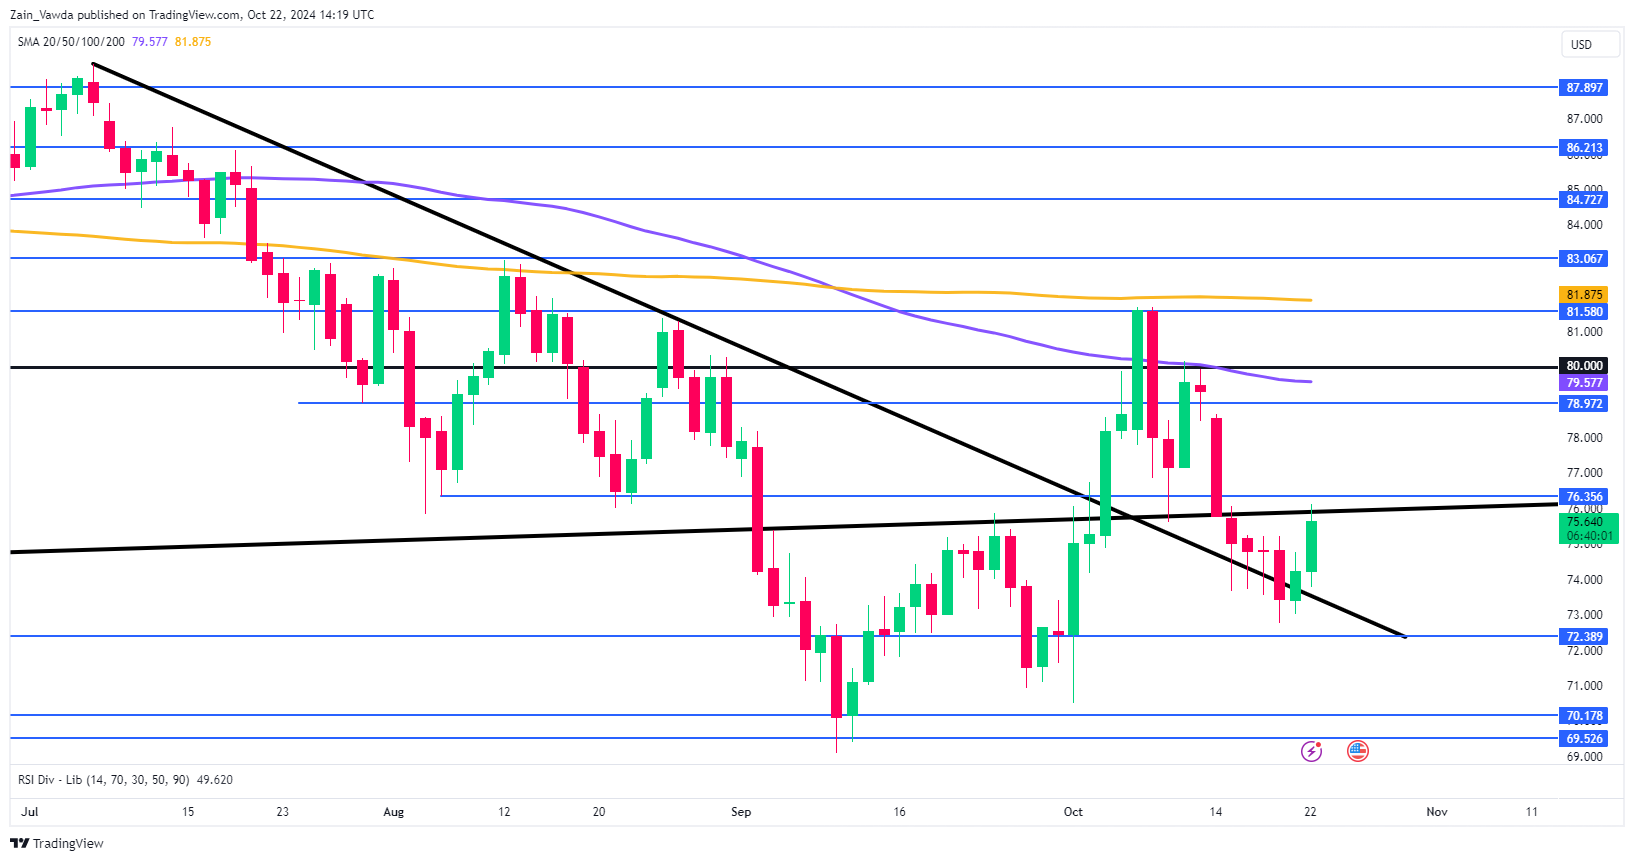
Source: TradingView (click to enlarge)
Dropping down to a four-hour chart (H4) and looking at price action we have seen a change in character. Markets are now printing higher highs and higher lows meaning bulls are now in control.
Immediate resistance rests at 76.00 where we also see the 100-day MA resting making this a key confluence area. Oil has already rejected off this level today, will the bulls have enough to break through? If oil can get above the 76.35 handle there is an open run toward the 78.90 handle.
Brent Crude Oil Four-Hour (H4) Chart, October 22, 2024
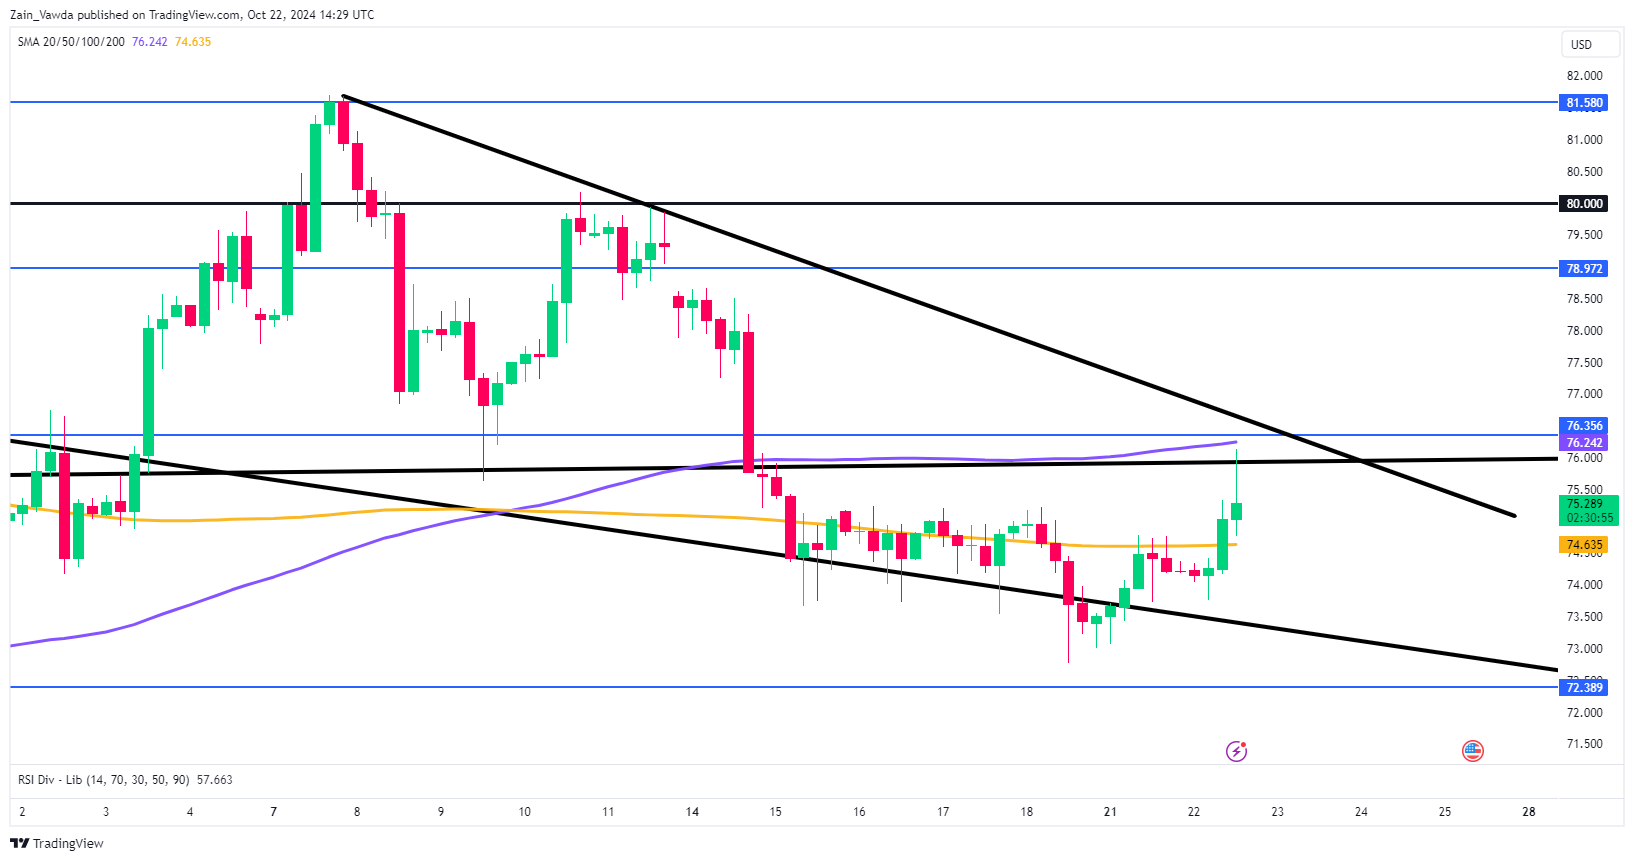
Source: TradingView (click to enlarge)
Support
- 74.63
- 72.38
- 70.00 (key area of confluence)
Resistance
- 76.00
- 78.90
- 80.00
Sunset Market Commentary
Markets
Markets initially followed a similar scenario yesterday. Even as there was little in the way of hard economic news, US and EMU yields tried a next step north. However, this time the move had less momentum. Remarkably, US yields were the first to run into resistance and currently ease between 1 bp (2-y) and 3.3 bps (30-y). Yesterday’s rise in yields probably was mainly driven by growing market concern on fiscal sustainability, especially in case of a Trump victory. At the same time, the Fed is also becoming more sensitive/vocal on the impact of a too loose fiscal stance for its own policy. It should make the Fed more cautious on returning to a neutral level which by the way could be higher than expected. Technical considerations are also in play. The 4.1%-area markets the mid-August/October top for the 2y yield (currently 4.03%). The US 10y yield struggles to hold above 4.17% (50% retracement April/September decline). The German yield curve steepens further (2y -3 bps; 30y + 2 bps). German Bunds continue to underperform against the euro swap curve. This trend isn’t new, but might be an indication of investors looking for a higher fiscal risk premium even on core bonds. The rise in ‘bond’-premia for now only had limited impact on (other) risk assets. Damage on equity markets remains modest (Eurostoxx 50 -0.1%; S&P -0.5%). Oil tries to build a bottoming out process after last week’s setback (Brent currently $74.9/b).
Today’s pause in the (US) yield rally didn’t change fortunes for the dollar. DYX continues its attack on the 104 barrier. After a brief intraday up-tick, EUR/USD relapsed to the 1.081 area. A return to 1.0778 support looks ever more likely. Sterling is also losing some further momentum. UK September government budget data highlighted the fiscal challenge Chancellor Reeves’ budget faces next week. At £16.6bn, PSNB borrowing was marginally lower than expected, but still very high by historical standards. Net borrowing in the April-September period (£79.6bn) was £6.7bn above the March OBR forecast. Government debt-to-GDP remains just below 100% (98.5%). Whatever the reason, EUR/GBP tries to leave the 0.83 support area (currently 0.8345) and this is unlikely due to euro strength.
News & Views
The National Bank of Belgium’s consumer confidence indicator rose slightly in October, from -7 to -5. That brings it back above its long-term average though that doesn’t say a lot. The NBB pointed out that confidence has been oscillating around its historical average since June last year, implying there’s no actual trend developing. That said, the increase in confidence was reflected in all but one component. Households plan to save more and anticipate a strong improvement in their financial situation. The latter rose to the best level in over a year. After worsening last month, consumers were more optimistic again about how they foresee the labour market developing in the next twelve months even though they haven’t changed their assessment on the general economic situation.
The Hungarian central bank (MNB) kept the policy rate unchanged at 6.5%. The second skip this cycle (previously in August) was widely expected after the central bank’s vice-governor Virag last week flagged the possibility of an extended pause. His comments came after the forint since early October was pressured above the psychologically important EUR/HUF 400 barrier again. The central bank noted that “intensification of geopolitical conflicts has led to rises in energy prices and emerging market risk premia” while observing that the external interest rate environment (read: the Fed) may ease more slowly than previously expected. While inflation has more or less evolved in line with the September outlook - with headline expected to rise to 4% by year’s end, core inflation around 5% - the recent developments have increased upside risks. “In the Council’s assessment, re-intensifying geopolitical tensions, volatile financial market developments and the risks to the outlook for inflation warrant a pause in cutting interest rates.” The Hungarian forint’s intraday recovery below EUR/HUF 400 lacked conviction, allowing the pair to return to 400.7 currently. Hungarian swap yields pared an earlier rise with the curve now showing net daily changes between -1.7 and -4 bps. Money markets expectations for the central bank barely changed.
ECB’s Nagel opposes dot plots, calls for enhanced communication tools
ECB Governing Council member Joachim Nagel spoke today, firmly opposing the introduction of dot plots for the Eurosystem, a tool used by Fed to project individual policymakers' rate forecasts.
Nagel argued that such projections could lead to undue pressure on national governors to prioritize their domestic agendas over the broader interests of the 20-nation eurozone.
"This could potentially influence the Governing Council's independence," Nagel warned.
Instead of adopting this approach, Nagel suggested that ECB refine its existing communication strategies. "We should enhance the communication of our existing measures of uncertainty," he said.
Nagel advocated for the development of new tools such as scenario and sensitivity analyses, as well as improved fan charts, to provide clearer guidance without compromising the Governing Council's autonomy.
ECB’s Centeno Calls for Gradual Rate Cuts as Inflation Converges Toward Target
ECB Governing Council member Mario Centeno spoke at an event today, advocating for a measured and consistent approach to reducing interest rates. Centeno emphasized the need for a "gradual, steady, and predictable reduction in interest rates" to their neutral level, which he estimated to be "maybe 2% or slightly lower."
Centeno highlighted that inflation in the Eurozone has slowed significantly and is now converging toward ECB's 2% target. However, he expressed concern that the risk could shift to undershooting the target as inflationary pressures ease.
IMF: Global growth stays stable, US outlook boosted amid European and emerging market struggles
The IMF’s latest World Economic Outlook, released today, paints a picture of stable yet lackluster global growth, with key differences emerging beneath the surface.
The forecast for global growth in 2024 remains unchanged at 3.2%, but the forecast for 2025 has been slightly lowered to 3.2% from the July estimate of 3.3%. While the US saw a notable upgrade in its outlook, the Eurozone and many emerging markets face downward revisions due to a variety of challenges.
In particular, IMF raised its forecast for US growth to 2.8% in 2024, up 0.2% from earlier projections, and further increased 2025 forecast to 2.2%.
On the other hand, the Eurozone has suffered a downgrade, with growth expectations lowered by -0.1% to just 0.8% in 2024, and by -0.3% to 1.2% in 2025.
China's growth forecast for 2024 was lowered slightly by 0.2% to 4.8%, while 2025 remains unchanged at 4.5%.
EUR/USD Mid-Day Outlook
Daily Pivots: (S1) 1.0793; (P) 1.0833; (R1) 1.0854; More...
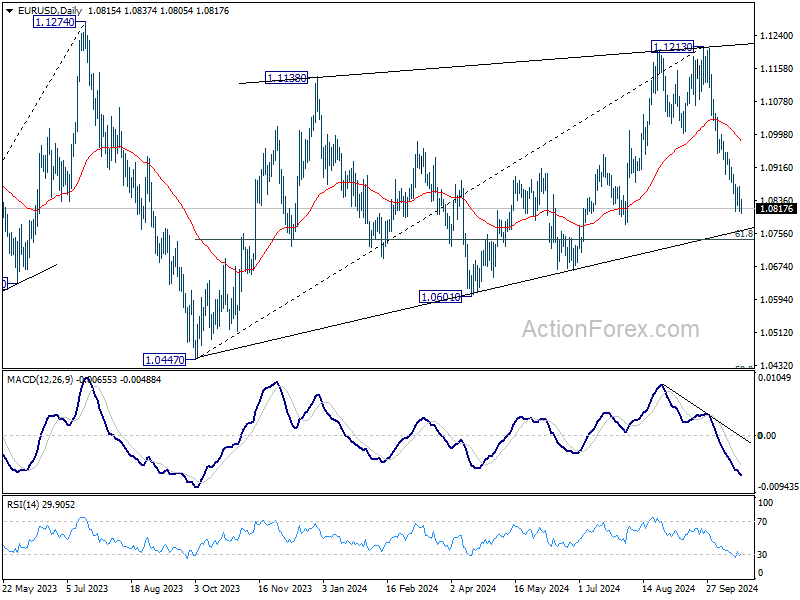
Intraday bias in EUR/USD stays neutral first and consolidations from 1.0810 temporary low could extend. But outlook will remain bearish as long as 1.0954 resistance holds. Below 1.0810 will resume the fall from 1.1213 to 61.8% retracement of 1.0447 to 1.1213 at 1.0740. Firm break there will target 1.0601 support next.
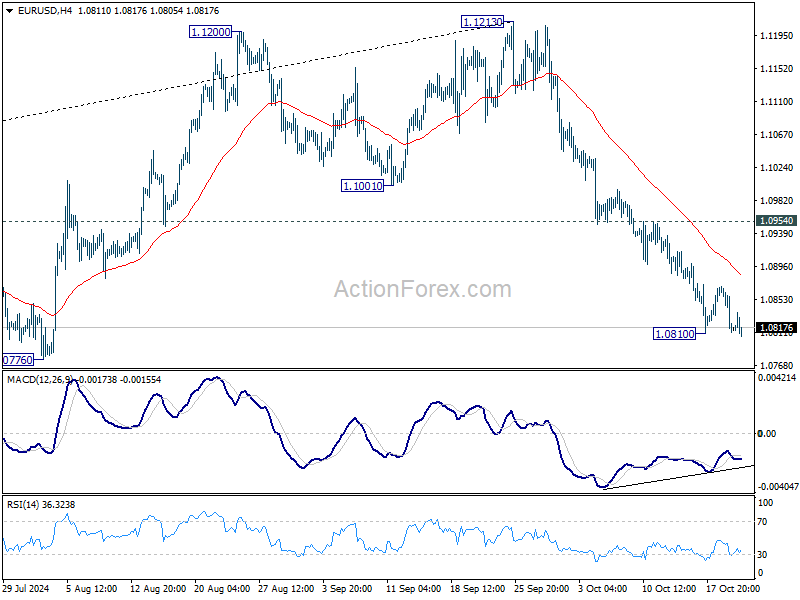
In the bigger picture, price actions from 1.1274 (2023 high) are seen as a consolidation pattern to up trend from 0.9534 (2022 low), with fall from 1.1213 as the third leg. Downside should be contained by 50% retracement of 0.9534 (2022 low) to 1.1274 at 1.0404, to bring up trend resumption at a later stage.
USD/CHF Mid-Day Outlook
Daily Pivots: (S1) 0.8642; (P) 0.8653; (R1) 0.8673; More…
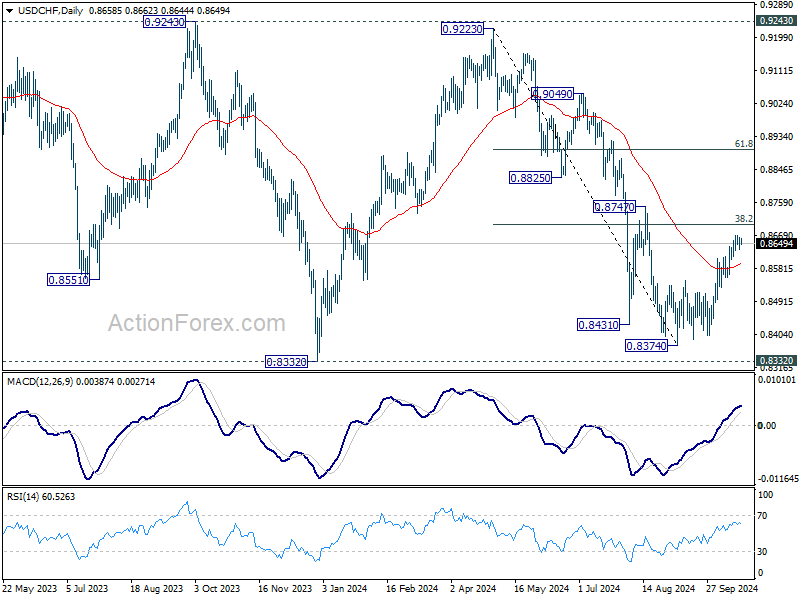
Intraday bias in USD/CHF remains neutral as consolidations continues below 0.8668 temporary top. Further rally is expected as long as 0.8548 resistance turned support holds. Above 0.8668 will target 38.2% retracement of 0.9223 to 0.8374 at 0.8698. Sustained break there will argue that fall from 0.9223 has completed at 0.8374, after defending 0.8332 low. Further rally should then be seen to 61.8% retracement at 0.8899 next.
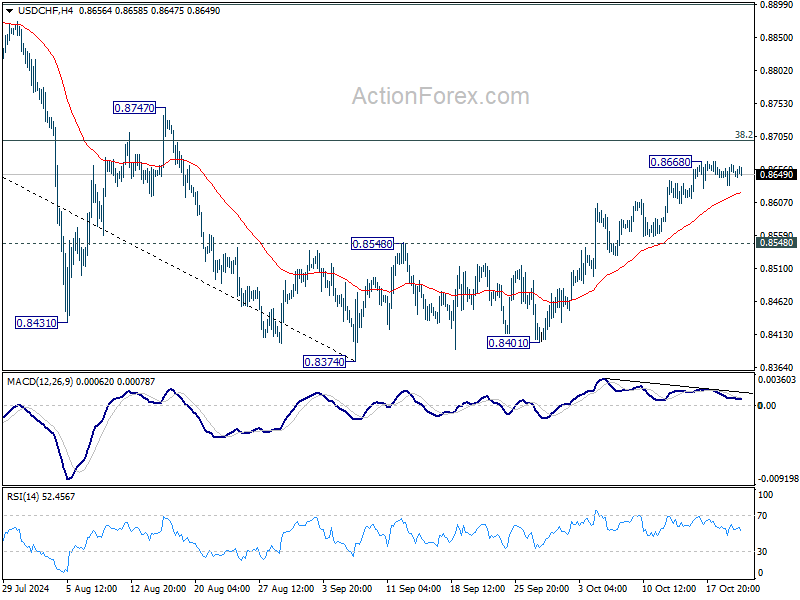
In the bigger picture, price actions from 0.8332 (2023 low) are currently seen as a medium term corrective pattern, with fall from 0.9223 as the second leg. Strong support could be seen from 0.8332 to bring rebound. Yet, overall outlook will continue to stay bearish as long as 0.9243 resistance holds. Firm break of 0.8332, however, will resume larger down trend from 1.0146 (2022 high).
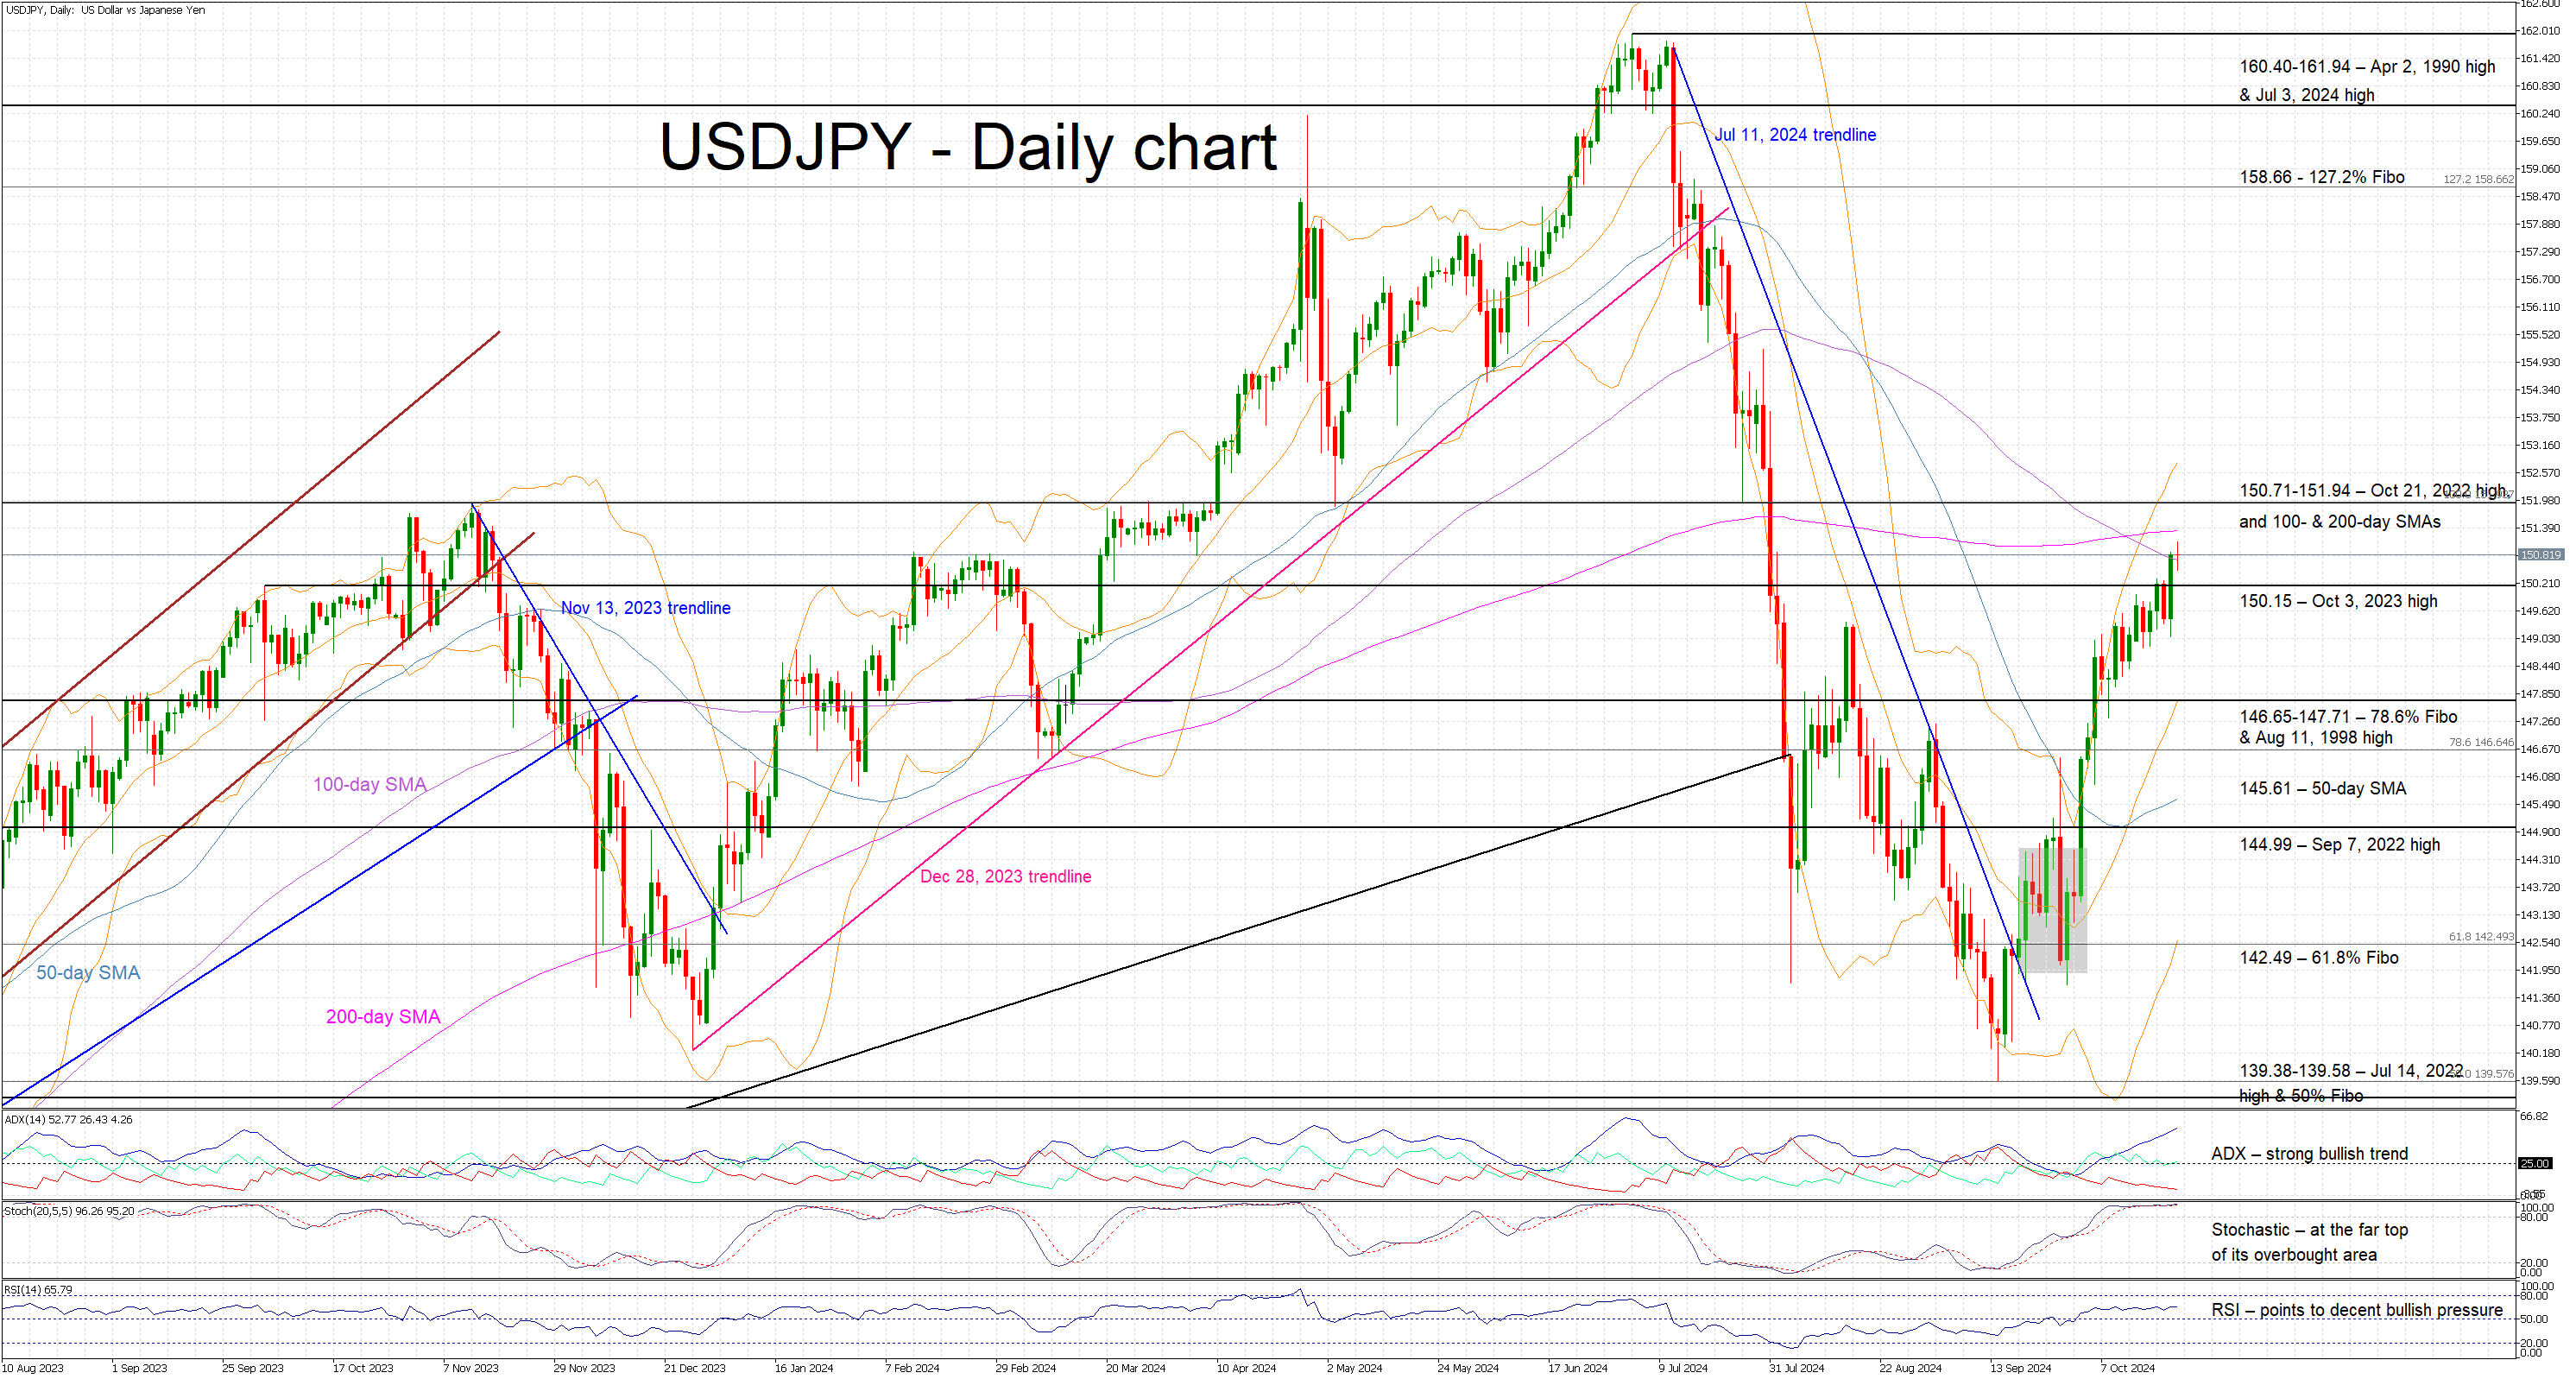
USD/JPY Mid-Day Outlook
Daily Pivots: (S1) 149.66; (P) 150.27; (R1) 151.46; More...
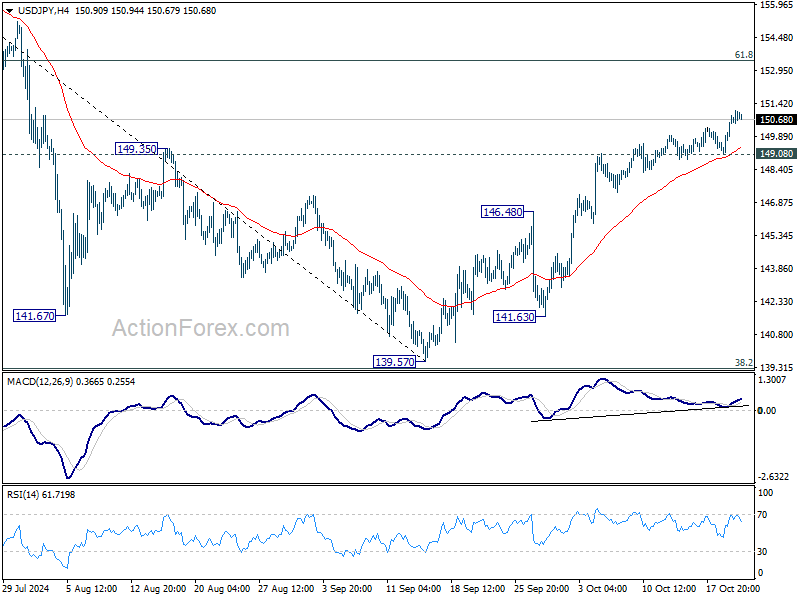
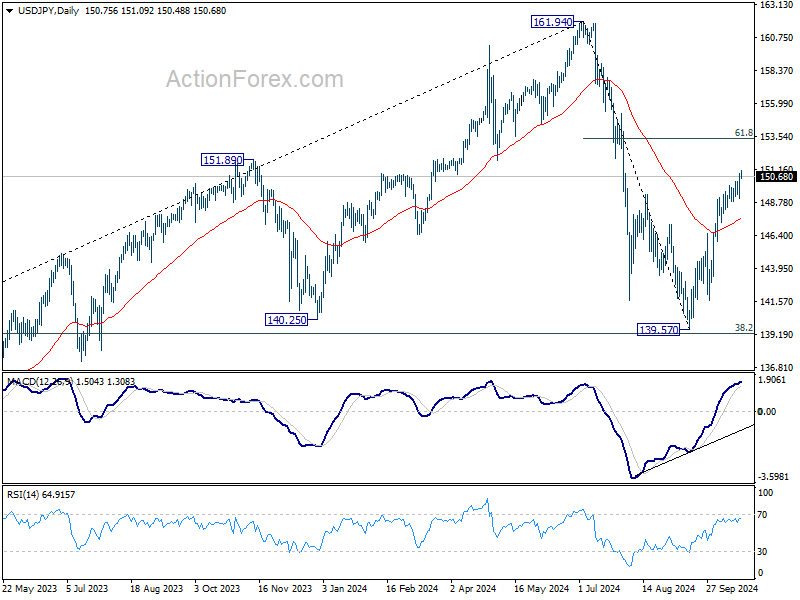
Intraday bias in USD/JPY remains on the upside, as rise from 139.57 is in progress. Next target is 61.8% retracement of 161.94 to 139.57 at 153.39. On the downside, below 149.08 minor support will turn intraday bias neutral again. But still, further rally is in favor as long as 146.48 resistance turned support holds, in case of retreat.
In the bigger picture, price actions from 161.94 are seen as a corrective pattern to rise from 102.58 (2021 low). The range of medium term consolidation should now be set between 38.2% retracement of 102.58 to 161.94 at 139.26 and 161.94. Nevertheless, sustained break of 139.26 would open up deeper medium term decline to 61.8% retracement at 125.25.
Sterling’s Decline Deepens as Dollar Maintains Strength
Sterling weakened broadly in a subdued trading today, with no significant data releases to drive market activity. Investors are awaiting BoE Governor Andrew Bailey's upcoming speech, where he might reaffirm a dovish tone. Earlier this month, in an interview with The Guardian, Bailey hinted at the possibility of becoming “a bit more activist” and cutting interest rates more aggressively if inflationary pressures continue to ease. The lower-than-expected UK CPI reading in September has lent weight to his stance. However, hawkish members within the BoE may push back on aggressive cuts if this week’s PMI data show persistent strength in the economy.
In the broader forex market, Dollar continues to lead as the strongest performer this week so far, buoyed by the surge in US Treasury yields. Swiss Franc follows behind, while Canadian Dollar is awaiting tomorrow’s BoC rate cut decision. Meanwhile, Japanese Yen remains the weakest currency, although selling pressure has not gained significant momentum. Sterling is the second weakest, ahead of Euro. Australian and New Zealand Dollars are trading in the middle.
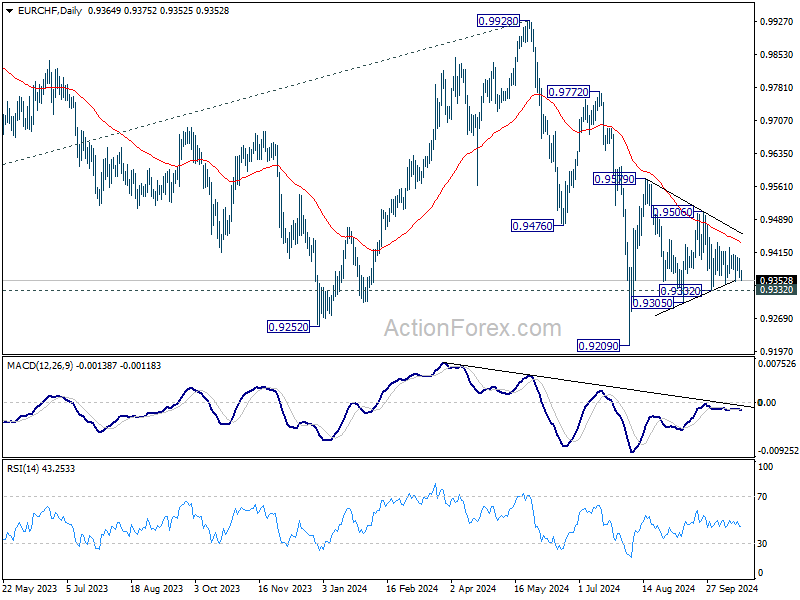
Technically, if Sterling's decline deepens, attention will also turn to whether Euro follows suit. Specifically, EUR/CHF is a pair to watch. Break of 0.9332 support would extend the fall from 0.9506 towards 0.9305. Given the prior rejection by the 55 D EMA, EUR/CHF could also be on track for a retest of the 0.9209 low or even resumption of its long-term downtrend. Much of this could hinge on Thursday’s Eurozone PMI data.
In Europe, at the time of writing, FTSE is down -053%. DAX is down -0.28%. CAC is down -0.42%. UK 10-year yield is down -0.0143 at 4.130. Germany 10-year yield is up 0.017 at 2.307. Earlier in Asia, Nikkei fell -1.39%. Hong Kong HSI rose 0.10%. China Shanghai SSE rose 0.54%. Singapore Strait Times fell -0.75%. Japan 10-year JGB yield rose 0.0181 to 0.980.
New Zealand's exports rise 5.2% yoy in Sep, imports fall -0.9% yoy
New Zealand's trade balance in September 2024 showed a deficit of NZD -2.1B. Goods exports rose by NZD 246m, or 5.2% yoy, reaching NZD 5.0B. Meanwhile, goods imports fell by NZD -67m, or -0.9% yoy, to NZD 7.1B.
Export data showed mixed performance across key trading partners. Exports to China dropped significantly by NZD -109m (-8.8%), and Japan saw a decline of NZD -22m (-8.2%). Exports to Australia also fell NZD -7m or -0.9%. However, exports to the EUR surged by NZD 183m (67%), while exports to the US also increased by NZD 11m (1.9%).
On the import side, the decline was driven by a significant drop in imports from China, down by NZD -158m (-9.8%). Imports from the US surged, rising NZD 330m (51%), while imports from Australia and the EU saw marginal gains of 0.9% and 1.1% respectively. South Korea’s imports fell by NZD -45m (7.3%).
GBP/USD Mid-Day Outlook
Daily Pivots: (S1) 1.2955; (P) 1.3007; (R1) 1.3036; More...
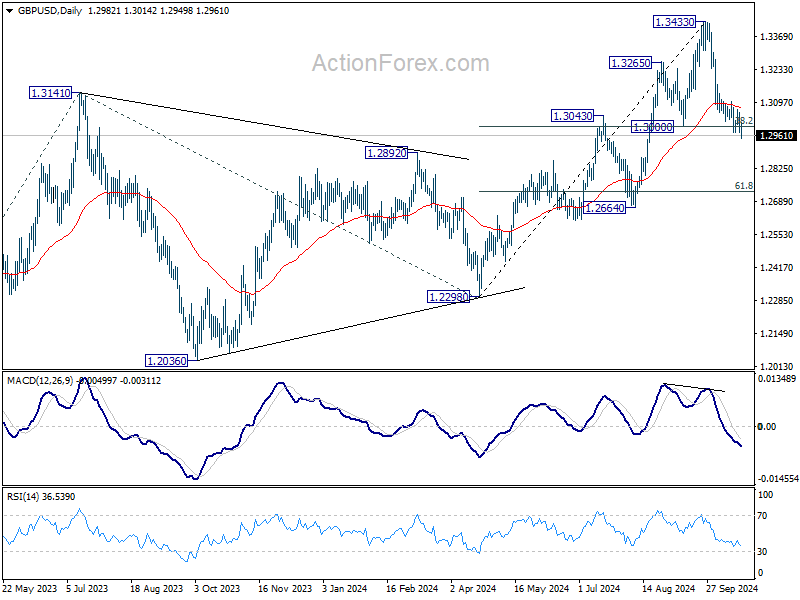
GBP/USD's fall 1.3433 resumed by breaking 1.2973 temporary low and intraday bias is back on the downside. Sustained trading below 1.3000 cluster support (38.2% retracement of 1.2298 to 1.3433 at 1.2999) will argue that whole rise from 1.2298 has completed and bring deeper fall to 61.8% retracement at 1.2732. On the upside, break of 1.3070 minor resistance will turn bias back to the upside for stronger rebound.
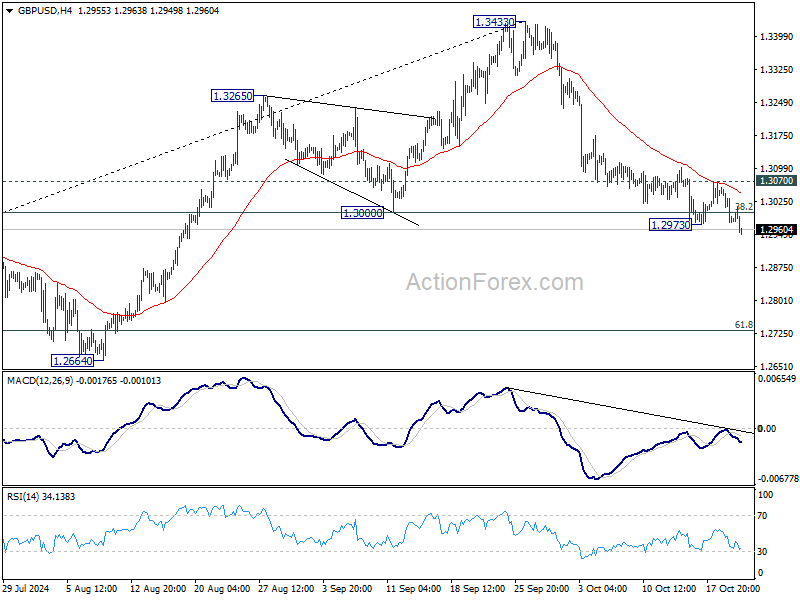
In the bigger picture, considering mildly bearish divergence condition in D MACD, decisive break of 1.3000 support will suggest that a medium term top is already formed at 1.3433. Price actions from there would be tentatively seen as correcting the up trend from 1.0351 (2022 low). In this case, deeper fall would be seen to 1.2298 structural support, strong support should be seen there to bring rebound.