Sample Category Title
USD/CHF Daily Outlook
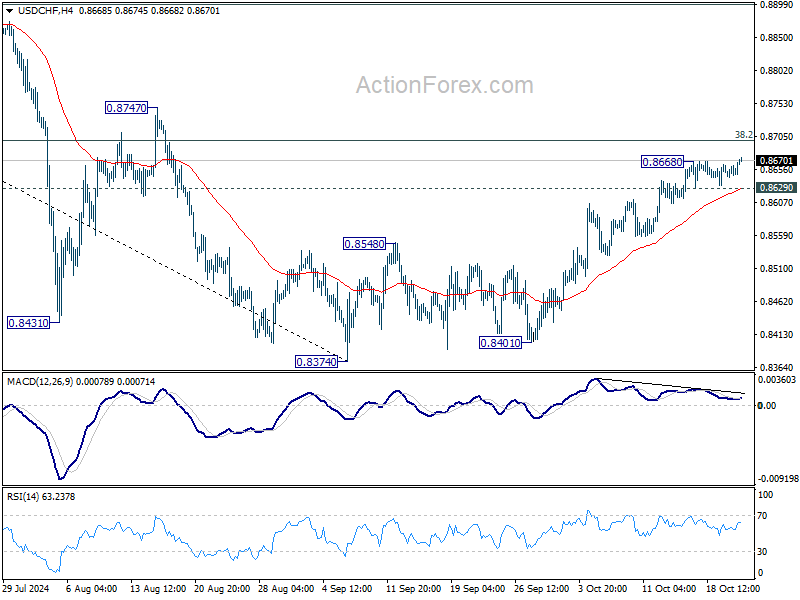
Daily Pivots: (S1) 0.8639; (P) 0.8654; (R1) 0.8667; More…
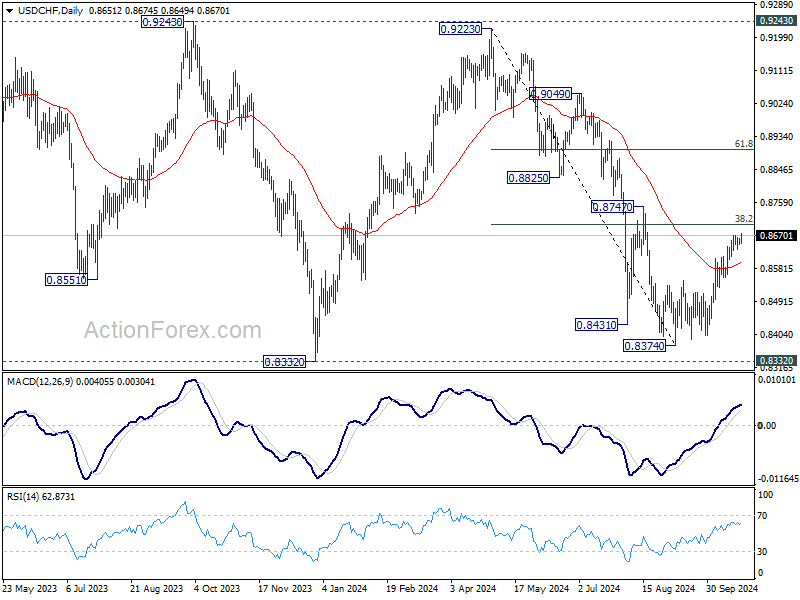
Intraday bias in USD/CHF is back on the upside with break of 0.8668 temporary top. Rise from 0.8374 is resuming for 38.2% retracement of 0.9223 to 0.8374 at 0.8698. Sustained break there will argue that fall from 0.9223 has completed at 0.8374, after defending 0.8332 low. Further rally should then be seen to 61.8% retracement at 0.8899 next. On the downside, below 0.8629 minor support will turn intraday bias neutral again.
In the bigger picture, price actions from 0.8332 (2023 low) are currently seen as a medium term corrective pattern, with fall from 0.9223 as the second leg. Strong support could be seen from 0.8332 to bring rebound. Yet, overall outlook will continue to stay bearish as long as 0.9243 resistance holds. Firm break of 0.8332, however, will resume larger down trend from 1.0146 (2022 high).
USD/JPY Daily Outlook
Daily Pivots: (S1) 150.66; (P) 150.93; (R1) 151.36; More...
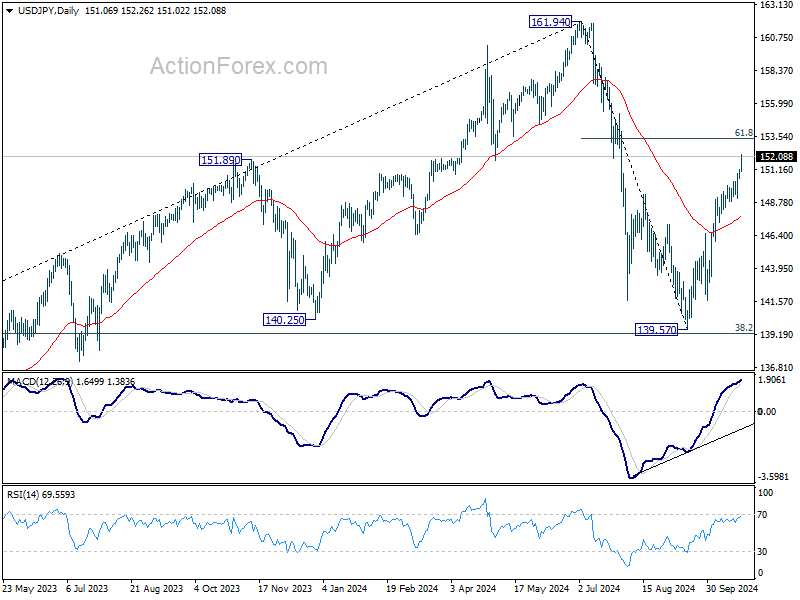
USD/JPY's rally from 139.57 accelerates higher today, and intraday bias stays on the upside for 61.8% retracement of 161.94 to 139.57 at 153.39. Decisive break there will pave the way to retest 161.94 high. On the downside, below 150.60 minor support will turn intraday bias neutral first. But further rally will now remain in favor as long as 55 D EMA (now at 147.85) holds, in case of retreat.
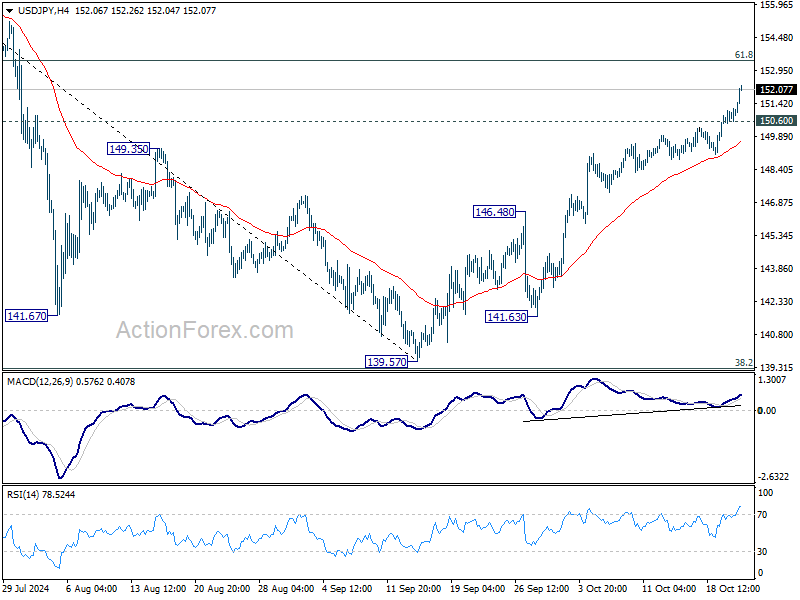
In the bigger picture, price actions from 161.94 are seen as a corrective pattern to rise from 102.58 (2021 low). The range of medium term consolidation should be set between 38.2% retracement of 102.58 to 161.94 at 139.26 and 161.94. Nevertheless, sustained break of 139.26 would open up deeper medium term decline to 61.8% retracement at 125.25.
Yen Weakens Further as Japan Remains Silent
Japanese Yen's broad selloff intensified during the quiet Asian trading session today, with the currency continuing to weaken against major counterparts. A key factor behind Yen's decline is the ongoing surge in US and European bond yields, which diminishes the appeal of the low-yielding Yen. More striking, however, is the apparent silence from Japanese authorities, offering no verbal intervention even as USD/JPY surpassed the 152 mark. This lack of official response raises speculation that Yen could depreciate further. The next psychological support for USD/JPY is 155, and if Japan maintains its silence at that level, there is a real possibility of the pair revisiting 160, especially with the US 10-year continuing its climb toward 5%.
In the broader currency markets, Dollar remains firmly in control, holding its position as the strongest currency for the week. Canadian Dollar is also performing well, though it remains susceptible to a dovish surprise from BoC rate decision today. Swiss Franc rounds out the top three strongest performers. Meanwhile, Euro is lagging behind, sitting just above Yen as the second-weakest currency, awaiting possible support from tomorrow's PMI releases to reverse its fortunes. Sterling is also under pressure, while the Australian and New Zealand Dollars are trading in the middle of the pack.
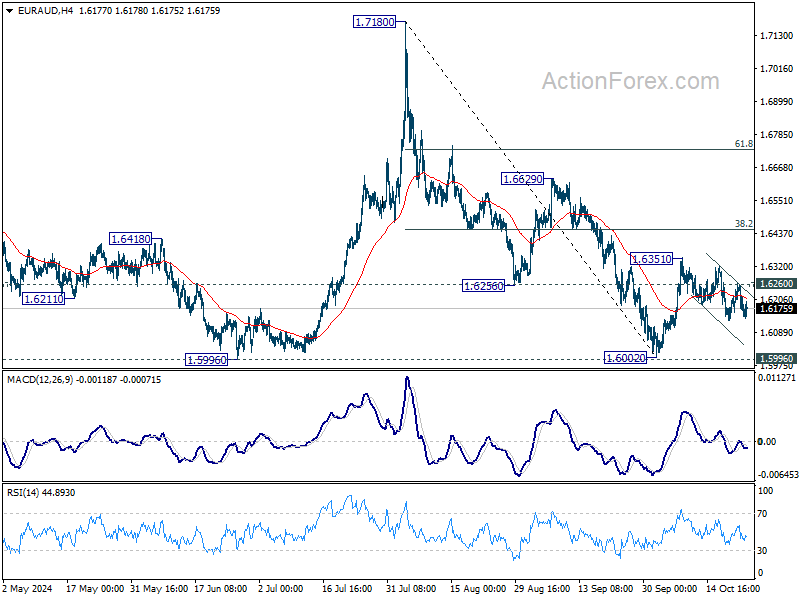
Technically, momentum EUR/AUD's decline from 1.6351 has so far been very unconvincing while the structural is corrective looking. A break above 1.6260 minor resistance will now suggest that this pullback has completed, and revive that case that whole fall from 1.7180 has completed at 1.6002 after defending 1.5996 key support. In the case, stronger rise should seen through 1.6351 resistance next. Considering that EUR/USD does not seem poised for a significant turnaround yet, extended rebound in EUR/AUD could be accompanied by accelerated selloff in AUD/USD.
In Asia, at the time of writing, Nikkei is down -0.78%. Hong Kong HSI is up 1.99%. China Shanghai SSE is up 1.06%. Singapore Strait Times is up 0.52%. Japan 10-year JGB yield is up 0.0040 at 0.984. Overnight, DOW fell -0.02%. S&P 500 fell -0.05%. NASDAQ rose 0.18%. 10-year yield rose 0.022 to 4.204.
ECB's Villeroy emphasizes agile pragmatism" on reducing restrictive policy
In a lecture delivered overnight, ECB Governing Council member Francois Villeroy de Galhau stressed the importance of maintaining "agile pragmatism" in adjusting the current restrictive monetary policy.
He emphasized that the risk of reducing the ECB's restrictive stance too late "could indeed become more significant" to the risks of acting prematurely.
Villeroy noted the "risk that inflation undershoots, especially if growth remains subpar".
He further added, "If we are next year sustainably at 2% inflation, and with still a sluggish growth outlook in Europe, there won't be any reasons for our monetary policy to remain restrictive, and for our rates to be above the neutral rate of interest."
ECB's Rehn: Danger of inflation undershooting not yet verified
ECB Governing Council member Olli Rehn commented that disinflation process in the Eurozone is "well on track." He acknowledged, however, that the economic growth outlook has "weakened quite clearly" over the past few months, which could "increase disinflationary pressures" moving forward.
Despite these developments, Rehn expressed that he is "not yet so concerned" about an undershoot in inflation, noting that both services inflation and wage inflation are still above the ECB’s 2% target. He added that the "danger of undershooting is not yet verified".
Rehn also emphasized that the pace and extent of future rate cuts would depend on multiple factors, including "the inflation outlook, the dynamics of underlying inflation, and the strength of monetary policy transmission." This reflects the ECB's continued data-dependent approach to future monetary policy decisions.
Fed's Daly: Soft landing in sight, but job not done yet
San Francisco Fed President Mary Daly expressed optimism in a series of Twitter posts, noting that the US economy is in a much "better place" compared to two years ago.
She highlighted that "inflation has fallen substantially" and the labor market has stabilized on a "more sustainable path." According to Daly, the risks to the Fed's dual goals of stable prices and full employment are now "balanced."
However, Daly made it clear that Fed's work to achieve a soft landing for the economy is not "not fully done". She emphasized the importance of staying "resolute" to finish the task of stabilizing the economy, stating that the ultimate goal is to create an environment where people "aren’t worried about inflation or the economy."
BoC to Slash Rates by 50bps, USD/CAD Rally Could Stall Below 1.4 Level
BoC is widely anticipated to lower its policy rate by 50bps to 3.75% today, marking the fourth consecutive rate cut. The central bank is stepping up its monetary easing, as policymakers are increasingly worried that the current high level of interest rates is causing additional economic pain.
Recent economic indicators support the case for the more aggressive adjustment. Unemployment rate surged to a seven-year high (excluding the pandemic period) of 6.6% in August before dipping slightly to 6.5% in September. Even at 6.5%, unemployment remains a full percentage point higher than a year earlier. Additionally, per capita GDP has contracted for five consecutive quarters. With inflation falling more rapidly to 1.6% in September, the BoC has room to act swiftly.
The key question now is the pace of future policy easing. There are firm expectations that the interest rate will fall to a neutral range between 2.25% and 3.25% by the end of next year. Among major financial institutions, Scotiabank is forecasting a more conservative year-end policy rate of 3.00%, while National Bank and RBC anticipate a more aggressive path to 2.00% by the end of 2025. These projections will likely be reassessed based on BoC's new economic forecasts released today.
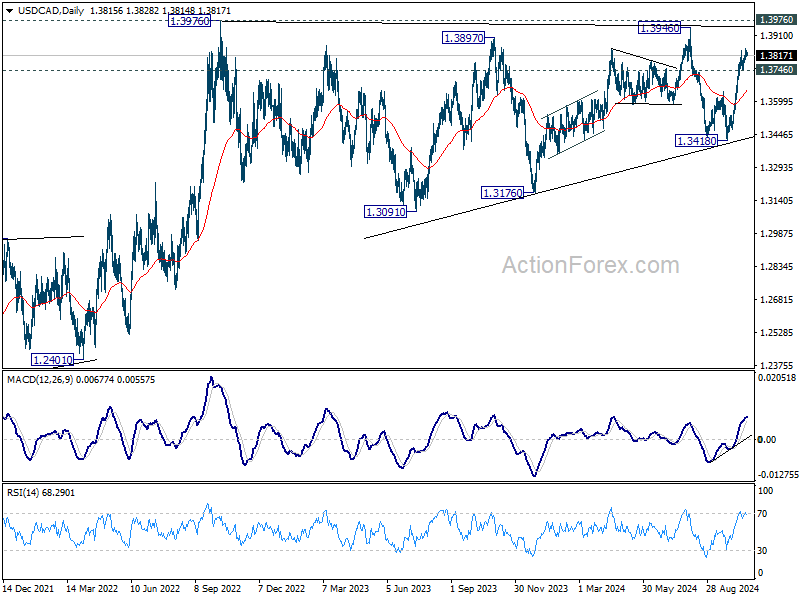
Technically, USD/CAD's near term rally from 1.3418 is in progress for 1.3946/76 resistance zone. However, for now, it's certain whether the medium term consolidation pattern from 1.3976 (2022 high) has completed as a triangle at 1.3418. So, strong resistance might be seen from 1.3976 to limit upside again. USD/CAD would likely need a more pronounced divergence in monetary policy between Fed and BoC to break decisively above 1.3976.
USD/JPY Daily Outlook
Daily Pivots: (S1) 150.66; (P) 150.93; (R1) 151.36; More...
USD/JPY's rally from 139.57 accelerates higher today, and intraday bias stays on the upside for 61.8% retracement of 161.94 to 139.57 at 153.39. Decisive break there will pave the way to retest 161.94 high. On the downside, below 150.60 minor support will turn intraday bias neutral first. But further rally will now remain in favor as long as 55 D EMA (now at 147.85) holds, in case of retreat.
In the bigger picture, price actions from 161.94 are seen as a corrective pattern to rise from 102.58 (2021 low). The range of medium term consolidation should be set between 38.2% retracement of 102.58 to 161.94 at 139.26 and 161.94. Nevertheless, sustained break of 139.26 would open up deeper medium term decline to 61.8% retracement at 125.25.
GBP/USD Extends Losses: Can The Pair Find Support Soon?
Key Highlights
- GBP/USD started a fresh decline below the 1.3120 support.
- A connecting bearish trend line is forming with resistance at 1.3025 on the 4-hour chart.
- Gold prices rallied to a new all-time high above $2,740.
- EUR/USD declined further and traded below 1.0820.
GBP/USD Technical Analysis
The British Pound started a fresh decline below the 1.3120 level against the US Dollar. GBP/USD traded below 1.3050 to move into a bearish zone.
Looking at the 4-hour chart, the pair settled below the 1.3050 pivot level, the 100 simple moving average (red, 4-hour), and the 200 simple moving average (green, 4-hour). The pair even tested the 1.2950 level and currently consolidating losses.
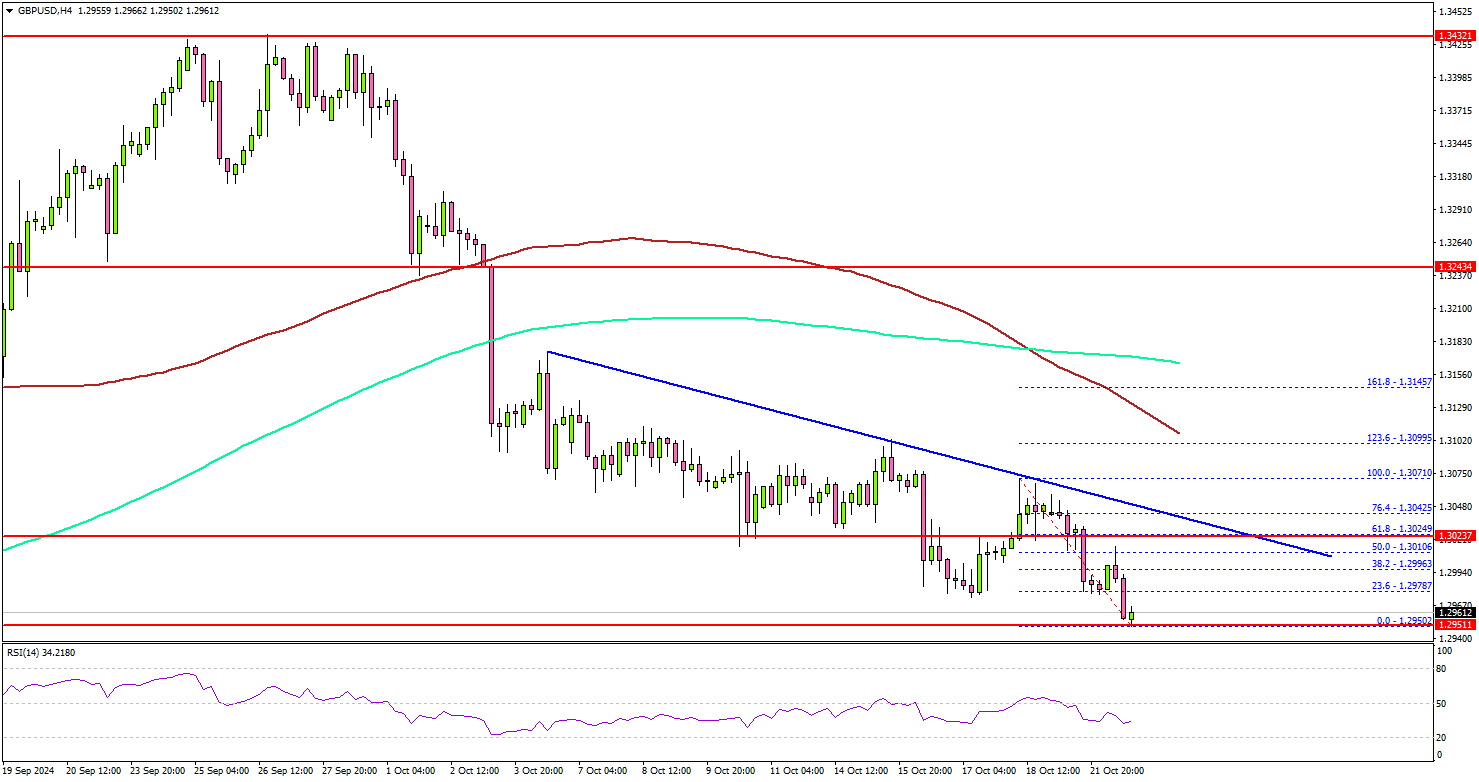
On the upside, the bears might be active near the 1.2985 level. The first key resistance is near the 1.3000 handle. There is also a connecting bearish trend line forming with resistance at 1.3025 on the same chart.
A close above the 1.3025 level could set the tone for another increase. The next major resistance could be 1.3050, above which the price could accelerate higher toward the 1.3120 level.
On the downside, immediate support sits near the 1.2950 level. The next key support sits near the 1.2840 level. Any more losses could send the pair toward the 1.2750 level.
Looking at Gold, the bulls remained in action and were able to push the price to a new all-time high above $2,740.
Upcoming Economic Events:
- Fed's Beige Book.
- BoC Interest Rate Decision – Forecast 3.75%, versus 4.25% previous.
BoC to Slash Rates by 50bps, USD/CAD Rally Could Stall Below 1.4 Level
BoC is widely anticipated to lower its policy rate by 50bps to 3.75% today, marking the fourth consecutive rate cut. The central bank is stepping up its monetary easing, as policymakers are increasingly worried that the current high level of interest rates is causing additional economic pain.
Recent economic indicators support the case for the more aggressive adjustment. Unemployment rate surged to a seven-year high (excluding the pandemic period) of 6.6% in August before dipping slightly to 6.5% in September. Even at 6.5%, unemployment remains a full percentage point higher than a year earlier. Additionally, per capita GDP has contracted for five consecutive quarters. With inflation falling more rapidly to 1.6% in September, the BoC has room to act swiftly.
The key question now is the pace of future policy easing. There are firm expectations that the interest rate will fall to a neutral range between 2.25% and 3.25% by the end of next year. Among major financial institutions, Scotiabank is forecasting a more conservative year-end policy rate of 3.00%, while National Bank and RBC anticipate a more aggressive path to 2.00% by the end of 2025. These projections will likely be reassessed based on BoC's new economic forecasts released today.
Technically, USD/CAD's near term rally from 1.3418 is in progress for 1.3946/76 resistance zone. However, for now, it's certain whether the medium term consolidation pattern from 1.3976 (2022 high) has completed as a triangle at 1.3418. So, strong resistance might be seen from 1.3976 to limit upside again. USD/CAD would likely need a more pronounced divergence in monetary policy between Fed and BoC to break decisively above 1.3976.
Fed’s Daly: Soft landing in sight, but job not done yet
San Francisco Fed President Mary Daly expressed optimism in a series of Twitter posts, noting that the US economy is in a much "better place" compared to two years ago.
She highlighted that "inflation has fallen substantially" and the labor market has stabilized on a "more sustainable path." According to Daly, the risks to the Fed's dual goals of stable prices and full employment are now "balanced."
However, Daly made it clear that Fed's work to achieve a soft landing for the economy is not "not fully done". She emphasized the importance of staying "resolute" to finish the task of stabilizing the economy, stating that the ultimate goal is to create an environment where people "aren’t worried about inflation or the economy."
ECB’s Rehn: Danger of inflation undershooting not yet verified
ECB Governing Council member Olli Rehn commented that disinflation process in the Eurozone is "well on track." He acknowledged, however, that the economic growth outlook has "weakened quite clearly" over the past few months, which could "increase disinflationary pressures" moving forward.
Despite these developments, Rehn expressed that he is "not yet so concerned" about an undershoot in inflation, noting that both services inflation and wage inflation are still above the ECB’s 2% target. He added that the "danger of undershooting is not yet verified".
Rehn also emphasized that the pace and extent of future rate cuts would depend on multiple factors, including "the inflation outlook, the dynamics of underlying inflation, and the strength of monetary policy transmission." This reflects the ECB's continued data-dependent approach to future monetary policy decisions.
ECB’s Villeroy emphasizes agile pragmatism” on reducing restrictive policy
In a lecture delivered overnight, ECB Governing Council member Francois Villeroy de Galhau stressed the importance of maintaining "agile pragmatism" in adjusting the current restrictive monetary policy.
He emphasized that the risk of reducing the ECB's restrictive stance too late "could indeed become more significant" to the risks of acting prematurely.
Villeroy noted the "risk that inflation undershoots, especially if growth remains subpar".
He further added, "If we are next year sustainably at 2% inflation, and with still a sluggish growth outlook in Europe, there won't be any reasons for our monetary policy to remain restrictive, and for our rates to be above the neutral rate of interest."
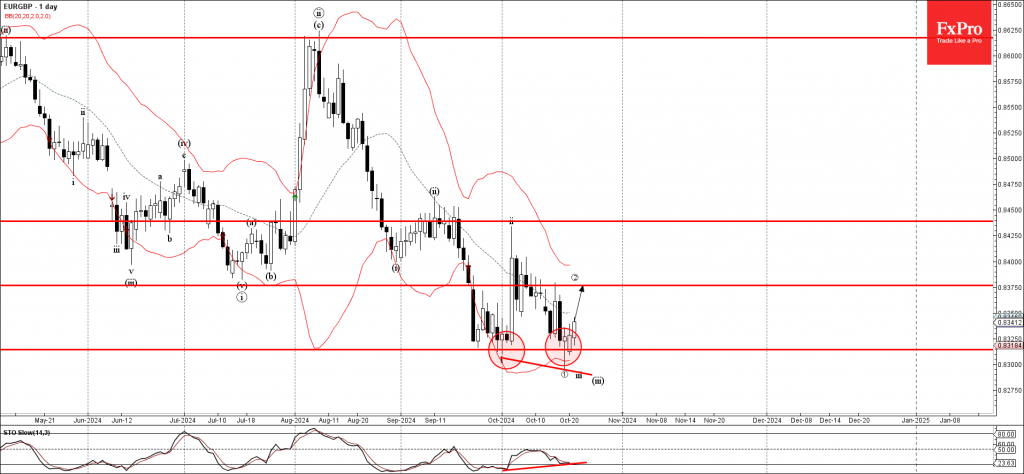
EURGBP Wave Analysis
- EURGBP reversed from key support level 0.8315
- Likely to rise to resistance level 0.8375
EURGBP currency pair recently reversed up from the key support level 0.8315 (which reversed the pair multiple times in September) standing close to the lower daily Bollinger Band.
The upward reversal from the support level 0.8315 created the daily Japanese candlesticks reversal pattern Hammer Doji.
Given the strength of the support level 0.8315 and the bullish divergence on the daily Stochastic indicator, EURGBP currency pair can be expected to rise toward the next resistance level 0.8375, which reversed the pair earlier this month.
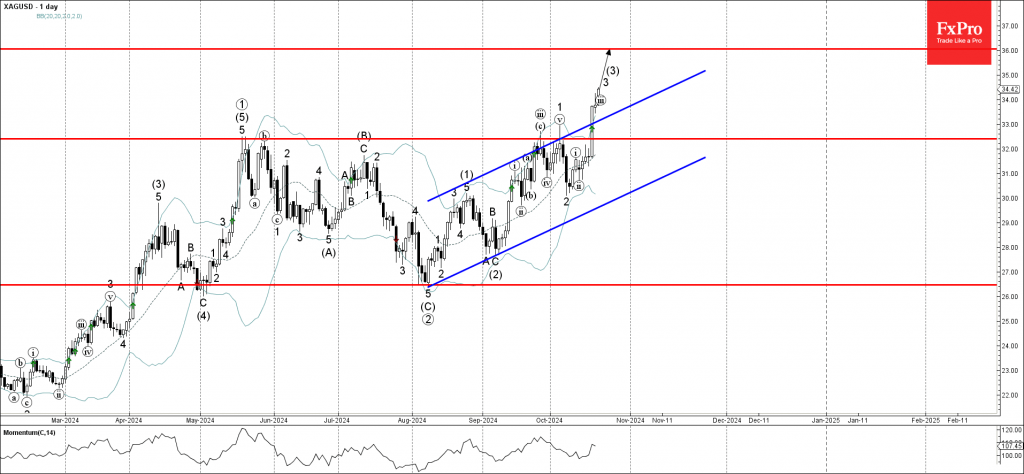
Silver Wave Analysis
- Silver under bullish pressure
- Likely to rise to resistance level 36.00
Silver is under bullish pressure after the earlier breakout of the resistance level 32.40 (which has been steadily reversing the price from the middle of May) intersecting with the resistance trendline of the daily up channel from the start of August.
The breakout of the resistance level 32.40 accelerated the active short-term impulse wave 3 of the higher impulse wave (3) from the start of September.
Given the clear daily uptrend, Silver can be expected to rise toward the next resistance level 36.00, the target price for the completion of the active impulse wave (3).