Sample Category Title
BoC cuts rates by 50bps, signals further reductions ahead
BoC cut its overnight rate target by 50 bps to 3.75%, as widely expected, with inflation now "back around the 2% target." The central bank reaffirmed its easing bias, stating that if the economy continues to evolve as expected, "further reductions" in the policy rate can be expected. However, it stressed that rate adjustments will be made on a "one meeting at a time" basis.
BoC adjusted its inflation forecasts slightly lower, reducing the average CPI inflation projection from 2.6% to 2.5% for 2024, and from 2.4% to 2.2% for 2025, while maintaining the 2.0% target for 2026.
Recent data shows that headline inflation has dropped from 2.7% in June to 1.6% in September, aided by lower shelter costs, a decline in global oil prices, and consequently, lower gasoline prices. BoC's preferred core inflation measures are now below 2.5%, and inflation expectations from businesses and consumers have "largely normalized."
On the growth front, GDP projections remained mostly unchanged, with forecasts of 1.2% for 2024, 2.1% for 2025, and a slight downgrade from 2.4% to 2.3% in 2026. BoC expects growth to pick up gradually as interest rates decline, with stronger consumer spending, rising residential investment, and resilient export demand, particularly from the US, all contributing to the recovery.
(BOC) Bank of Canada reduces policy rate by 50 basis points to 3¾%
The Bank of Canada today reduced its target for the overnight rate to 3¾%, with the Bank Rate at 4% and the deposit rate at 3¾%. The Bank is continuing its policy of balance sheet normalization.
The Bank continues to expect the global economy to expand at a rate of about 3% over the next two years. Growth in the United States is now expected to be stronger than previously forecast while the outlook for China remains subdued. Growth in the euro area has been soft but should recover modestly next year. Inflation in advanced economies has declined in recent months, and is now around central bank targets. Global financial conditions have eased since July, in part because of market expectations of lower policy interest rates. Global oil prices are about $10 lower than assumed in the July Monetary Policy Report (MPR).
In Canada, the economy grew at around 2% in the first half of the year and we expect growth of 1¾% in the second half. Consumption has continued to grow but is declining on a per person basis. Exports have been boosted by the opening of the Trans Mountain Expansion pipeline. The labour market remains soft—the unemployment rate was at 6.5% in September. Population growth has continued to expand the labour force while hiring has been modest. This has particularly affected young people and newcomers to Canada. Wage growth remains elevated relative to productivity growth. Overall, the economy continues to be in excess supply.
GDP growth is forecast to strengthen gradually over the projection horizon, supported by lower interest rates. This forecast largely reflects the net effect of a gradual pick up in consumer spending per person and slower population growth. Residential investment growth is also projected to rise as strong demand for housing lifts sales and spending on renovations. Business investment is expected to strengthen as demand picks up, and exports should remain strong, supported by robust demand from the United States.
Overall, the Bank forecasts GDP growth of 1.2% in 2024, 2.1% in 2025, and 2.3% in 2026. As the economy strengthens, excess supply is gradually absorbed.
CPI inflation has declined significantly from 2.7% in June to 1.6% in September. Inflation in shelter costs remains elevated but has begun to ease. Excess supply elsewhere in the economy has reduced inflation in the prices of many goods and services. The drop in global oil prices has led to lower gasoline prices. These factors have all combined to bring inflation down. The Bank’s preferred measures of core inflation are now below 2½%. With inflationary pressures no longer broad-based, business and consumer inflation expectations have largely normalized.
The Bank expects inflation to remain close to the target over the projection horizon, with the upward and downward pressures on inflation roughly balancing out. The upward pressure from shelter and other services gradually diminishes, and the downward pressure on inflation recedes as excess supply in the economy is absorbed.
With inflation now back around the 2% target, Governing Council decided to reduce the policy rate by 50 basis points to support economic growth and keep inflation close to the middle of the 1% to 3% range. If the economy evolves broadly in line with our latest forecast, we expect to reduce the policy rate further. However, the timing and pace of further reductions in the policy rate will be guided by incoming information and our assessment of its implications for the inflation outlook. We will take decisions one meeting at a time. The Bank is committed to maintaining price stability for Canadians by keeping inflation close to the 2% target.
Information note
The next scheduled date for announcing the overnight rate target is December 11, 2024. The Bank will publish its next full outlook for the economy and inflation, including risks to the projection, in the MPR on January 29, 2025.
AUD/CAD Technical: BoC Jumbo Cut of 50 bps May Have Already Been Fully Priced In
- The Canadian dollar has weakened against most major currencies (except against the JPY) in the past four weeks.
- Short-term FX positioning suggests that the expected BoC’s 50 bps cut may have been fully priced in.
- Watch out for a potential short-term mean reversion decline in the AUD/CAD cross pair.
In a few hours’ time today, the Bank of Canada (BoC) will announce its latest monetary policy decision where the consensus is expecting a fourth consecutive interest rate cut to its key policy interest rate with a higher magnitude of 50 basis points (bps) to bring it down to 3.75%.
The rationale for having a high expectation of a jumbo cut of 50 bps assigned to today’s BoC interest rate decision is that the inflationary trend in Canada has decelerated below the 2% inflation target.
Canada’s core inflation rate ticked slightly higher to 1.6% y/y in September from a three-and-a-half-year low of 1.5% recorded in August but remained below BoC’s 2% target since April this year.
Slack in the labour market warrants a more dovish BoC
Coupled with a weakening labour market where the unemployment rate increased to a 34-month high of 6.6% in August, albeit a slight downtick to 6.5% in September, it is no longer economically viable for BoC to maintain a higher degree of restrictive monetary policy as the current key policy interest rate of 4.25% is significantly higher by 265 bps from the core inflation rate in Canada.
However, markets are forward-looking as the Canadian dollar has weakened against the major currencies except against the Japanese yen in the past four weeks which suggests that today’s 50 bps cut from BoC may have been fully priced in.
A mean reversion move to offset recent Canadian dollar weakness may be in progress
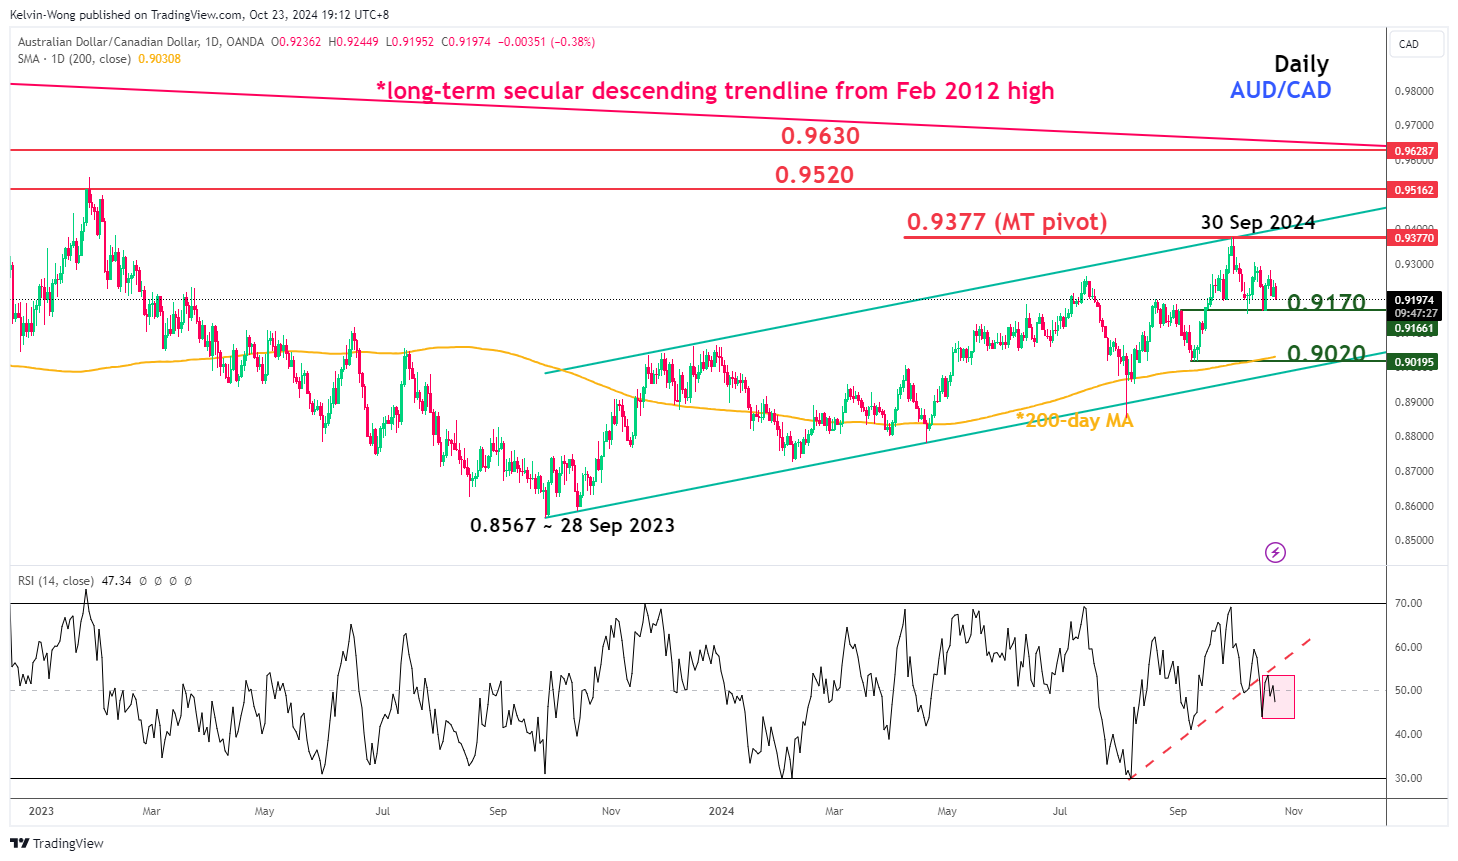
Fig 1: AUD/CAD medium-term & major trends as of 23 Oct 2024 (Source: TradingView, click to enlarge chart)
The major uptrend phase of the AUD/CAD cross pair in place since the 28 September 2023 low of 0.8567 reached and reacted off the upper boundary of its year-long ascending channel on 30 September 2024.
In addition, medium-term upside momentum has weakened significantly as the daily RSI momentum indicator has staged a bearish breakdown below its parallel ascending trendline support and slipped below the 50 level (see Fig 1).
Watch the 0.9377 key medium-term pivotal resistance and a break below the 0.9170 intermediate support reinforces the short-term mean reversion decline of the AUD/CAD to expose the 0.9020 medium-term support (also the 200-day moving average).
On the other hand, a clearance above 0.9377 may see further weakness in the Canadian dollar where the AUD/CAD cross pair may squeeze higher for the next medium-term resistances to come in at 0.9520 and 0.9630.
EUR/USD Dips to 11-Week Low
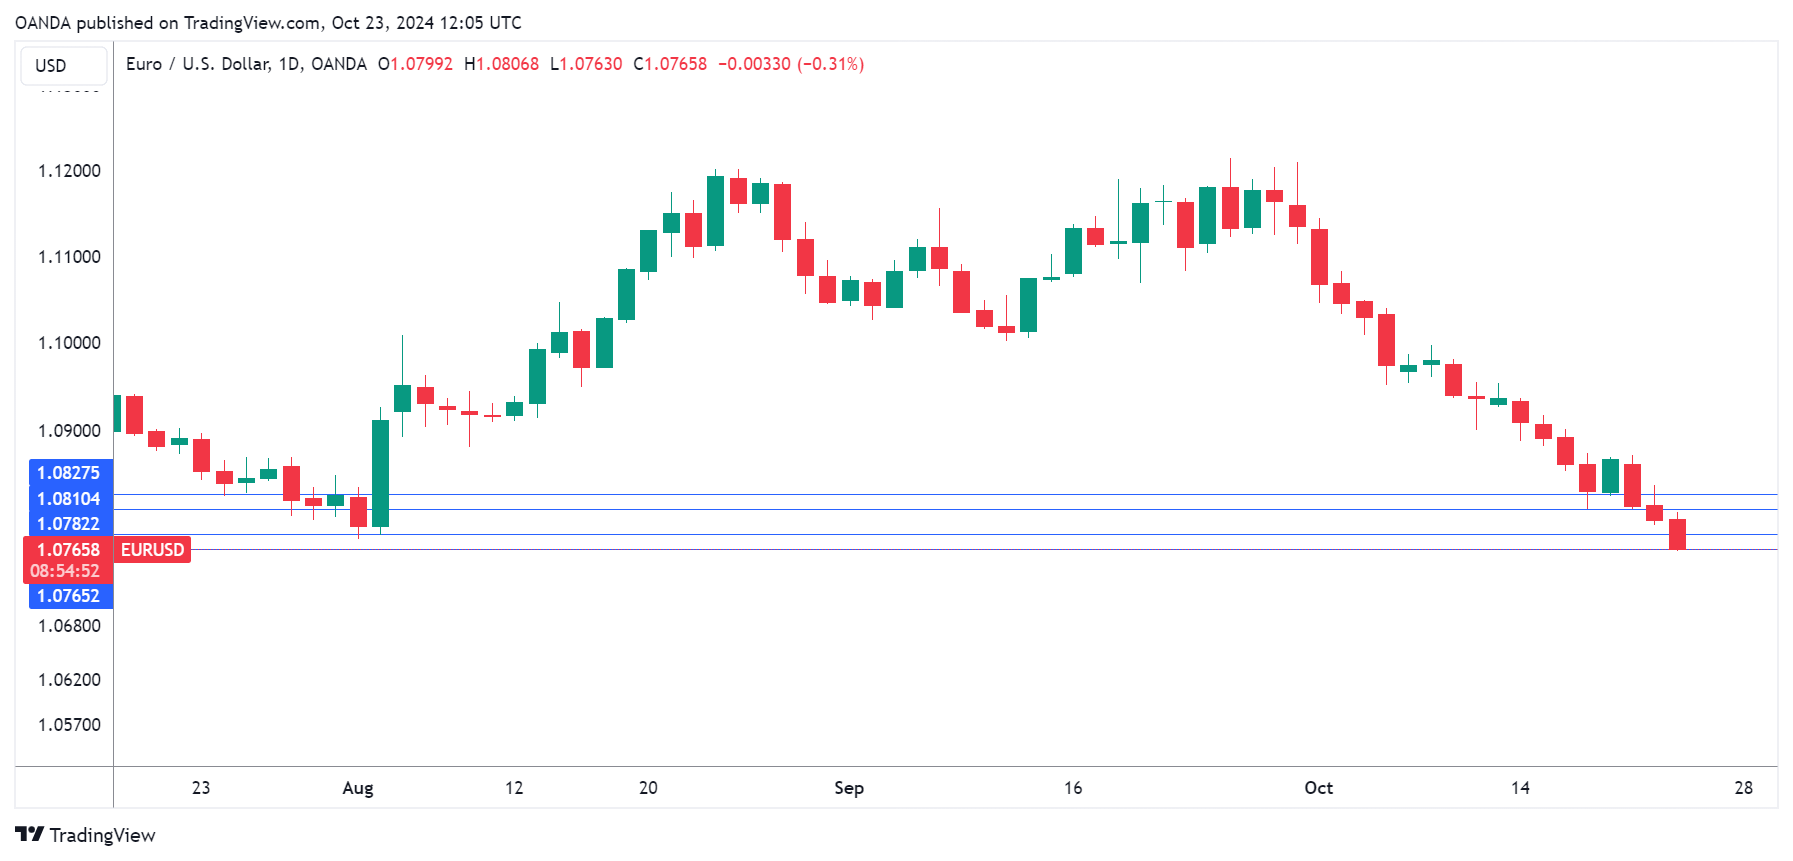
The euro is down for a third straight day on Wednesday. In the European session, EUR/USD is trading at 1.0767, down 0.29% on the day. The euro remains under pressure and has declined 3.3% in October.
Euro PMIs expected to show more of the same
The Eurozone releases the September PMI reports on Thursday, with little change expected. The manufacturing sector is in a prolonged depression and has contracted for 27 straight months. Domestic and international orders have been decreasing while input costs are rising. Business conditions have been worsening and there doesn’t seem to be a light at the end of the tunnel. The market estimate for the Manufacturing PMI is 45.3, compared to 45.0 in August. The 50 level separates contraction from expansion.
The services sector is in better shape, having expanded for seven consecutive months. The growth during this time has been modest and the September market estimate is 51.5, up from 50.5 in August.
The PMIs point to a weak eurozone economy and lower interest rates would provide a badly-needed boost. The European Central Bank cut rates last week, its second quarter-point cut in just five weeks. The deposit rate has been brought down to 3.25% and with inflation largely under control, the ECB is shifting from fighting inflation to boosting economic growth. This likely means further rate cuts before the end of the year.
The Federal Reserve jumped out of the rate-cutting gates in September, delivering a jumbo 50-basis point cut. Inflation dropped from 2.5% to 2.4% in September, closer to the Fed’s 2% target. Employment has become the number one priority and weak job numbers was a key reason why the Fed opted for an oversized cut in September. Fed members have signaled that more cuts are coming before year’s end but these will likely be in 25-bp increments, which is the traditional size of Fed rate hikes and cuts.
EUR/USD Technical
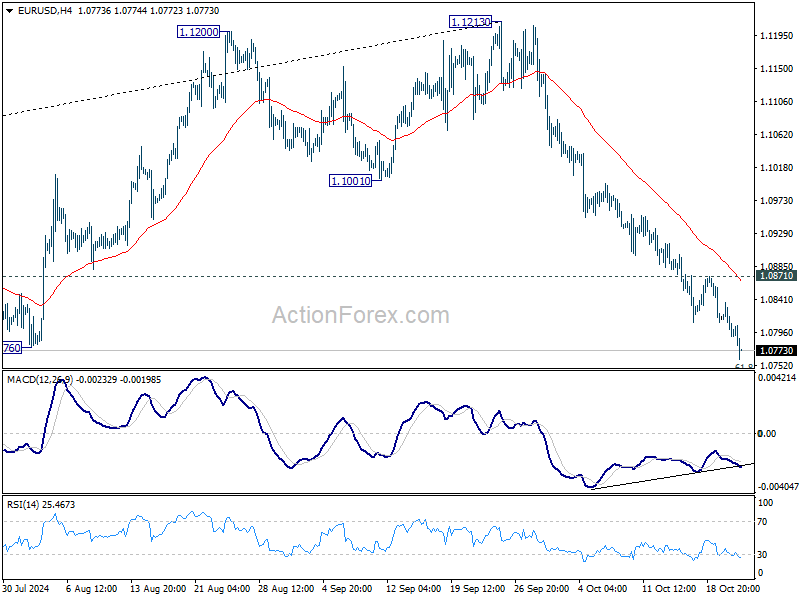
- EUR/USD is testing support at 1.0765. Below, there is support at 1.0737
- 1.0782 and 1.0810 are the next resistance lines
EUR/USD Mid-Day Outlook
Daily Pivots: (S1) 1.0782; (P) 1.0810; (R1) 1.0827; More...
Intraday bias in EUR/USD remains on the downside as fall from 1.1213 is in progress for 61.8% retracement of 1.0447 to 1.1213 at 1.0740. Firm break there will target 1.0601 support next. On the upside, break of 1.0871 resistance is needed to indicate short term bottoming. Otherwise, outlook will stay bearish in case of recovery.
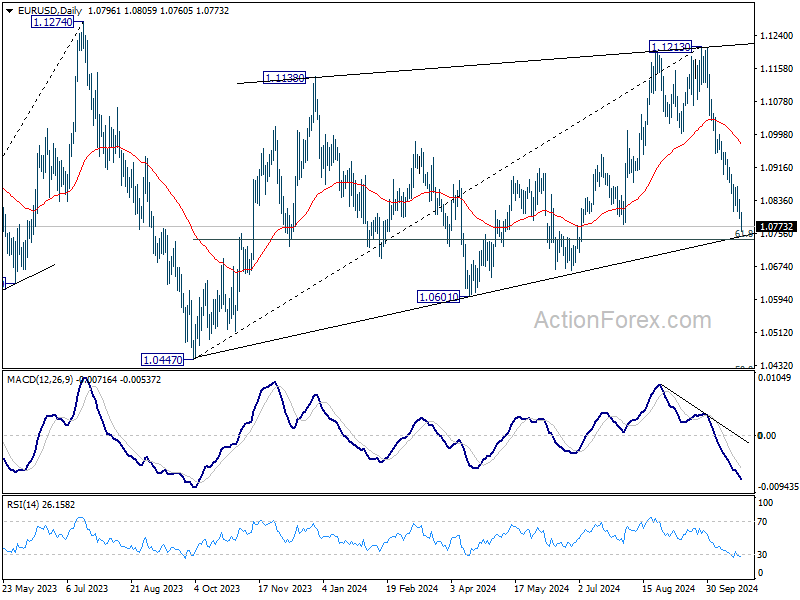
In the bigger picture, price actions from 1.1274 (2023 high) are seen as a consolidation pattern to up trend from 0.9534 (2022 low), with fall from 1.1213 as the third leg. Downside should be contained by 50% retracement of 0.9534 (2022 low) to 1.1274 at 1.0404, to bring up trend resumption at a later stage.
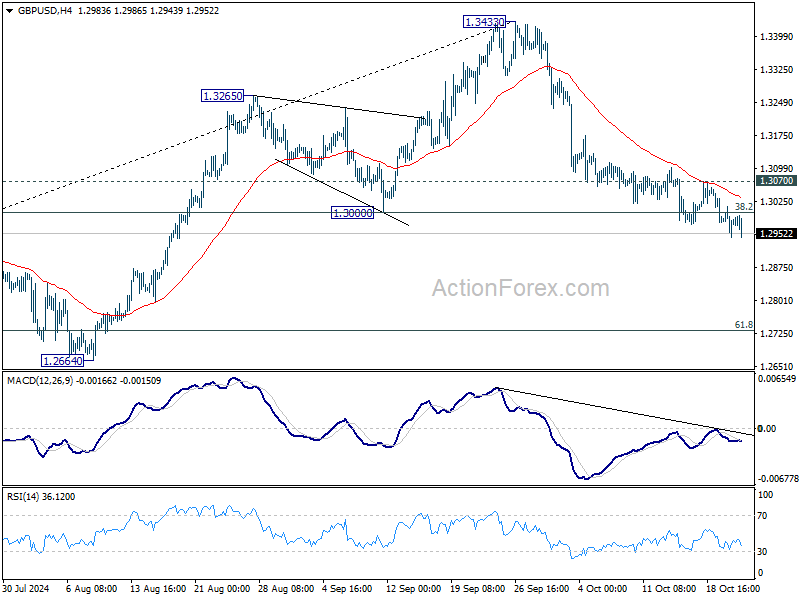
GBP/USD Mid-Day Outlook
Daily Pivots: (S1) 1.2949; (P) 1.2982; (R1) 1.3019; More...
Intraday bias in GBP/USD remains on the downside at this point. Sustained trading below 1.3000 cluster support (38.2% retracement of 1.2298 to 1.3433 at 1.2999) will argue that whole rise from 1.2298 has completed and bring deeper fall to 61.8% retracement at 1.2732. On the upside, break of 1.3070 minor resistance will turn bias back to the upside for stronger rebound.
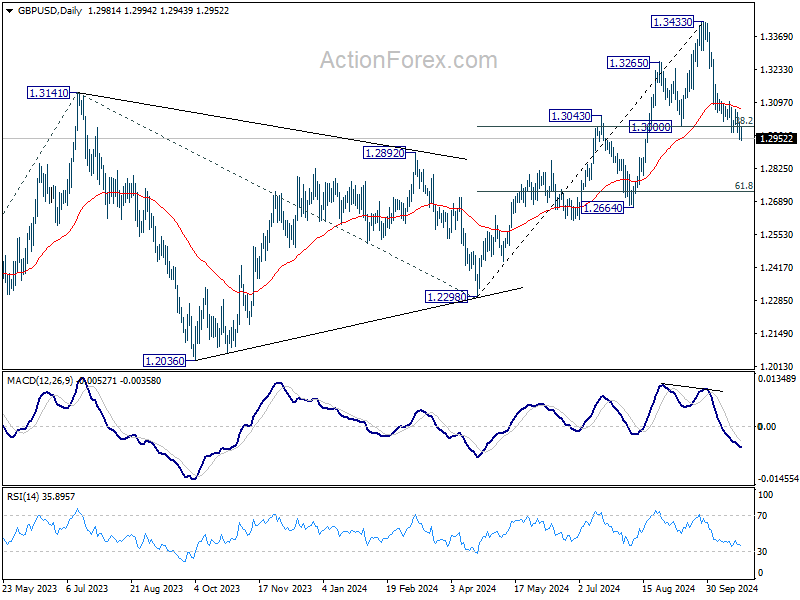
In the bigger picture, considering mildly bearish divergence condition in D MACD, decisive break of 1.3000 support will suggest that a medium term top is already formed at 1.3433. Price actions from there would be tentatively seen as correcting the up trend from 1.0351 (2022 low). In this case, deeper fall would be seen to 1.2298 structural support, strong support should be seen there to bring rebound.
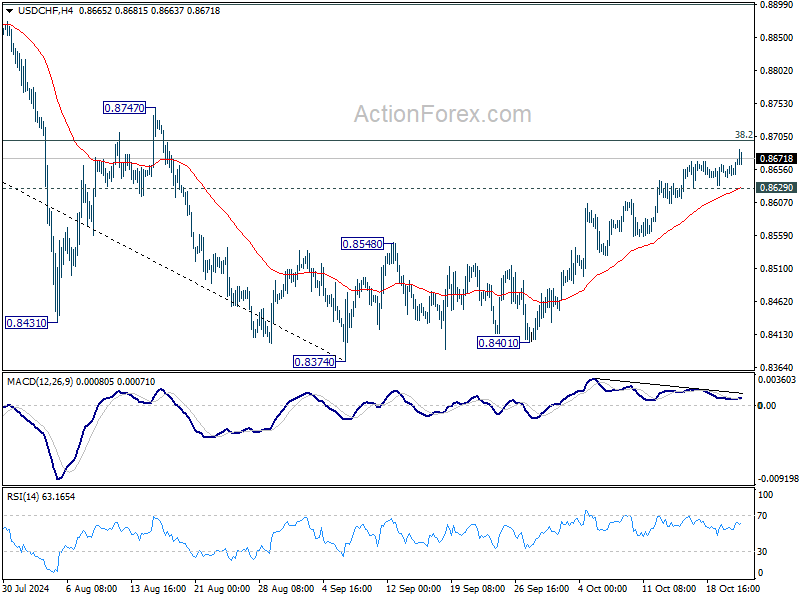
USD/CHF Mid-Day Outlook
Daily Pivots: (S1) 0.8639; (P) 0.8654; (R1) 0.8667; More…
Intraday bias in USD/CHF stays on the upside as rise from 0.8374 is in progress. Sustained break of 38.2% retracement of 0.9223 to 0.8374 at 0.8698 will argue that fall from 0.9223 has completed at 0.8374, after defending 0.8332 low. Further rally should then be seen to 61.8% retracement at 0.8899 next. On the downside, below 0.8629 minor support will turn intraday bias neutral again.
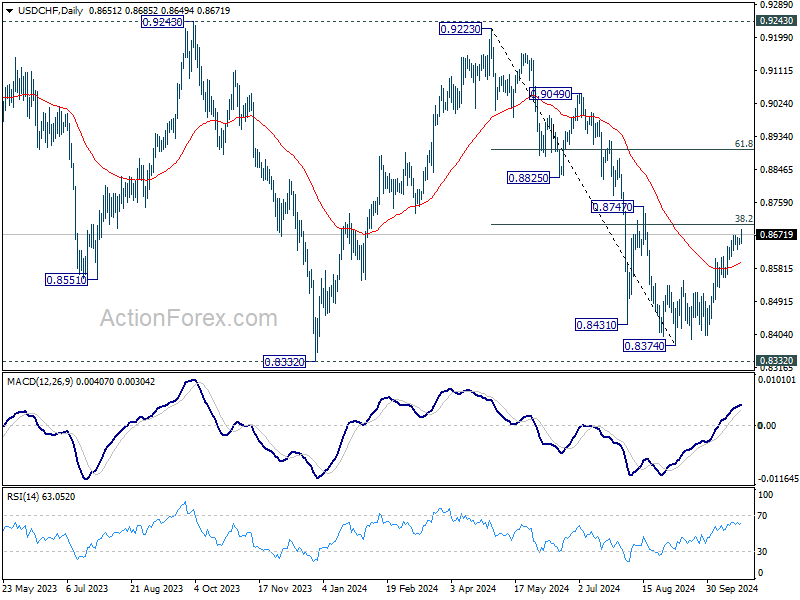
In the bigger picture, price actions from 0.8332 (2023 low) are currently seen as a medium term corrective pattern, with fall from 0.9223 as the second leg. Strong support could be seen from 0.8332 to bring rebound. Yet, overall outlook will continue to stay bearish as long as 0.9243 resistance holds. Firm break of 0.8332, however, will resume larger down trend from 1.0146 (2022 high).
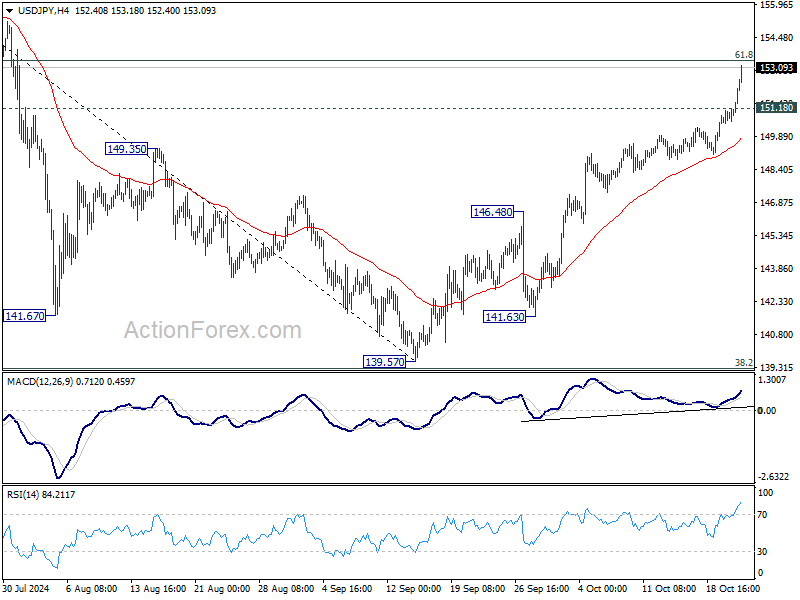
USD/JPY Mid-Day Outlook
Daily Pivots: (S1) 150.66; (P) 150.93; (R1) 151.36; More...
USD/JPY accelerates to as high as 153.18 so far and intraday bias stays on the upside. Decisive break of 61.8% retracement of 161.94 to 139.57 at 153.39 will pave the way to retest 161.94 high. On the downside, below 151.18 minor support will turn intraday bias neutral first. But further rally will now remain in favor as long as 55 D EMA (now at 147.85) holds, in case of retreat.
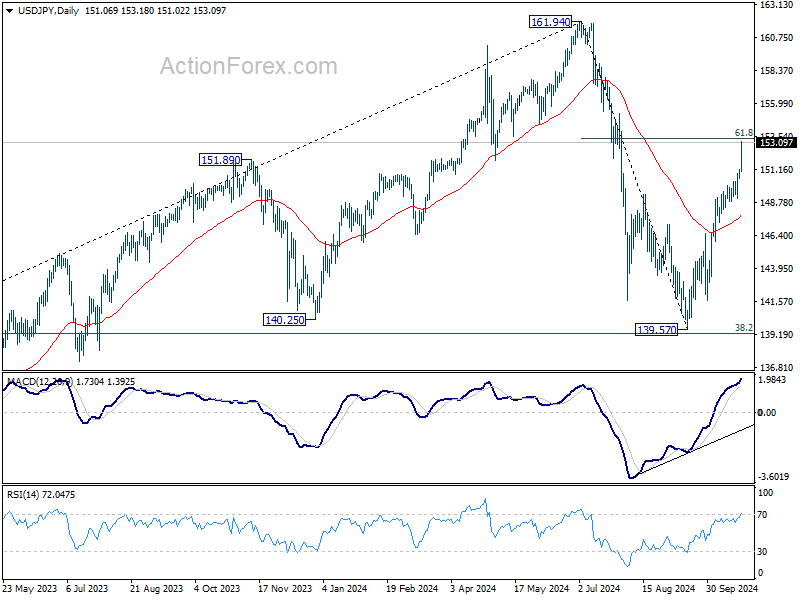
In the bigger picture, price actions from 161.94 are seen as a corrective pattern to rise from 102.58 (2021 low). The range of medium term consolidation should be set between 38.2% retracement of 102.58 to 161.94 at 139.26 and 161.94. Nevertheless, sustained break of 139.26 would open up deeper medium term decline to 61.8% retracement at 125.25.
Yen and Nikkei Tumble as Japan Prepares for Snap Election, Dollar Extends its Dominance
Japanese Yen and the Nikkei index have both been hammered this week as political uncertainty ahead of Japan’s snap election seemed to be rattling investor confidence. Yen accelerated its slide against Dollar through 153 mark while Nikkei ended the day with a sharp loss of over 300 points. Prime Minister Shigeru Ishiba’s dissolution of the lower house of parliament earlier this month has set the stage for the House of Representatives election on October 27. Concerns are rising that the ruling Liberal Democratic Party and its coalition partner, Komeito, could lose their majority, injecting more political instability into an already fragile market.
Adding to the Yen's weakness is the apparent political vacuum regarding currency intervention. Despite the Yen's rapid depreciation, Japanese authorities have remained unusually silent, offering no verbal intervention to stem the decline. Traders have interpreted this silence as a tacit approval to continue selling Yen without fear of official pushback. Unless there's a significant shift in policy communication from Japanese officials, the Yen may face further downside pressure throughout the week, at least until the election results provide clearer direction on Japan's politics.
Across the broader forex market, Dollar continues to extend its broad-based gains, benefiting from rising yields and expectations of a slower pace of Fed easing. The Canadian Dollar is the second strongest performer, with markets awaiting the Bank of Canada’s interest rate cut, updated economic projections, and any signals regarding future policy easing. Yen, by far the worst performer this week, faces steep losses. Australian and New Zealand Dollars are also under pressure, with their declines gaining momentum, while Euro and Sterling remain stuck in the middle of the pack.
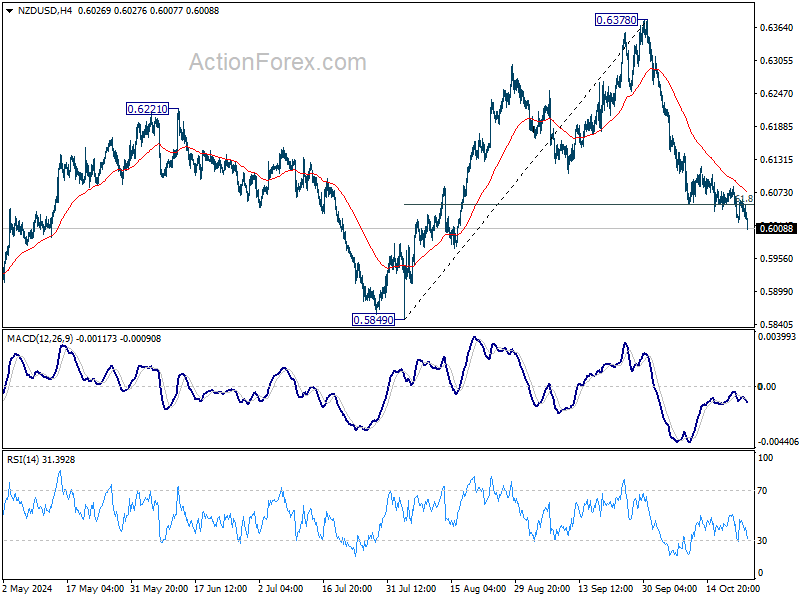
Technically, NZD/USD is picking up downside momentum as fall from 0.6378 extends. As long as 4H EMA (now at 0.6073) holds, there is risk of further downside acceleration towards 0.5849 low next.
 In Europe, at the time of writing, FTSE is down -0.54%. DAX is down -0.15%. CAC is down -0.58%. UK 10-year yield is up 0.040 at 4.210. Germany 10-year yield is down -0.005 at 2.317. Earlier in Asia, Nikkei fell -0.80%. Hong Kong HSI rose 1.27%. China Shanghai SSE rose 0.52%. Singapore Strait Times rose 0.37%. Japan 10-year JGB yield fell -0.001 to 0.979.
BoC to Slash Rates by 50bps
BoC is widely anticipated to lower its policy rate by 50bps to 3.75% today, marking the fourth consecutive rate cut. The central bank is stepping up its monetary easing, as policymakers are increasingly worried that the current high level of interest rates is causing additional economic pain.
Recent economic indicators support the case for the more aggressive adjustment. Unemployment rate surged to a seven-year high (excluding the pandemic period) of 6.6% in August before dipping slightly to 6.5% in September. Even at 6.5%, unemployment remains a full percentage point higher than a year earlier. Additionally, per capita GDP has contracted for five consecutive quarters. With inflation falling more rapidly to 1.6% in September, the BoC has room to act swiftly.
The key question now is the pace of future policy easing. There are firm expectations that the interest rate will fall to a neutral range between 2.25% and 3.25% by the end of next year. Among major financial institutions, Scotiabank is forecasting a more conservative year-end policy rate of 3.00%, while National Bank and RBC anticipate a more aggressive path to 2.00% by the end of 2025. These projections will likely be reassessed based on BoC's new economic forecasts released today.
USD/JPY Mid-Day Outlook
Daily Pivots: (S1) 150.66; (P) 150.93; (R1) 151.36; More...
USD/JPY accelerates to as high as 153.18 so far and intraday bias stays on the upside. Decisive break of 61.8% retracement of 161.94 to 139.57 at 153.39 will pave the way to retest 161.94 high. On the downside, below 151.18 minor support will turn intraday bias neutral first. But further rally will now remain in favor as long as 55 D EMA (now at 147.85) holds, in case of retreat.
In the bigger picture, price actions from 161.94 are seen as a corrective pattern to rise from 102.58 (2021 low). The range of medium term consolidation should be set between 38.2% retracement of 102.58 to 161.94 at 139.26 and 161.94. Nevertheless, sustained break of 139.26 would open up deeper medium term decline to 61.8% retracement at 125.25.
GBPUSD: One More Burst of Strength?
- GBPUSD prints new lower low, reaches long-term support trendline
- Technical signals remain discouraging; more sellers wait below 1.2950
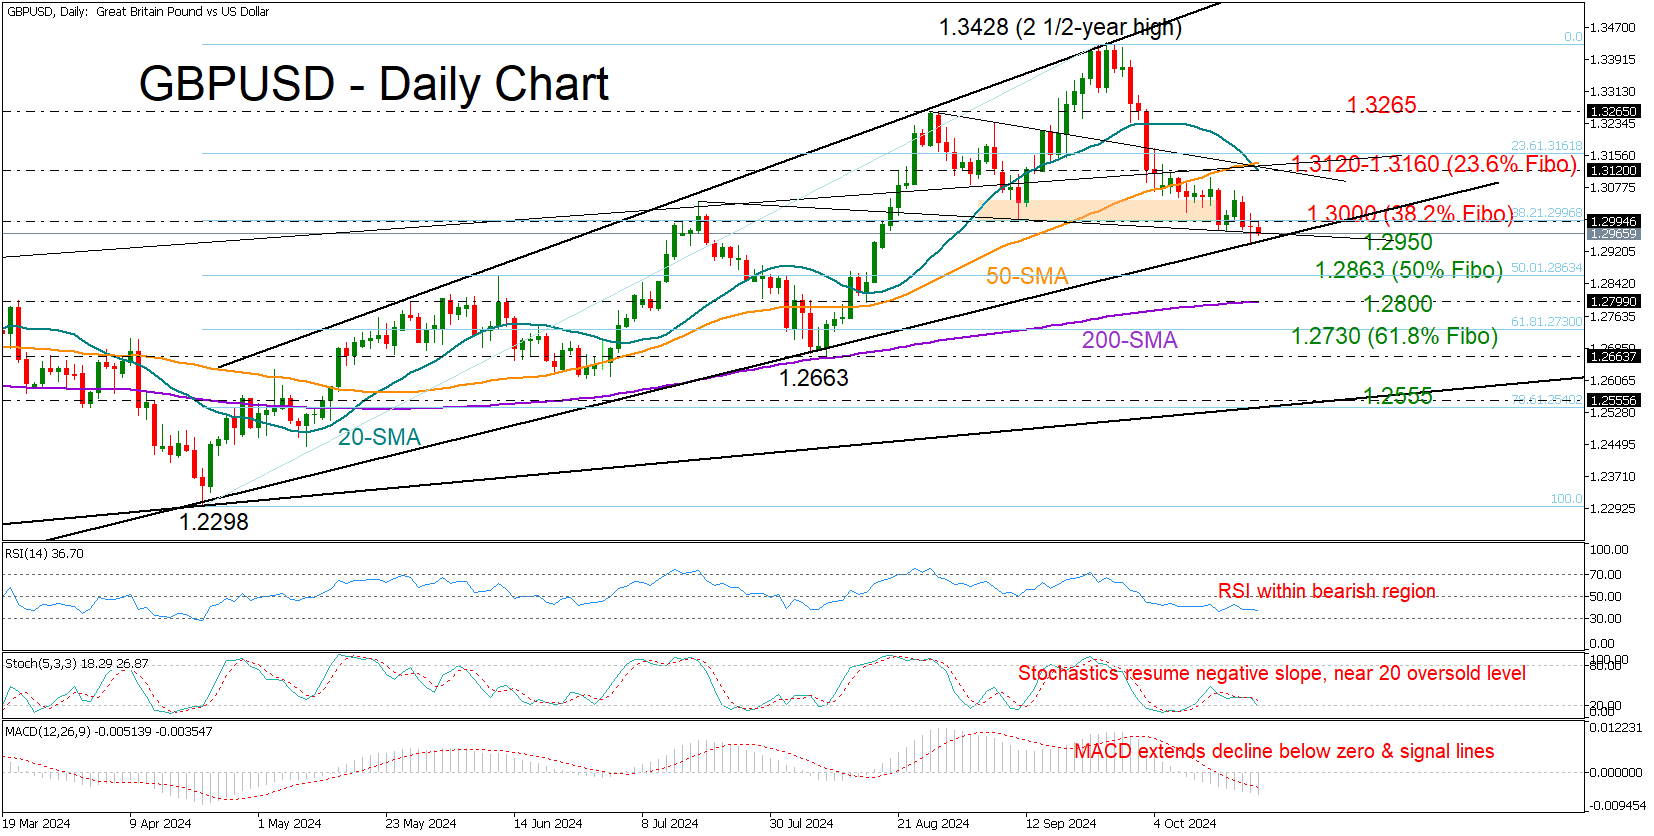
GBPUSD is currently in its fourth consecutive week of losses, gradually slipping below the 1.3000 mark for the first time since August. The pair recently hit a new lower low of 1.2943, with technical indicators reflecting persisting selling appetite. However, the long-term support trendline drawn from the 2022 bottom, currently around 1.2950, is providing some protection for the broader uptrend.
A close below the 1.2950 threshold could dampen market sentiment, causing another decline toward the 200-day simple moving average (SMA) at 1.2800, especially if the 50% Fibonacci retracement level from the April-September uptrend at 1.2863 is breached. Additional losses may pause near the 61.8% Fibonacci level at 1.2730 or could even extend toward the August low of 1.2663. If this trend continues, the pair could approach the ascending line connecting the October 2023 lows around 1.2555.
Conversely, if GBPUSD manages to reclaim the 1.3000 level, it could next target the 20- and 50-day SMAs around 1.3120, as well as the 23.6% Fibonacci level at 1.3160. A successful break above these barriers could pick up pace toward August's high of 1.3265.
In summary, while GBPUSD currently exhibits a bearish bias, the long-term support at 1.2950 could allow for some recovery, keeping traders alert for potential shifts in momentum.