
Sample Category Title
EUR/GBP Daily Outlook
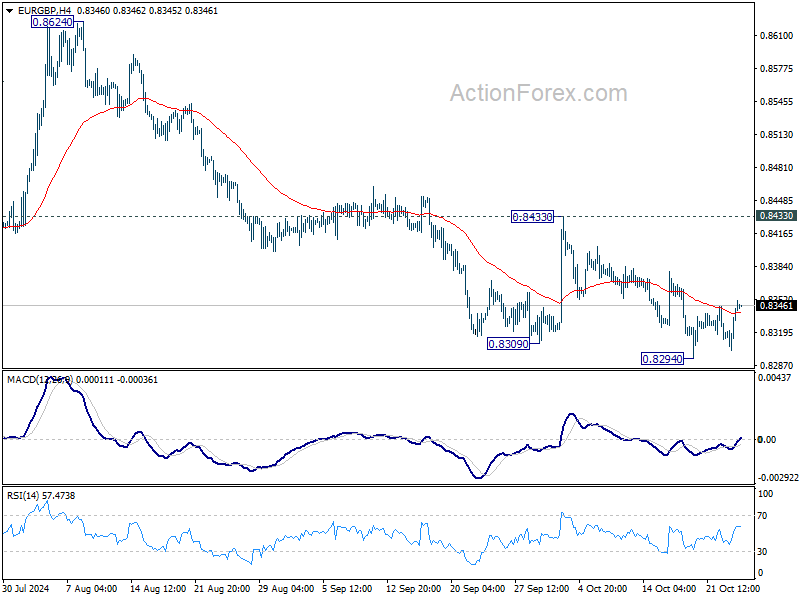
Daily Pivots: (S1) 0.8318; (P) 0.8331; (R1) 0.8359; More...
Intraday bias in EUR/GBP is turned neutral with current recovery, and some consolidations would be seen. But outlook will stay bearish as long as 0.8433 resistance holds. On the downside, break of 0.8294 will resume larger down trend to 0.8201 key support next. Strong support could be seen from there to bring sustainable rebound.
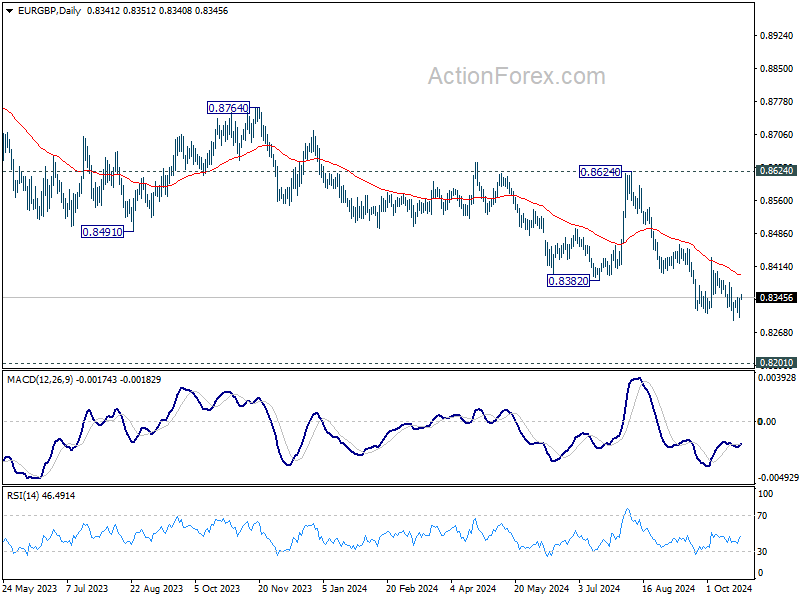
In the bigger picture, down trend from 0.9267 (2022 high) is in progress. Next target is 0.8201 (2022 low), but strong support should be seen there to bring rebound. However, outlook will remain bearish as long as 0.8624 resistance holds even in case of strong rebound. Decisive break of 0.8201 will indicate long term bearish reversal.
EUR/AUD Daily Outlook
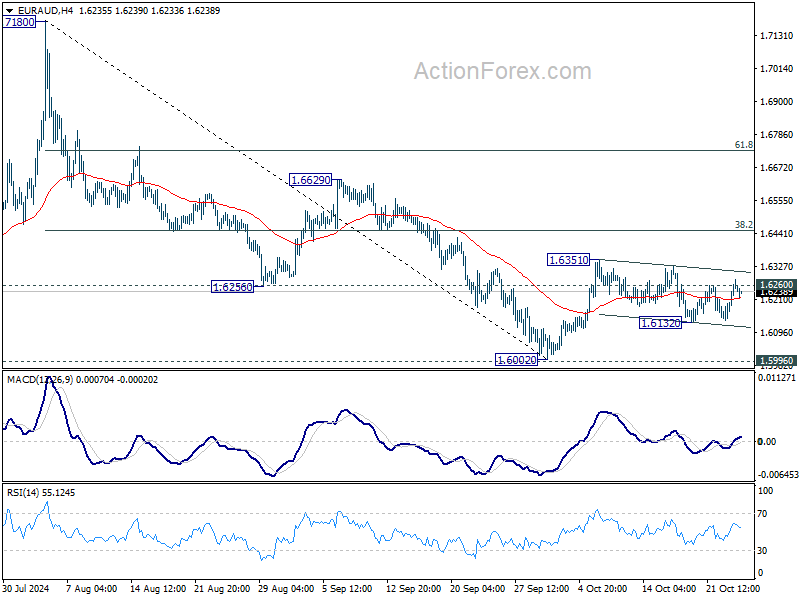
Daily Pivots: (S1) 1.6167; (P) 1.6226; (R1) 1.6311; More...
Breach of 1.6260 minor resistance suggests that EUR/AUD's pullback from 1.6351 has completed at 1.6132. Intraday bias is back on the upside. Further rally should be seen through 1.6351 to 38.2% of 1.7180 to 1.6002 at 1.6452. On the downside, though, below 1.6132 will extend the pull back from 1.6351 towards 1.6002 low.
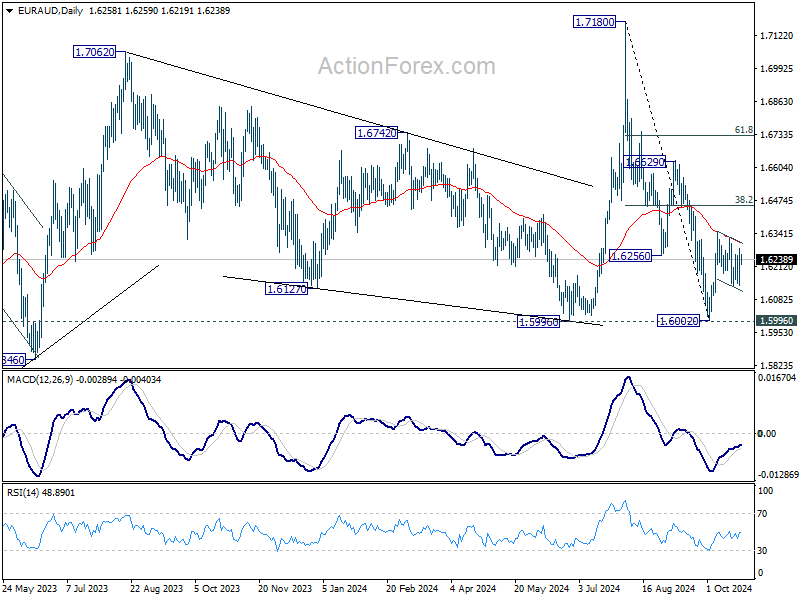
In the bigger picture, as long as 1.5996 cluster support holds (38.2% retracement of 1.4281 to 1.7062 (2023 high) at 1.6000), up trend from 1.4281 (2022 low) is still expected to resume at a later stage. However, decisive break of 1.5996 will argue that the medium term trend has reversed and turn outlook bearish.
EUR/CHF Daily Outlook
Daily Pivots: (S1) 0.9328; (P) 0.9351; (R1) 0.9366; More....
Intraday bias in EUR/CHF remains neutral first, with immediate focus on 0.9332 support. Firm break there will resume the fall from 0.9579 towards 0.9209, and argue that larger down trend might be ready to resume too. On the upside, though, break of 0.9506 will turn intraday bias to the upside for 0.9579 resistance and above.
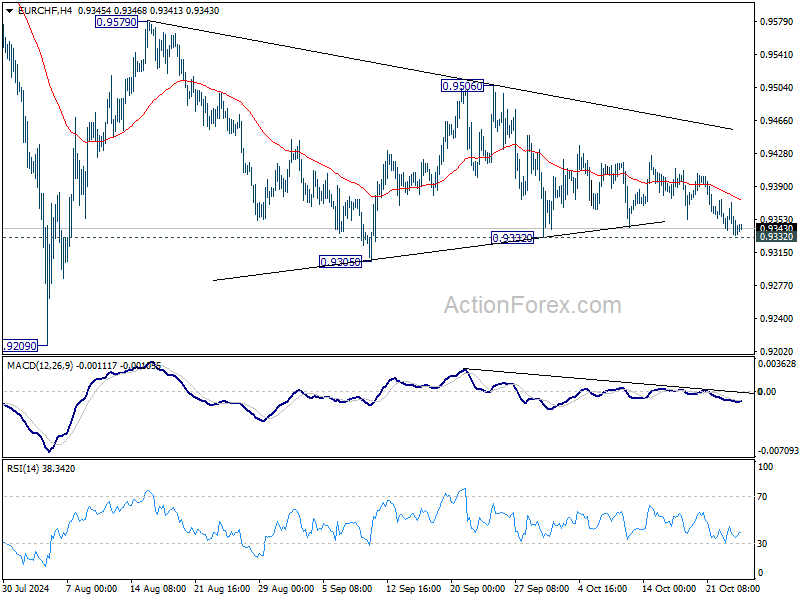
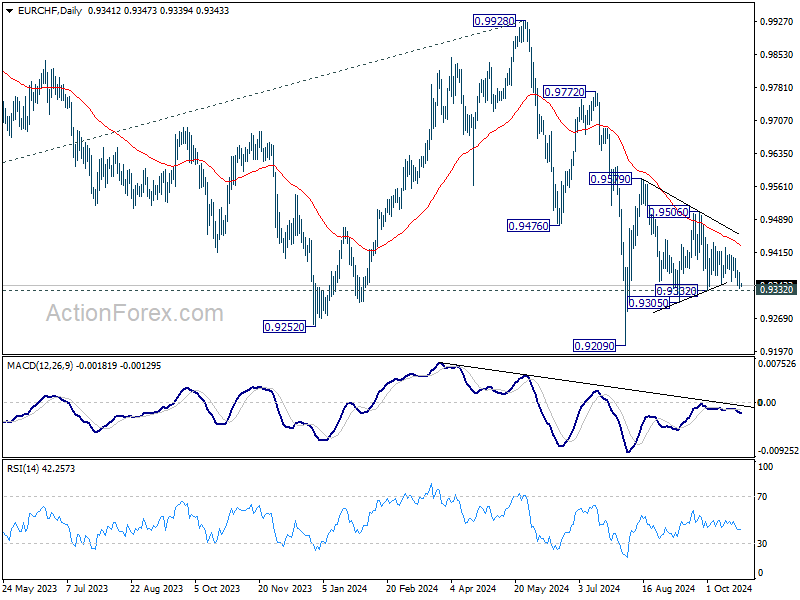
In the bigger picture, fall from 0.9928 is seen as part of the long term down trend. Repeated rejection by 55 D EMA (now at 0.9432) keeps outlook bearish for breaking through 0.9209 low at a later stage. Nevertheless, sustained trading above 55 D EMA will confirm medium term bottoming and bring stronger rebound back towards 0.9928 key resistance.
Yen Recovers as Japan Breaks Silence on Currency Depreciation, Euro Awaits PMI Data
Japanese Yen saw a modest recovery today after briefly dipping below the 153 mark against Dollar, as Japanese officials finally broke silence on the currency's recent decline. Finance Minister Katsunobu Kato stated that the government is closely monitoring exchange-rate movements with "heightened vigilance, including for any speculative moves." He reiterated the need for exchange rates to "move stably."
Nevertheless, Kato also mentioned that G20 finance leaders did not discuss currency rate movements at Wednesday's meeting and are unlikely to do so during Thursday's session. While his comments have provided temporary relief for Yen, they are unlikely to reverse the currency's overall weakening trend.
Meanwhile, Euro is under selling pressure as markets await the release of the Eurozone's PMI data. ECB officials have struck a notably dovish tone this week, confirming reports that policymakers are considering accelerating monetary easing with a 50bps rate cut in December. Although such a significant cut is not the current baseline, it is likely to be a topic of discussion at the upcoming meeting. Any further deterioration in economic activity, as indicated by the PMI data, could make a 25 or 50 bps a closer call.
In the broader currency markets, Dollar remains the strongest performer this week, supported by continued strength in US Treasury yields. Swiss Franc and Canadian Dollar follow closely, with Loonie showing resilience despite yesterday's 50 bps rate cut by BoC. Yen remains the weakest currency despite today's rebound, while Kiwi and Sterling are also under pressure. Euro and Aussie are positioned in the middle of the pack.
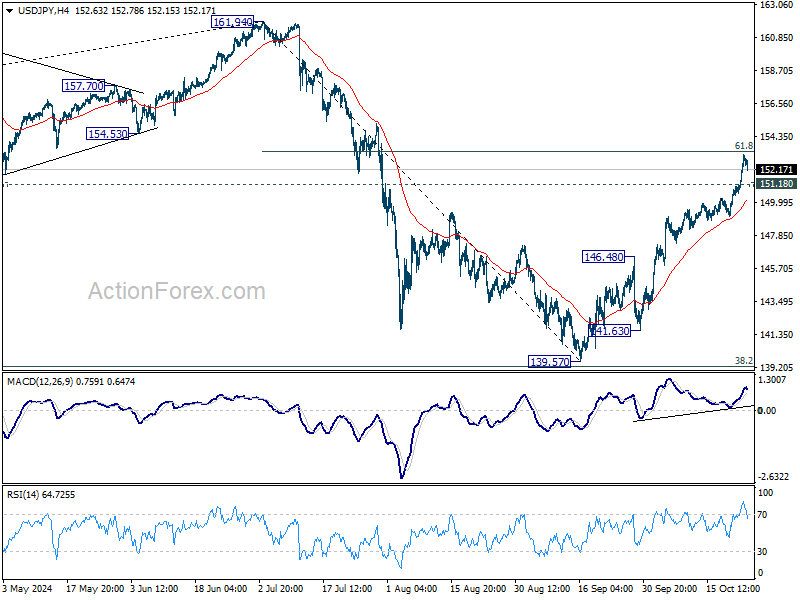
Technically, break of 151.18 minor support in USD/JPY will indicate initial rejection by 61.8% retracement of 161.94 to 139.57 at 153.39 and bring consolidations first, before staging another rally. Nevertheless, decisive break of 153.39 will extend the rally from 139.57 towards 161.94 high.
In Asia, at the time of writing, Nikkei is down -0.09%. Hong Kong HSI is down -0.99%. China Shanghai SSE is down -0.50%. Singapore Strait Times is up 0.54%. Japan 10-year JGB yield is down -0.005 at 0.974. Overnight, DOW fell -0.96%. S&P 500 fell -0.92%. NASDAQ fell -1.60%. 10-year yield rose 0.038 to 4.242.
BoJ’s Ueda warns gradual rate hikes could leading to Yen speculations
At the International Monetary Fund event, BoJ Governor Kazuo Ueda said "It's still taking time for us to get to 2% in a sustainable way," Ueda said, justifying the commitment to maintaining its accommodative monetary policy for the time being, even with this year's rate hikes.
Ueda stressed that raising inflation expectations and supporting underlying inflation are crucial to moving the Japanese economy toward "a new equilibrium with 2% inflation in a sustainable way".
However, he acknowledged the complexity of determining the pace and magnitude of future rate hikes. "I think about what would be the right size of normalization in total going forward, and how best to allocate that total rate hike across time," he admitted, adding that this challenge keeps him "awake 24/7."
A key concern for BoJ is the balance between cautious, gradual rate hikes and the risk of creating market distortions. Ueda warned that moving "very, very gradually" could lead to market participants assuming that rates will remain low for an extended period, resulting in a "huge build-up of speculative positions" in Yen.
Finding the "right balance" between caution and effective action is critical, Ueda emphasized, as BoJ continues to navigate a difficult path toward inflation normalization.
Japan’s private sector falls into contraction as PMI services plunges to 20-month low
Japan's private sector slipped into contraction territory at the beginning of Q4, with PMI Manufacturing index declining from 49.7 to 49.0 in October. The services sector saw a much sharper fall, with PMI Services tumbling from 53.1 to 49.3, its worst reading since February 2022. As a result, PMI Composite also dropped from 52.0 to 49.4, the weakest figure since November 2022.
According to Usama Bhatti, economist at S&P Global Market Intelligence, Japan’s economic slowdown has become more pronounced, with firms attributing the downturn to a "muted economy and subdued new order inflows."
Business confidence for the coming year also took a hit, softening to the lowest level since August 2020. Bhatti noted that the "stubbornness of high prices" and ongoing economic weakness are weighing on overall sentiment.
Australian's PMI manufacturing hits 53-month low, inflation pressures easing
Australia’s manufacturing sector continues to struggle, with PMI Manufacturing index slipping slightly from 46.7 to 46.6 in October, marking its lowest point in 53 months. According to Judo Bank’s Matthew De Pasquale, key indicators such as output and new orders have dropped to levels that signal the sector is "on the verge of recession."
However, services sector, which accounts for over 80% of the country's economic output, showed modest improvement. PMI Services ticked up from 50.5 to 50.6, and new business activity rose to its highest level since May, suggesting some resilience. De Pasquale noted that while business growth remains "soft," the outlook for the services sector is improving with new business activity at the highest level since May
Inflation also appears to be moderating. Input cost pressures fell to their lowest levels since the onset of pandemic-induced inflation in 2021. Final prices, particularly in services, are also trending downward. De Pasquale added that inflation "remains on track" to return to RBA's target range of 2% to 3%.
BoE's Bailey: Disinflation surprising, but structural Economic changes pose uncertainty
At an event hosted by the Institute of International Finance, BoE Andrew Bailey acknowledged that disinflation in the UK is progressing "faster than we expected". However, he expressed concerns about potential "structural changes" in the economy that could sustain price pressures.
Specifically, Bailey highlighted uncertainty around the labor market and whether shifts in employment dynamics might keep inflation elevated.
He pointed to services inflation, which remains high at just under 5%, and emphasized that it “has to come further down” to meet the 2% target. Despite some signs of labor market loosening, Bailey noted it remains tight, contributing to ongoing inflationary pressures.
“We’ve got a very unbalanced mix of inflation components and services inflation remains higher than is consistent with the target,” Bailey said.
Looking ahead
PMI data from Eurozone and the UK are the main focus in European session. Later in the day, US will release jobless claims, new home sales, and PMIs.
EUR/CHF Daily Outlook
Daily Pivots: (S1) 0.9328; (P) 0.9351; (R1) 0.9366; More....
Intraday bias in EUR/CHF remains neutral first, with immediate focus on 0.9332 support. Firm break there will resume the fall from 0.9579 towards 0.9209, and argue that larger down trend might be ready to resume too. On the upside, though, break of 0.9506 will turn intraday bias to the upside for 0.9579 resistance and above.
In the bigger picture, fall from 0.9928 is seen as part of the long term down trend. Repeated rejection by 55 D EMA (now at 0.9432) keeps outlook bearish for breaking through 0.9209 low at a later stage. Nevertheless, sustained trading above 55 D EMA will confirm medium term bottoming and bring stronger rebound back towards 0.9928 key resistance.
AUD/USD Falls Hard: Can It Recover from The Tumble?
Key Highlights
- AUD/USD gained bearish momentum below the 0.6750 support.
- A connecting bearish trend line is forming with resistance at 0.6690 on the 4-hour chart.
- Gold prices rallied to a new all-time high at $2,758 before it saw a minor pullback.
- EUR/USD declined further and traded below 1.0800.
AUD/USD Technical Analysis
The Aussie Dollar started a fresh decline below the 0.6800 level against the US Dollar. AUD/USD traded below 0.6750 to move into a bearish zone.
Looking at the 4-hour chart, the pair settled below the 0.6720 pivot level, the 100 simple moving average (red, 4-hour), and the 200 simple moving average (green, 4-hour). The pair even tested the 0.6630 level and currently consolidating losses.
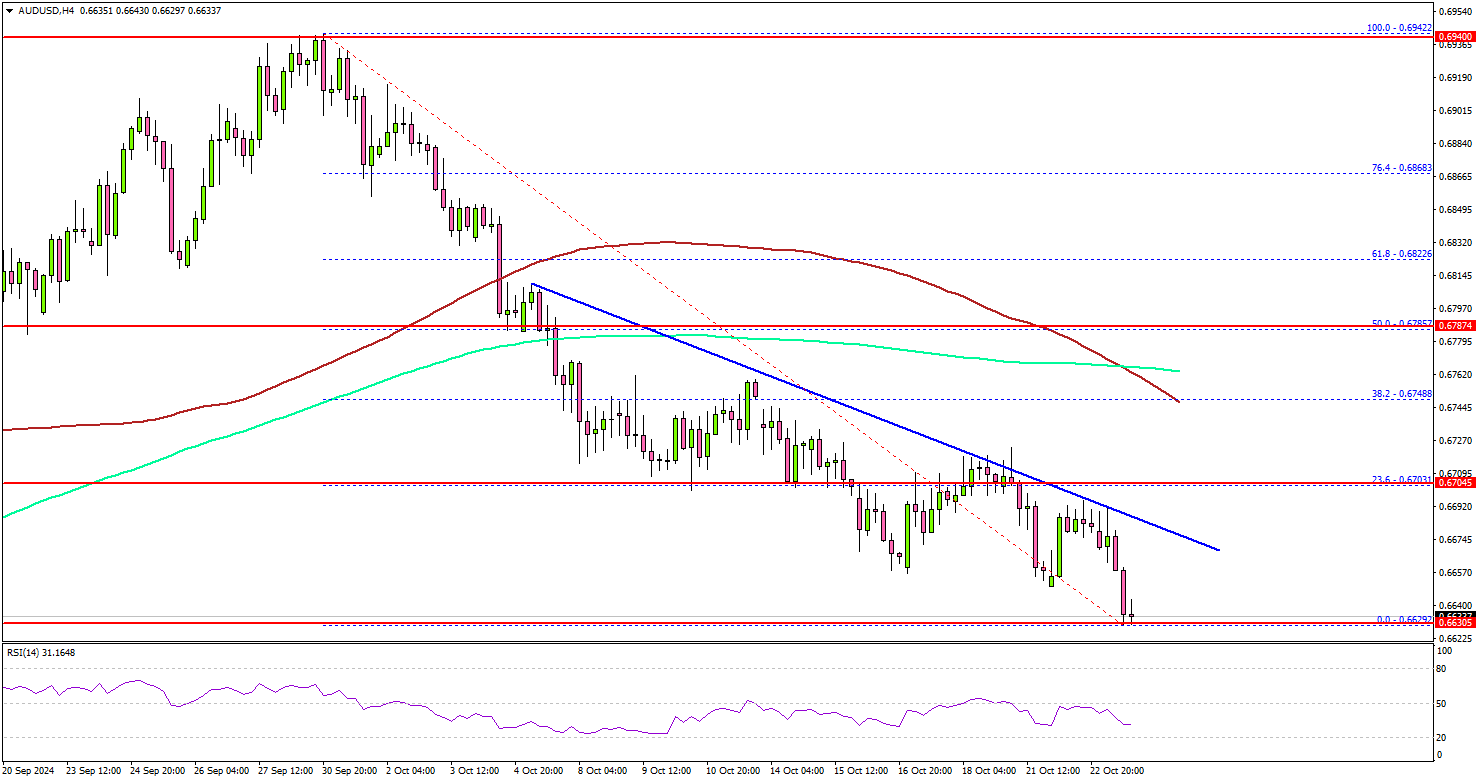
On the upside, the pair could face resistance near the 0.6685 level. There is also a connecting bearish trend line forming with resistance at 0.6690 on the same chart.
The first key resistance is near the 0.6750 level and the 100 simple moving average (red, 4-hour). A close above the 0.6750 level could set the tone for another increase. The next major resistance could be 0.6800, above which the price could accelerate higher toward the 0.6840 level.
On the downside, immediate support sits near the 0.6620 level. The next key support sits near the 0.6600 level. Any more losses could send the pair toward the 0.6550 level.
Looking at EUR/USD, the pair followed a bearish path and the bears were able to push the pair below the 1.0800 level.
Upcoming Economic Events:
- Euro Zone Manufacturing PMI for Oct 2024 (Preliminary) – Forecast 45.1, versus 45.0 previous.
- Euro Zone Services PMI for Oct 2024 (Preliminary) – Forecast 51.6, versus 51.4 previous.
- US Manufacturing PMI for Oct 2024 (Preliminary) – Forecast 47.5, versus 47.3 previous.
- US Services PMI for Oct 2024 (Preliminary) – Forecast 55.0, versus 55.2 previous.
- US Initial Jobless Claims - Forecast 242K, versus 241K previous.
Japan’s private sector falls into contraction as PMI services plunges to 20-month low
Japan's private sector slipped into contraction territory at the beginning of Q4, with PMI Manufacturing index declining from 49.7 to 49.0 in October. The services sector saw a much sharper fall, with PMI Services tumbling from 53.1 to 49.3, its worst reading since February 2022. As a result, PMI Composite also dropped from 52.0 to 49.4, the weakest figure since November 2022.
According to Usama Bhatti, economist at S&P Global Market Intelligence, Japan’s economic slowdown has become more pronounced, with firms attributing the downturn to a "muted economy and subdued new order inflows."
Business confidence for the coming year also took a hit, softening to the lowest level since August 2020. Bhatti noted that the "stubbornness of high prices" and ongoing economic weakness are weighing on overall sentiment.
Australian’s PMI manufacturing hits 53-month low, inflation pressures easing
Australia’s manufacturing sector continues to struggle, with PMI Manufacturing index slipping slightly from 46.7 to 46.6 in October, marking its lowest point in 53 months. According to Judo Bank’s Matthew De Pasquale, key indicators such as output and new orders have dropped to levels that signal the sector is "on the verge of recession."
However, services sector, which accounts for over 80% of the country's economic output, showed modest improvement. PMI Services ticked up from 50.5 to 50.6, and new business activity rose to its highest level since May, suggesting some resilience. De Pasquale noted that while business growth remains "soft," the outlook for the services sector is improving with new business activity at the highest level since May
Inflation also appears to be moderating. Input cost pressures fell to their lowest levels since the onset of pandemic-induced inflation in 2021. Final prices, particularly in services, are also trending downward. De Pasquale added that inflation "remains on track" to return to RBA's target range of 2% to 3%.
BoJ’s Ueda warns gradual rate hikes could leading to Yen speculations
At the International Monetary Fund event, BoJ Governor Kazuo Ueda said "It's still taking time for us to get to 2% in a sustainable way," Ueda said, justifying the commitment to maintaining its accommodative monetary policy for the time being, even with this year's rate hikes.
Ueda stressed that raising inflation expectations and supporting underlying inflation are crucial to moving the Japanese economy toward "a new equilibrium with 2% inflation in a sustainable way".
However, he acknowledged the complexity of determining the pace and magnitude of future rate hikes. "I think about what would be the right size of normalization in total going forward, and how best to allocate that total rate hike across time," he admitted, adding that this challenge keeps him "awake 24/7."
A key concern for BoJ is the balance between cautious, gradual rate hikes and the risk of creating market distortions. Ueda warned that moving "very, very gradually" could lead to market participants assuming that rates will remain low for an extended period, resulting in a "huge build-up of speculative positions" in Yen.
Finding the "right balance" between caution and effective action is critical, Ueda emphasized, as BoJ continues to navigate a difficult path toward inflation normalization.
BoE’s Bailey: Disinflation surprising, but structural Economic changes pose uncertainty
At an event hosted by the Institute of International Finance, BoE Andrew Bailey acknowledged that disinflation in the UK is progressing "faster than we expected". However, he expressed concerns about potential "structural changes" in the economy that could sustain price pressures.
Specifically, Bailey highlighted uncertainty around the labor market and whether shifts in employment dynamics might keep inflation elevated.
He pointed to services inflation, which remains high at just under 5%, and emphasized that it “has to come further down” to meet the 2% target. Despite some signs of labor market loosening, Bailey noted it remains tight, contributing to ongoing inflationary pressures.
“We’ve got a very unbalanced mix of inflation components and services inflation remains higher than is consistent with the target,” Bailey said.
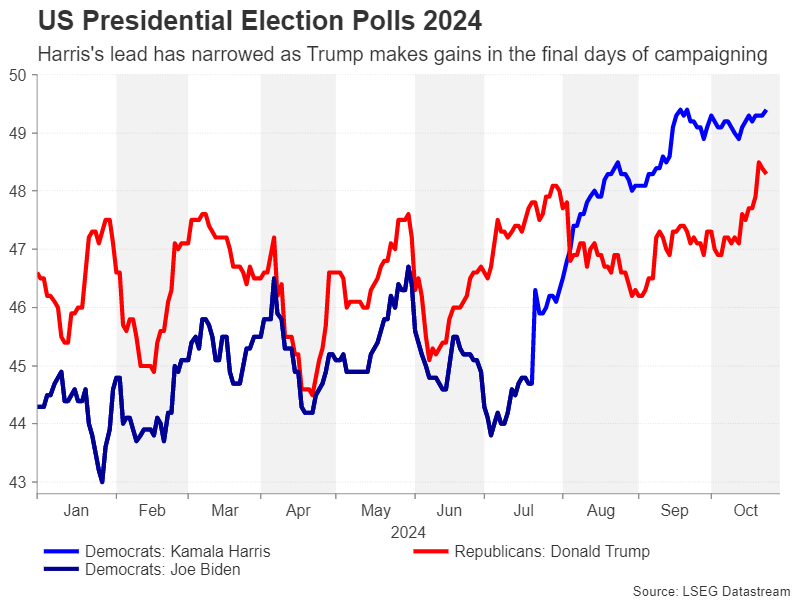
US Elections Update: The Race to White House Tightens
- Trump closes in on Harris’s lead in the polls
- Neck and neck race spurs market jitters
- Outcome still hinges on battleground states
Trump narrows the gap
The time for Americans to vote for a new president is drawing ever closer, but who will win on November 5 is looking a lot less certain now than it did when Vice President Kamala Harris entered the race. Whilst Harris is still ahead in most opinion polls, her lead has narrowed significantly over the past ten days, with Donald Trump enjoying a sizeable surge in voting intentions.
Key policy differences
Not a lot has changed on the policy front when it comes to the two candidates’ agendas since our last report. Trump is proposing big tax cuts across the board while Harris is prioritizing low-income workers and small businesses. Harris’s other economic proposals include support for first-time home buyers and an end to price gouging for groceries.
Trump has no specific policies on the cost-of-living crisis but has promised to “end inflation” and lower interest rates, raising question marks about the Fed’s independence under a second Trump term. But this may be quite a difficult challenge to achieve for Trump given that higher tariffs are a central part of his campaign.
On immigration, Trump is promising mass deportations of illegal entrants, forcing Harris to toughen up her position as well, with a crackdown on asylum claims. There’s little differentiating Harris from Biden on foreign policy, while Trump thinks he can negotiate quick deals to end the wars in Ukraine and the Middle East, marking a return to his isolationist stance.
Abortion and climate change make the list
Climate change and abortion are other notable hot topics in the 2024 election campaign. Abortion is perhaps Trump’s weakest point that will probably cost him significant votes, but it is a winning point for Harris, who is a staunch defender of abortion rights.
On energy, Trump wants to encourage more oil and gas drilling and questions the scientific evidence on climate change. But whilst Harris is all for renewable energy, she has backtracked on her opposition to fracking and no longer supports a mandate for electric vehicles.
Who controls Congress matters
All in all, there is quite a bit of ambiguity in both candidates’ policies, even on taxes. For example, Trump’s proposal to cut the corporate tax rate to 15% might only apply to companies that manufacture their goods in the US, while Harris wants to extend the 2017 tax cuts set to expire in 2025 only to those earning less than $400,000.
But the biggest uncertainty is that the policies that will eventually get through Congress will depend on the composition of the Senate and the House, as well as the state of the country’s finances. For financial markets, this will be the more important outcome.
Markets prefer a split Congress
A split Congress with either Trump or Harris as president is seen as the safest result for investors, as Republicans would almost certainly rein in uncontrolled spending by a Harris administration, and Democrats are unlikely to back unfunded tax cuts by Trump 2.0.
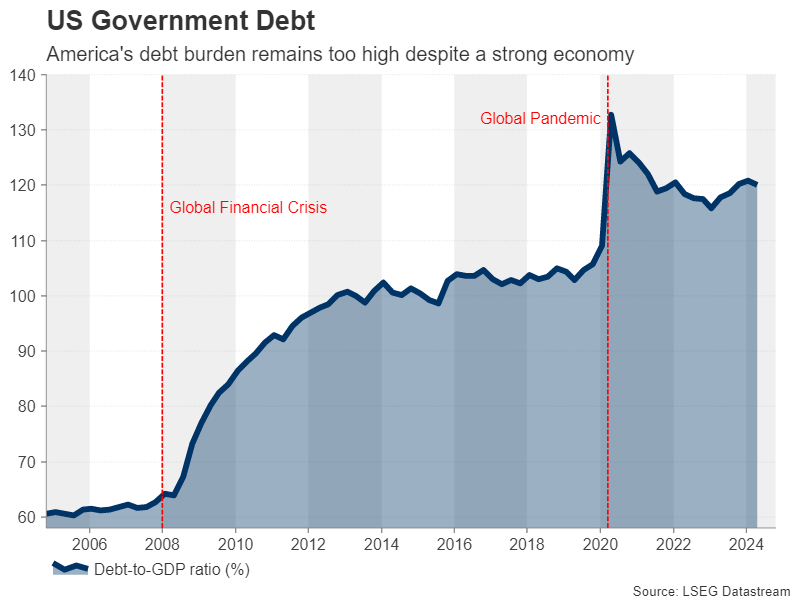
However, should Republicans gain control of both the House and the Senate, Trump would be able to easily push through his proposed tax cuts while slashing spending. But the spending cuts are not projected to match the scale of tax reductions, leading to a worrying rise in the budget deficit at a time when America’s mounting debt level is already more than 120% the size of its GDP.
On the other hand, a ‘Blue Sweep’ by the Democrats is the least likely outcome. Hence, there’s little prospect of Kamala Harris’s plans for higher corporation and capital gains taxes ever seeing the light of day, as Republicans would never support them.
Inflation risk with Trump presidency
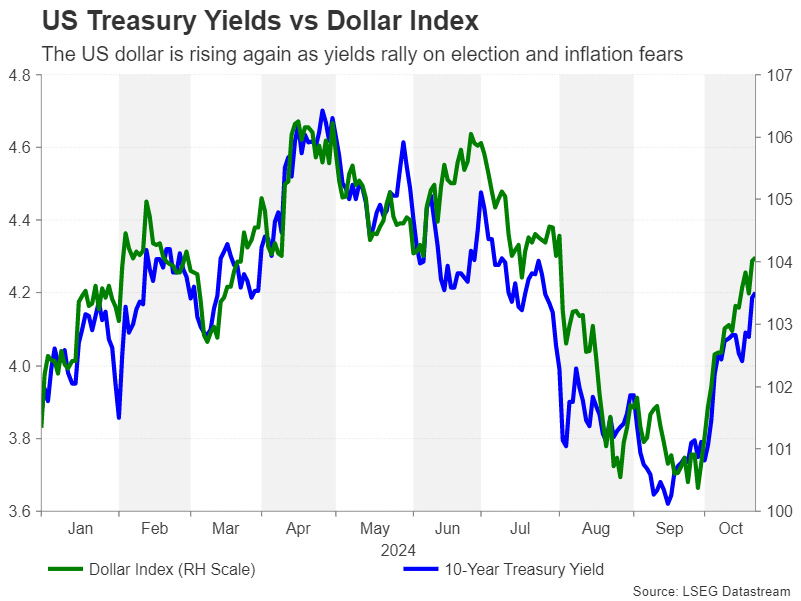
On the whole, though, investor enthusiasm for the Republicans isn’t quite as strong as it was in the previous two elections with Trump as their nominee, primarily due to concerns about US debt and inflation. Trump’s recent revival in the polls triggered a selloff in US and global bonds on the expectation that his policies of higher tariffs and lower taxes would be inflationary while raising government borrowing.
With Treasury yields subsequently surging, the US dollar is strengthening even before Trump has taken office. The longer-term outlook for the greenback is also bullish under a Trump presidency, although it’s likely to be more volatile, especially in the immediate aftermath of the election as investors process the result.
Democrats less of a boost for the dollar and stocks
However, should Harris pull off a win, the initial reaction could be a reversal of the dollar’s latest rally. Its longer-term prospects would also be less bullish than in a Trump presidency, although possibly not as bearish as some of the forecasts suggest. If Harris were to successfully pass most of her proposals for helping low- and middle-income earners, the boost to consumption and therefore to the economy would not be too dissimilar to that from tax cuts.
Risk assets also stand to benefit more from Trump and a Republican-controlled Congress than from a Harris administration, although the picture isn’t so clear. Wall Street would broadly gain from a cut in the corporate tax rate and less regulation. But if the tax cuts fuel inflationary pressures and the situation is made worse by an increase in tariffs, not just on Chinese imports but on all imports, stocks will struggle to rally if higher prices keep the Fed from cutting interest rates.
Energy under the spotlight
However, within the bearish scenario for equities, there are sectors that would probably continue to perform well such as energy and defence.
If Harris were to enter the White House, green energy stocks would likely do better than oil and gas stocks, and the tech sector might benefit too despite the risk of greater regulation. Moreover, the stock market generally would be lifted by Fed rate cuts under the Democrats as inflation and out-of-control borrowing would be less of a threat, while Harris’s more predictable nature compared to Trump’s might also be more positive for Wall Street.
Mixed outlook for commodities
For commodities, there’s no clear-cut outcome either. A stronger dollar under Trump might pressure gold, but the political uncertainty he would generate would surely stoke safe haven demand. If Harris wins, a continuation of gold’s bullish trend is more certain.
Meanwhile, oil would probably enjoy greater demand from a potentially stronger economy if Trump cuts taxes, but greater supply expectations from more drilling could offset some of the gains. Whereas, with Harris, there is some confusion as to how far she would go in opposing new fossil fuel projects and in reality, not much may change from Biden’s policies.
A win-win for cryptos?
One of the biggest reactions to the shifts in opinion polls has been in cryptocurrencies. Trump’s pro-crypto stance threw a lifeline to bitcoin and other digital currencies after the ETF-driven rally faded.
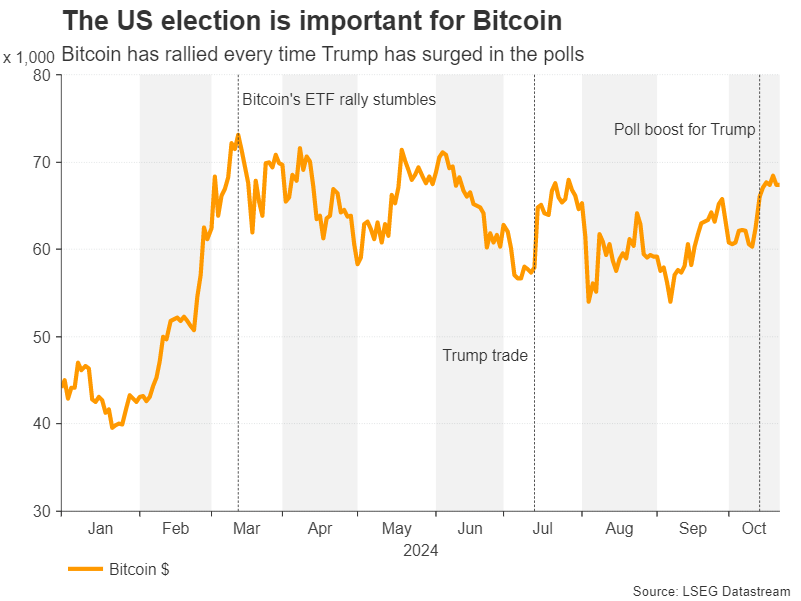
More recently, bitcoin is on the rise again, not just from Trump’s gains in the polls but also from Harris’s plan to introduce a regulatory framework for cryptos. Whilst this may not be as much of a boost to the industry as Trump’s ideas, it would nevertheless increase confidence in digital assets. Thus, it seems that the 2024 election campaign has been broadly positive for cryptos.
Swing states hold the key
As we get closer to Election Day, there is increased focus on the swing states that look set to determine who will get to sit in the Oval Office. The seven swing states are Arizona, Georgia, Pennsylvania, Michigan, North Carolina, Nevada and Wisconsin.
Most polls indicate Trump seems to have an edge in Arizona and North Carolina, and Harris is ahead in Nevada and Wisconsin. Interestingly, Harris’ ability to raise a record amount of funds, far outstripping the donations to Trump, doesn’t appear to be aiding her much in the final days of campaigning. Betting markets and many investors are putting the odds in favour of Trump.
Will Trump challenge the results?
But the polls keep changing day-to-day, making this one of the tightest races ever and raising the prospect of the Trump team contesting the results should Harris win by a very slim margin. This is the worst-case scenario for the markets, one that could drag on for weeks, if not months, creating political uncertainty in the United States at a time of heightened geopolitical tensions globally.