
Sample Category Title
USDCAD Eyes 1.39: Bullish Momentum Builds in Linear Regression Channel
Fundamental Analysis
The Canadian dollar (CAD) is under significant pressure due to the drop in Canada’s annual inflation rate, which fell to 1.6% in September 2024, well below the Bank of Canada's (BoC) 2% target. This price slowdown, primarily driven by the decline in gasoline and transportation costs, has fueled expectations of a 50-basis-point rate cut at the BoC’s next meeting. Additionally, oil prices, which play a key role in the CAD’s value, plummeted more than 7% last week, further impacting the Canadian dollar, which heavily depends on crude export revenues.
In contrast, the US dollar has gained ground, driven by a more resilient economy, reducing the likelihood of aggressive rate cuts by the Federal Reserve. This strengthening of the USD and the expectation of more relaxed monetary policies in Canada have pushed the USDCAD pair above the 1.3800 level. As investors anticipate the BoC rate cut, the CAD will likely weaken in the short term, especially if oil prices remain low and inflation stays below target.
Technical Analysis
USDCAD, H4
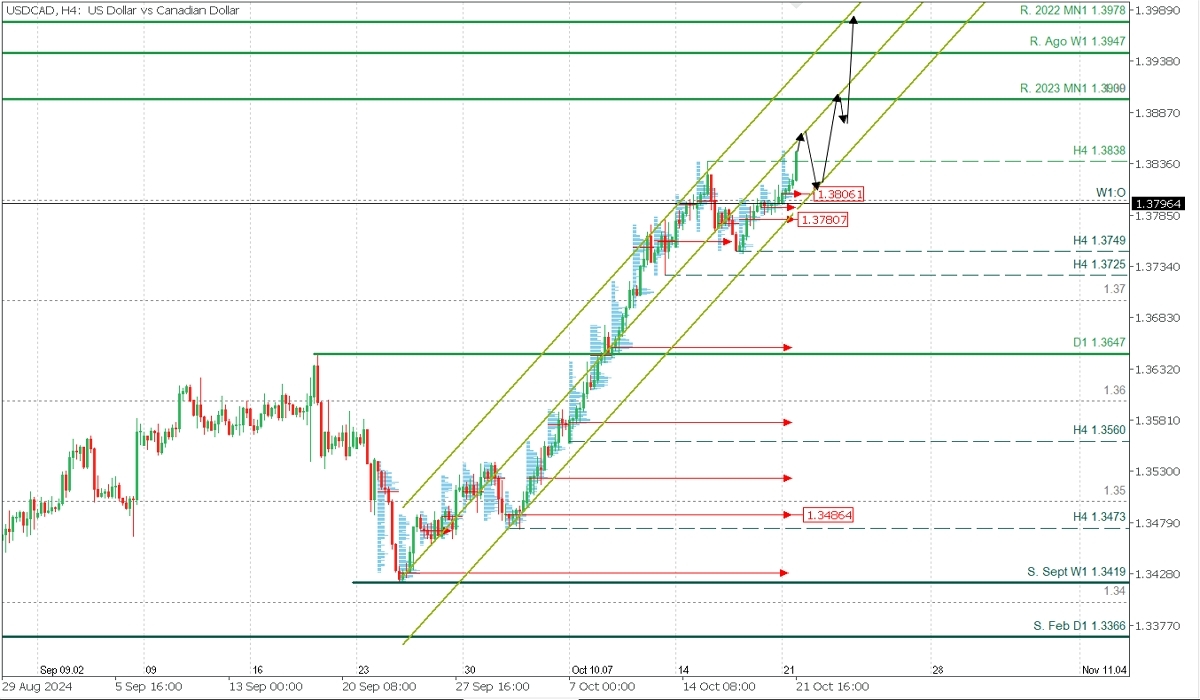
Supply Zones (Sell): 1.39
Demand Zones (Buy): 1.3806, 1.3793, and 1.3780
The pair extends its strength within the bullish linear regression channel, although it is trading near the lower band, which represents the lowest deviation from the regression line (central line) and indicates the minimum expected value within the trend. This suggests that prices have the potential to extend the bullish trend after surpassing the midline towards the 2023 resistance at 1.39 in the short term and breaking the August and 2022 resistances in the medium term.
Additionally, the bullish opening of the week responds to three key demand zones from 1.3780 (uncovered POCs*) up to the opening around 1.3806, implying a broad buying block that will prevent the price from falling below.
The last validated intraday support is at the 1.3749 level, meaning that as long as the price does not break this level in the next correction, the bullish trend will remain active.
Technical Summary
Bearish corrective scenario:
Intraday sells below 1.3855 (after the formation and confirmation of a PAR*) with TP at 1.3825, 1.3815, and 1.3810 on extension. Use a 1% SL of your capital.
Bullish continuation scenario:
Buys above 1.3810/1.3815 (where a PAR* forms and confirms) with TP at 1.3850, 1.39, 1.3950, and 1.3980 on extension. Use a 1% SL of your capital with a low lot size to allow room for movement.
EURSUD Wave Analysis
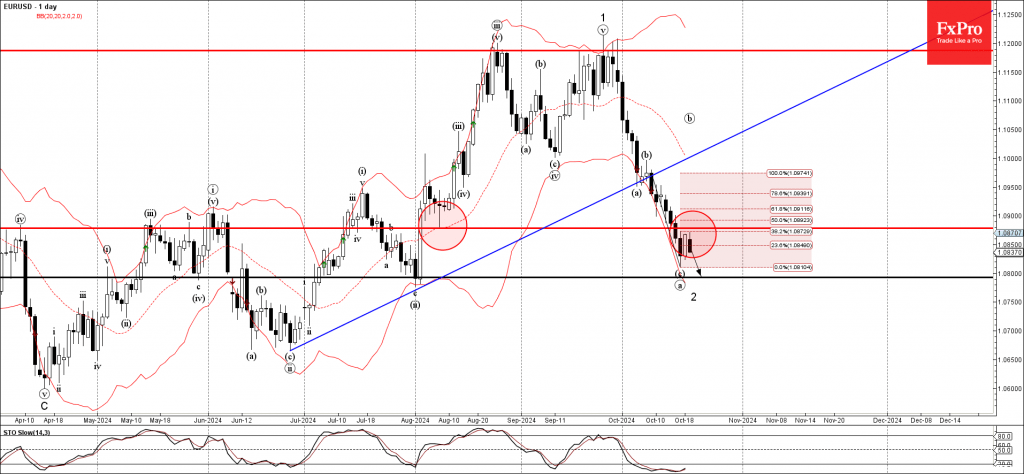
- EURSUD reversed from resistance level 1.0875
- Likely to fall to support level 1.0800
EURSUD currency pair recently reversed down from the key resistance level 1.0875 (former support from the start of August) standing near the 38.2% Fibonacci correction of the downward impulse from the start of this month.
The downward reversal from the resistance level 1.0875 continues the active short-term ABC correction 2 from the end of September.
Given the strongly bullish US dollar sentiment seen across the FX markets today, EURSUD currency pair can be expected to fall further to the next support level 1.0800, former strong support from July.
Silver’s Bounce May Take a Rest Ater 12-year High
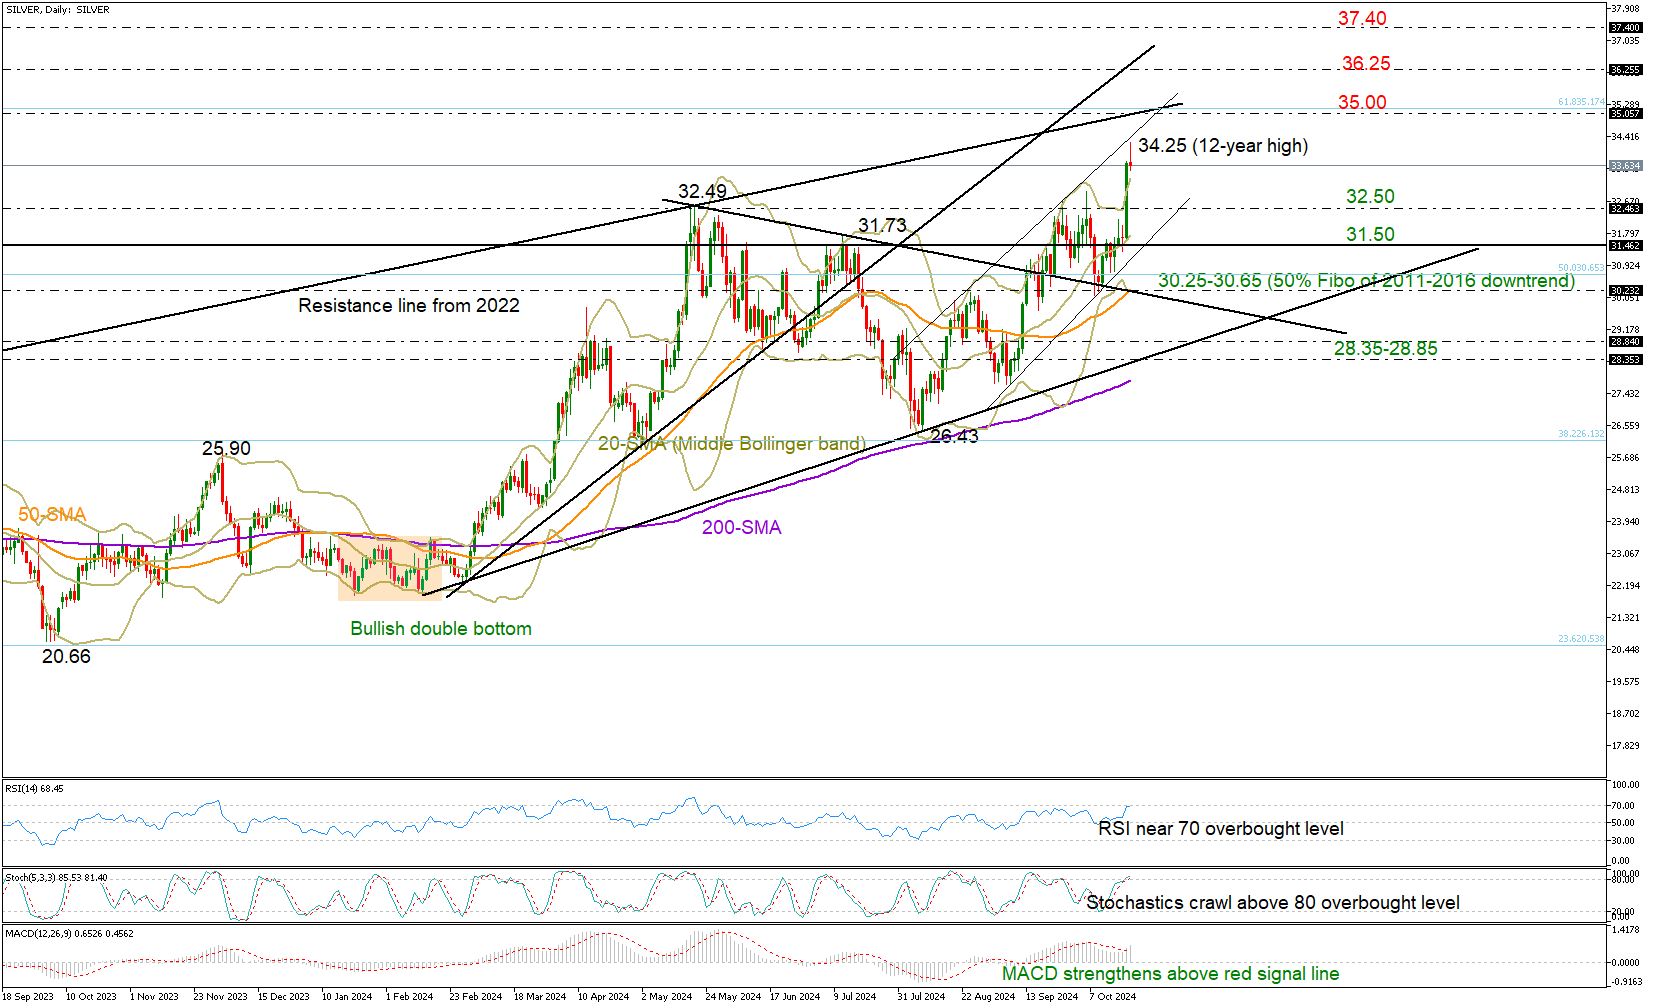
- Silver slides after unlocking an almost 12-year high
- Technical signals suggest rally is overstretched
Silver made some big waves on Friday, and it even found fresh buying interest to run up to 34.25 on Monday – its highest point in nearly twelve years. But now it seems like the bulls might need to catch their breath for a bit.
With the price closing above the upper Bollinger band and the stochastic oscillator flagging overbought conditions, a little pause might be on the horizon.
If not immediately, the bulls could lose pace slightly higher and near the 2022 resistance line at 35.00, where the 61.8% Fibonacci retracement from the 2011-2016 downtrend is sitting. The next obstacle could emerge near 36.25, a break of which could see a continuation towards 37.40 last seen in February 2012.
On the flip side, if downside pressures push the price below 33.00, support could initially develop near 32.50, just ahead of the 20-day simple moving average (SMA) at 31.78. If things really take a turn for the worse and we close under that critical 30.65-31.50 zone – where the 50% Fibonacci retracement is placed –it could upset traders, especially if 30.25 doesn’t hold either. In that case, we might be looking at prices slipping down to the 28.35-28.85 range.
In a nutshell, it seems like silver could be running out of steam soon, if not immediately then possibly somewhere between 35.00 and 36.25.
BoE’s Greene: UK’s consumption puzzle warrants cautious, gradual monetary easing
In an article for the Financial Times, BoE MPC member Megan Greene highlighted the challenges facing the UK’s consumption patterns, describing it as a "consumption conundrum." Despite real incomes rising for over a year and inflation expectations stabilizing near historical averages, real consumption remains only 1.5% above pre-pandemic levels—a situation Greene finds puzzling.
Greene pointed to three main factors likely contributing to the UK’s weak consumption and higher savings rates. Firstly, the cost-of-living crisis, driven by successive shocks like the pandemic and the war in Ukraine, has probably led to an increase in "precautionary savings." Additionally, restrictive monetary policy has weighed on consumption, even as overall household income from interest on savings has risen.
Though it's unclear which of these factors weighs most heavily on consumption, Greene warned of the risks on both sides. Stronger-than-expected consumption could lead companies to pass on higher costs, boosting inflation and requiring tighter monetary policy for longer. Conversely, weaker consumption could lead to below-target inflation, forcing the BoE to implement more rapid rate cuts.
Given these dynamics, Greene advocated for a "cautious, gradual approach" to monetary easing, balancing the need to manage inflation risks while providing support to the broader economy.
Fed’s Logan: Gradual rate reductions expected amid strong economy but risks persist
In a speech today, Dallas Fed President Lorie Logan said that if the economy continues on her expected path, a strategy of "gradually lowering the policy rate toward a more normal or neutral level" would help balance the risks and support Fed’s dual mandate of stable inflation and full employment.
Logan described the US economy as "strong and stable," though she noted that "meaningful uncertainties" remain. Key risks include pressures on the labor market and Fed’s ability to sustainably meet its inflation targets.
Logan also stressed that Fed must "remain nimble and willing to adjust if appropriate".
US 500 Index Little Wobbly Near Record High
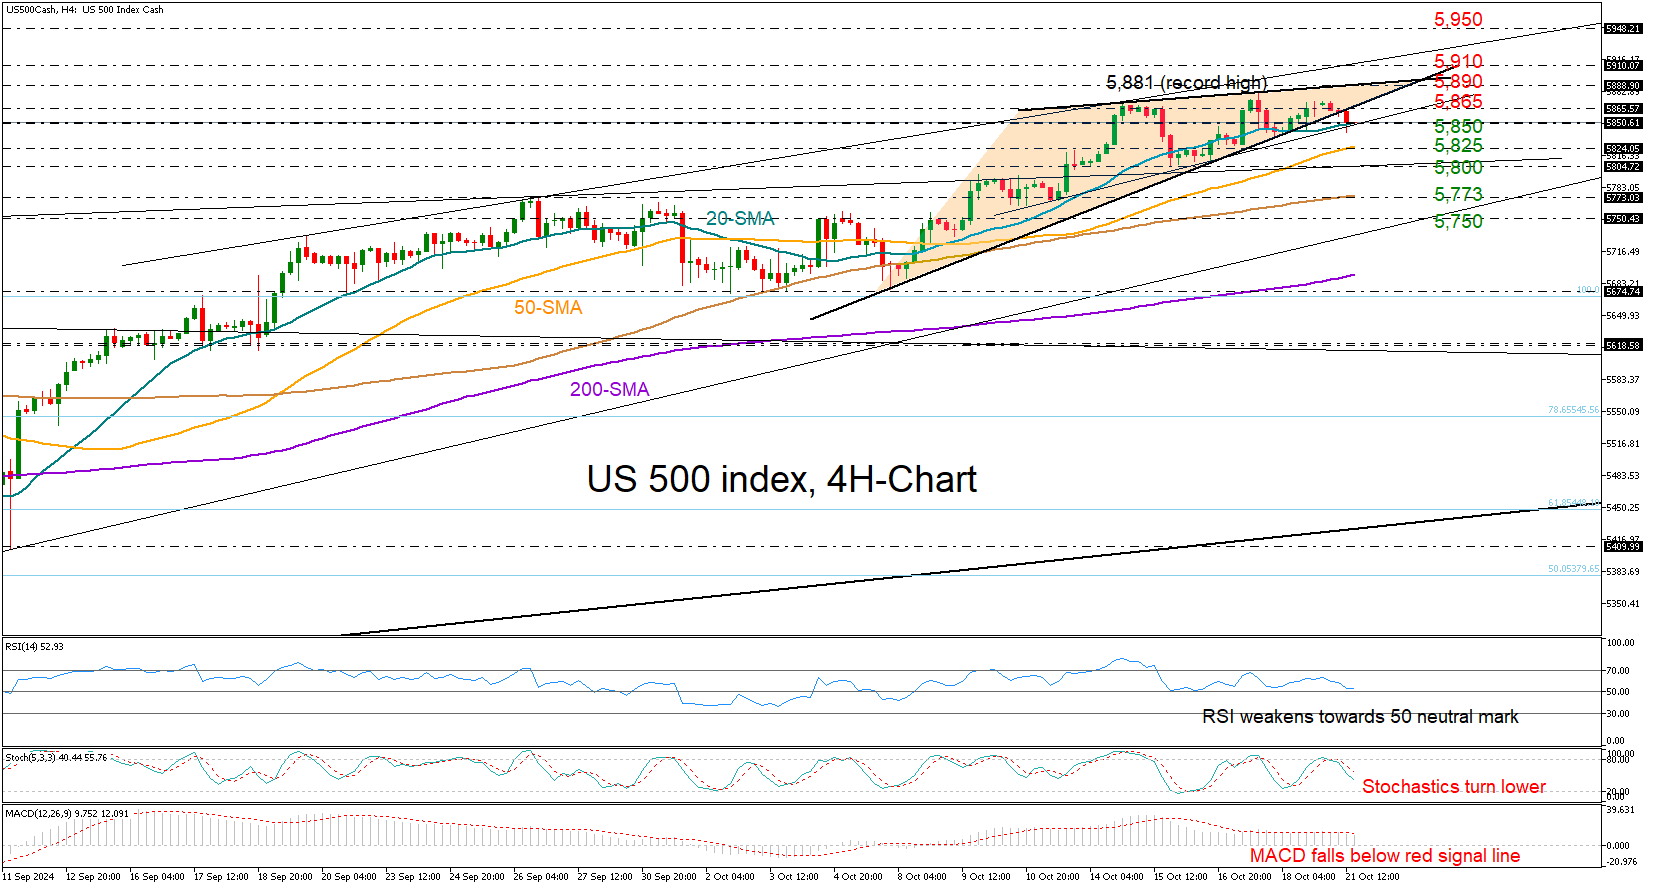
- US 500 stock index loses steam before reaching all-time high
- Technical signals show falling buying appetite; support at 5,850
The US 500 stock index is shaky at the top of its uptrend. It recently lost some momentum, closing below October’s support trendline on the four-hour chart. This might lead to increased selling interest if the price also dips below the 20-period simple moving average (SMA) at 5,850.
With technical indicators pointing to weakening buying enthusiasm, the 50-period SMA at 5,824 could come into play. If we see further losses, the index might find some support around the psychological level of 5,800, followed by the 100-period SMA at 5,773 and the 5,750 mark.
On the bright side, if buyers can push the price back above 5,865, we could see a spirited battle somewhere between 5,890 and 5,910. Investors may keep an eye out for a solid close above 5,950, which could pave the way towards the big milestone of 6,000.
In summary, the US 500 index might be taking a small breather from its record rally in the near term. A dip below 5,850 could be the trigger.
Weak German PPI Send the Euro Back Down
Market picture
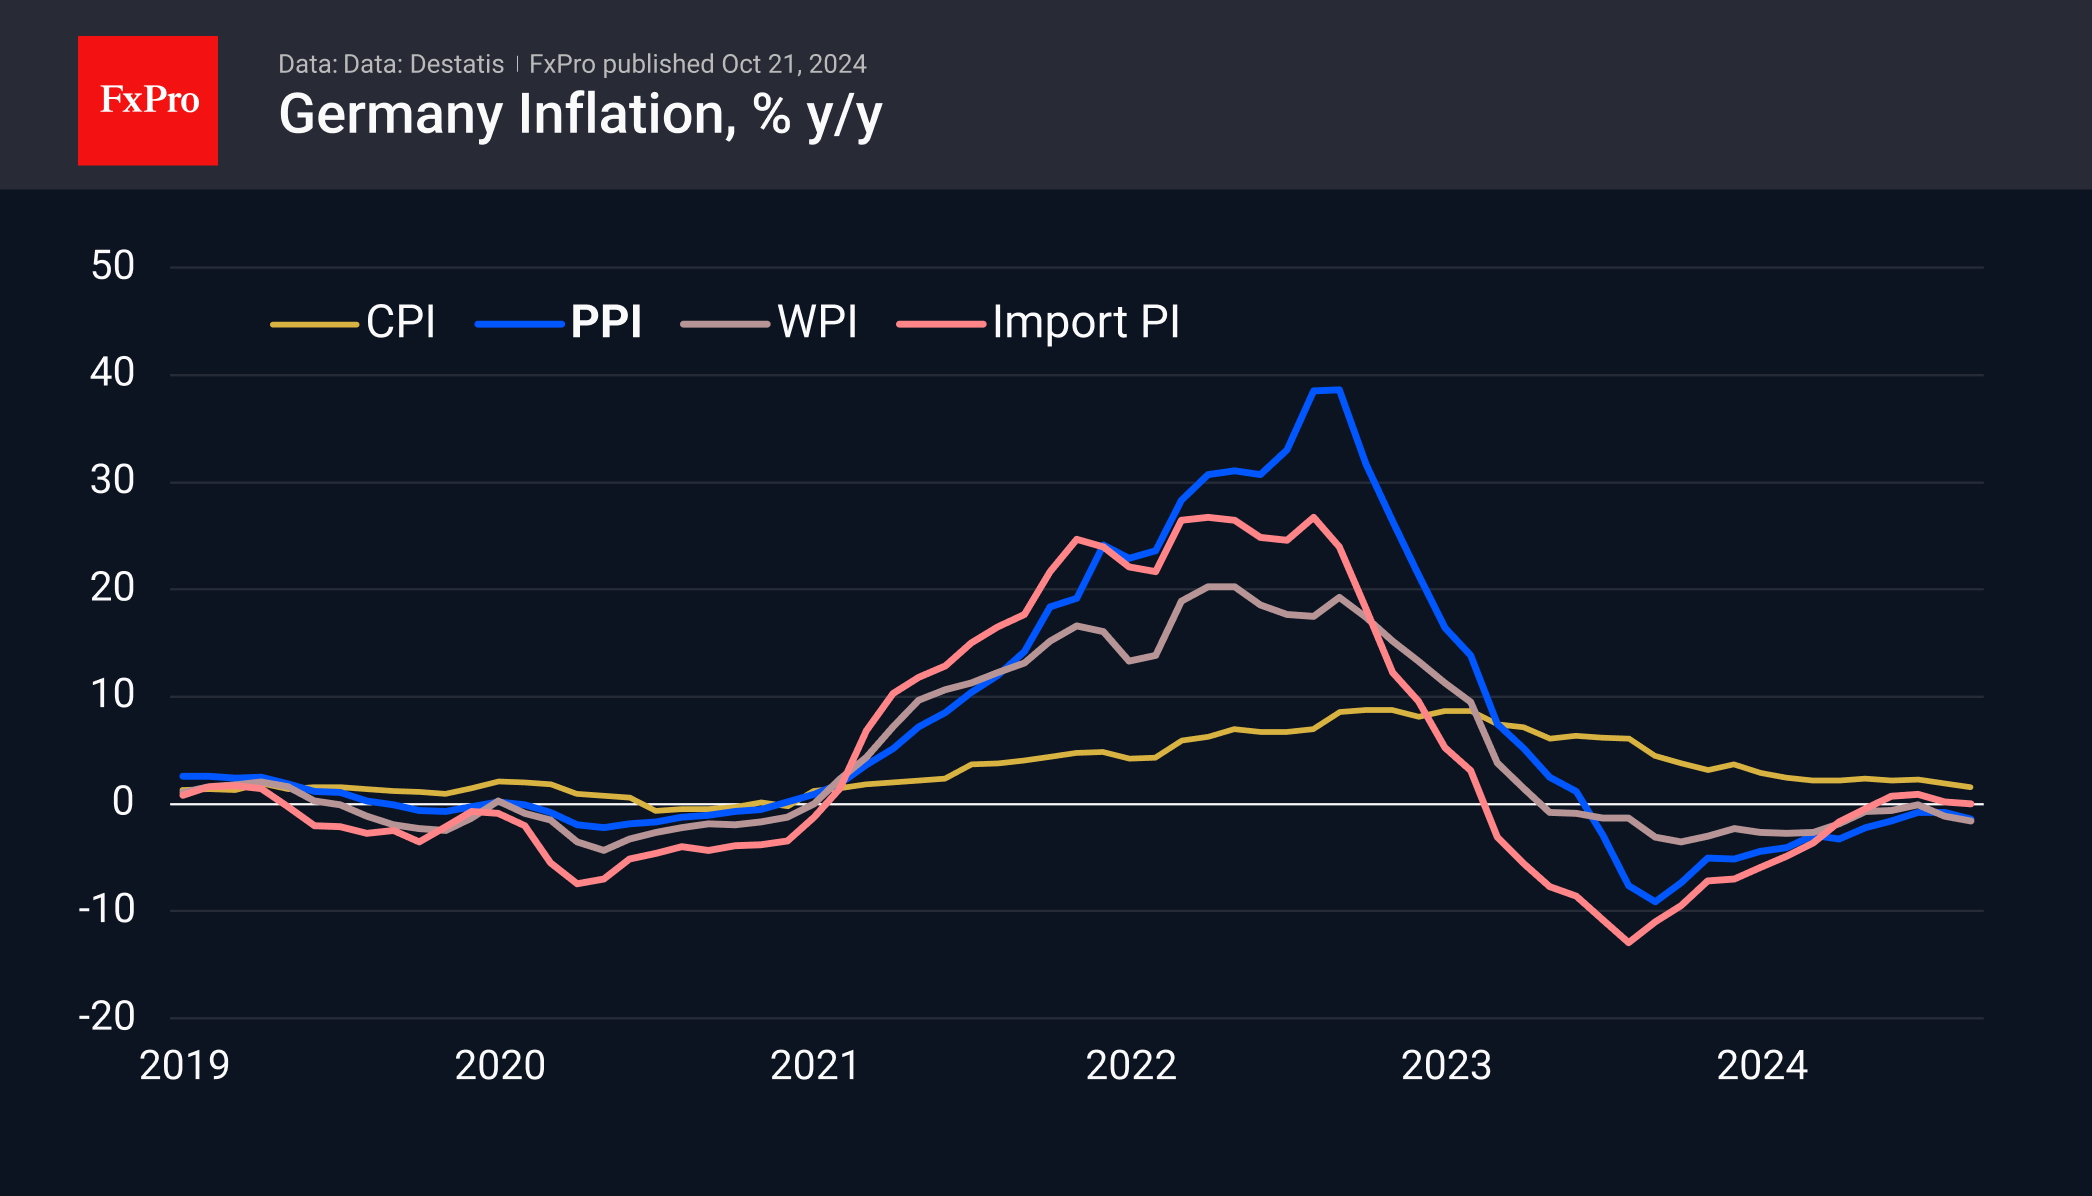
The German Producer Price Index fell more than expected, preventing the EURUSD from extending the rebound seen at the end of last week.
Producer prices in Europe’s largest economy fell 0.5% in September (-0.2% expected), accelerating the annual decline to 1.4% (-0.8% expected) from 0.8% in the previous month. The negative annual growth rate has persisted for the past 15 months, pulling the nominal index back to levels last seen in May 2022.
The weakness in German producer prices puts further active monetary easing in the eurozone back on the agenda. Last week, the ECB cut its key interest rate for the third time this cycle. Soft comments from the bank’s president, Christine Lagarde, sent EURUSD towards 1.08, but a corrective dollar pullback brought the pair back to 1.0870 by early Monday afternoon.
Technical picture
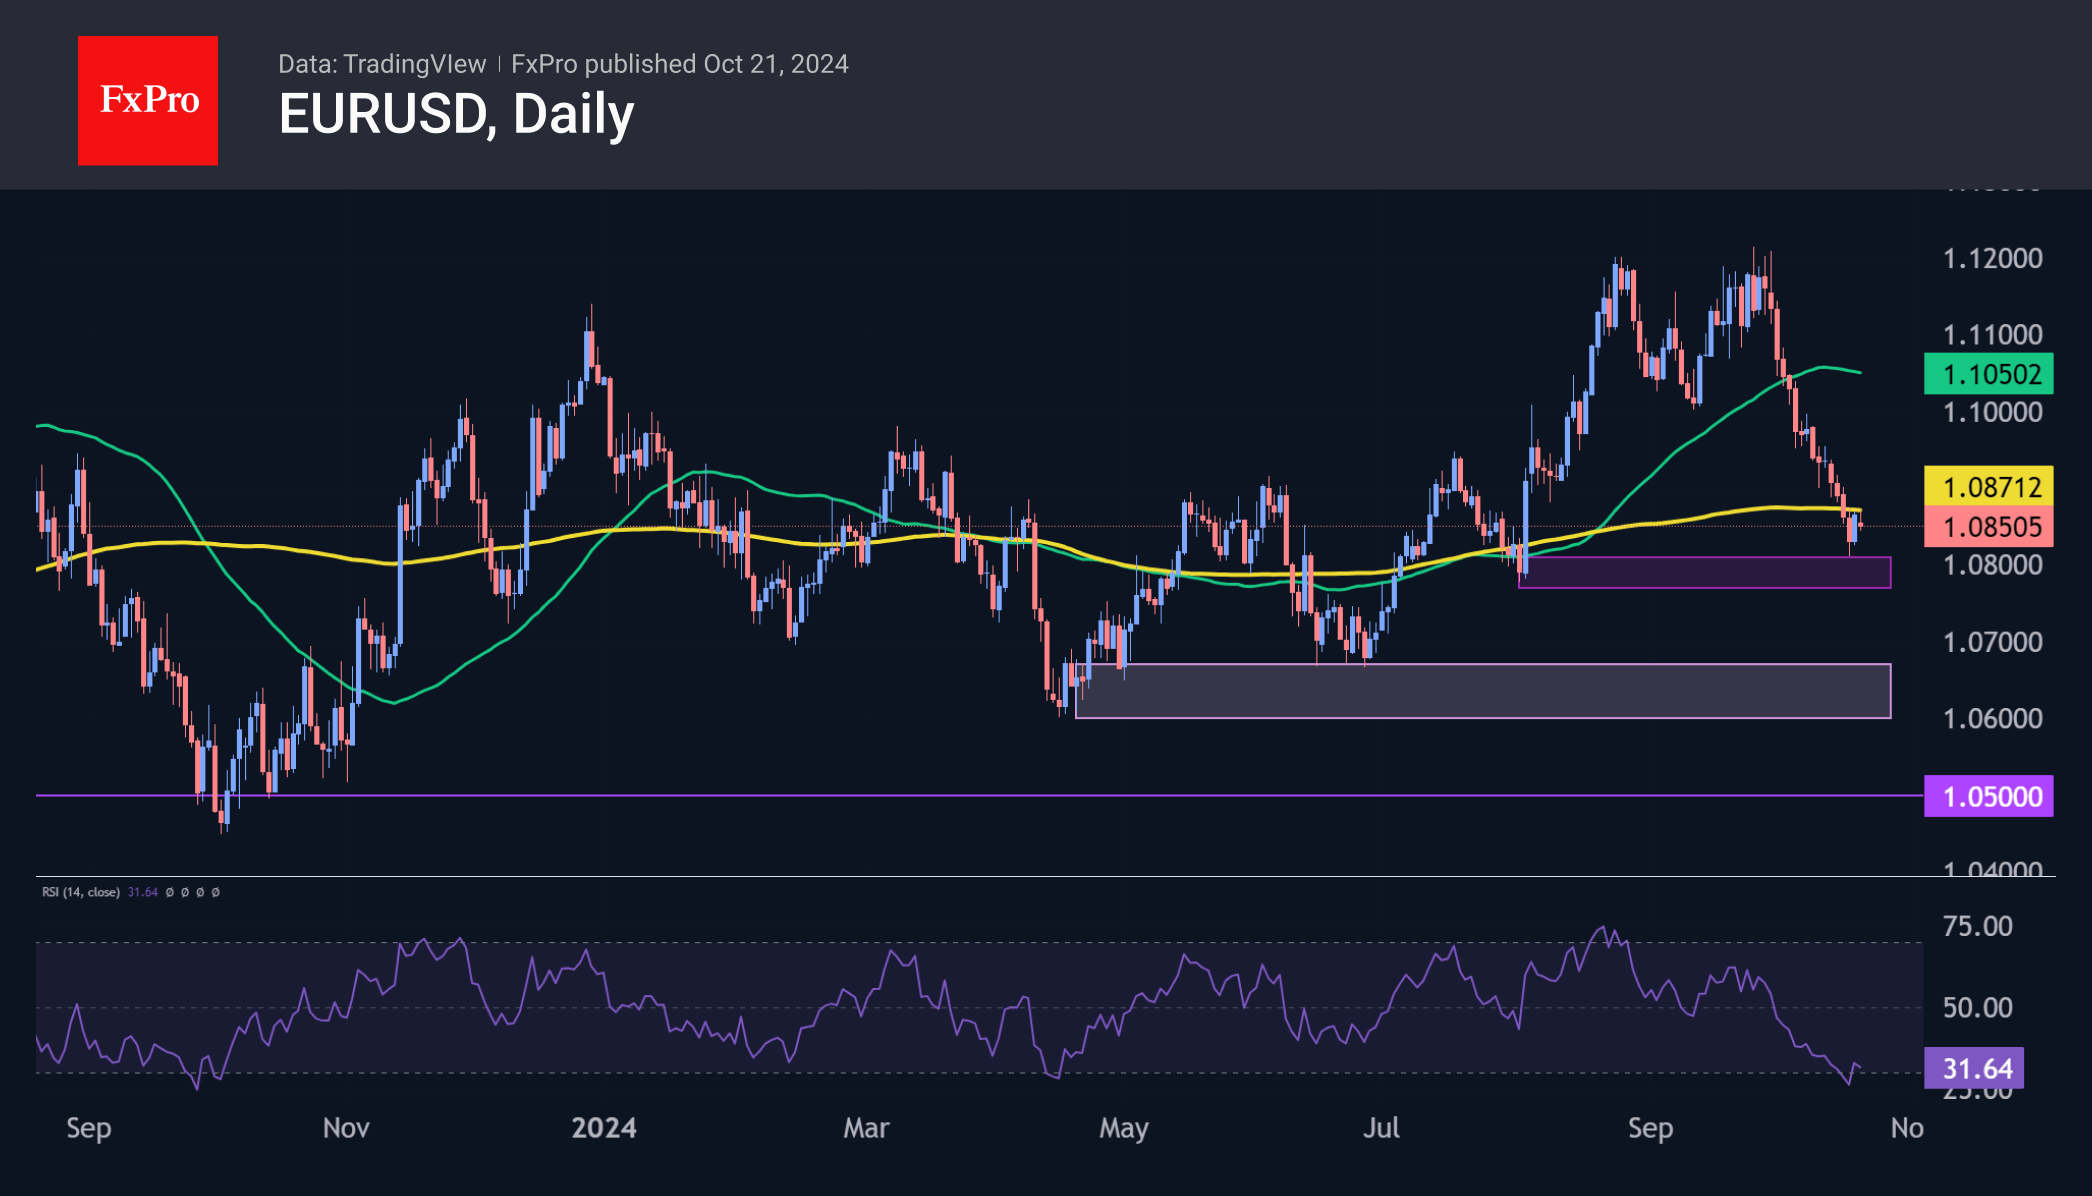
The rally at the end of last week looks like a corrective bounce after the pair had fallen 3.5% from its late September highs. This bounce lost momentum as it ran into the 200-day moving average and unwound what appeared to be overheated selling. The decline at the start of the new week suggests that bearish sentiment is clearly prevailing.
A break below the 1.0770-1.0810 support area would open a direct path to 1.0600-1.0670. If the fundamental background does not change by then, a break to the more fundamental support area—the 1.05 area—is possible.
Silver Rises to 12-Year High
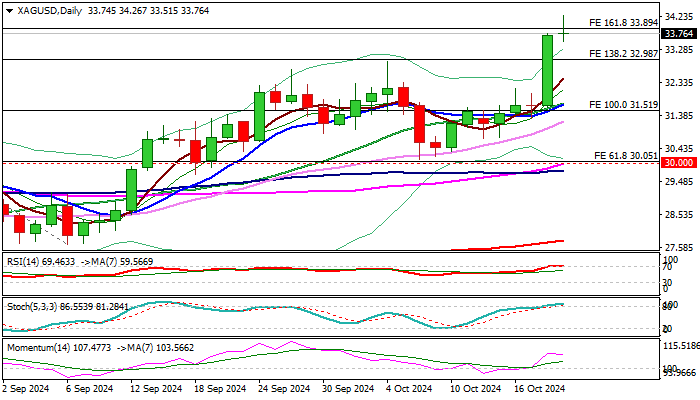
Silver price hit new highest since November 2012 on Monday, in extension of last Friday’s record daily rally of 6.4%, with psychological $34.00 barrier being cracked.
Increased safe haven demand dragged silver price, as geopolitical situation is overheated and markets pricing around 90% chance of Fed rate cut in November FOMC policy meeting.
Strong bullish signal has been generated on monthly chart after bulls eventually broke above key barriers at $30.00/50 (psychological / 50% retracement of $49.78/$11.23, 2011/2020 downtrend) which where the price was stuck for four months.
Firmly bullish daily studies continue to contribute to positive structure, underpinned by favorable fundamentals.
The price is currently riding on extended fifth wave of five wave sequence from $26.39 (Aug 8 low) with FE 161.8% (33.89) being cracked.
Close above this level to verify fresh signal and open way for attack at next targets at $35.00/05 (psychological / Fibo 61.8% of $49.78/$11.23) and $35.369 (FE 200%).
Meanwhile, bulls may take a breather under these barriers as daily studies are overbought, with limited dips to be ideally contained above $32.20 zone and to offer better buying opportunities.
Res: 33.89; 34.26; 35.00; 35.36
Sup: 33.51; 32.95; 32.23; 32.00
USD/CHF Technical Outlook: Pullback Before Continuation?
- USD/CHF is showing potential for bullish continuation.
- The Swiss National Bank may welcome a weaker CHF due to pressure from the swiss export sector.
- Upcoming US data and geopolitical events, including the IMF meeting and US election, could impact USD/CHF.
Eyeing an extended move to the upside as it hovers around a support area on Monday. Safe Haven appeal appears to be keeping the Swiss Franc supported at present as USD bulls eye further gains.
As expectations around Fed policy continue to shift, the CHF and the Swiss National Bank have faced different challenges. After exporters urged the government to do something and the strong CHF, the Central Bank will actually welcome some organic weakness in the CHF.
Switzerland has enjoyed easing price pressures for a while now which have raised expectations for further rate cuts from the Swiss National Bank (SNB). In September, Switzerland’s annual Consumer Price Index (CPI) slowed to 0.8%, the lowest in over three years, even though the Swiss National Bank cut its key interest rates at all three meetings this year.
This could lead to policy divergence if the trend continues and this could weigh on the CHF and thus push USD/CHF higher.
Swiss National Bank Interest Rate Probabilities
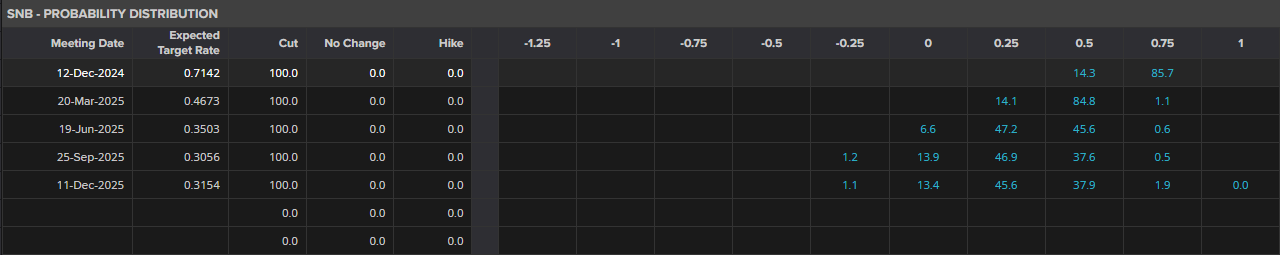
Source: LSEG Workspace
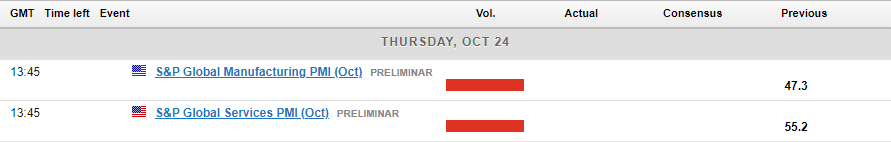
US Data Ahead
There is not a lot in terms of data from the US this week with larger volatility and price swings expected from the IMF meeting in Washington. The meeting will provide a platform for major Central Bank Governors to provide comments and discuss what they see as the path forward.
Geopolitical tensions remain key given the CHF often attracted haven demand. The US election has been adding another layer of uncertainty as it draws nearer.
Technical Analysis
From a technical standpoint, USD/CHF on a weekly chart below finished last week extremely bullish and just a few pips off the weekly high. USD/CHF is experiencing a slight pullback today as it languishes between the inner and outer trendline.
USD/CHF Weekly Chart, October 21, 2024
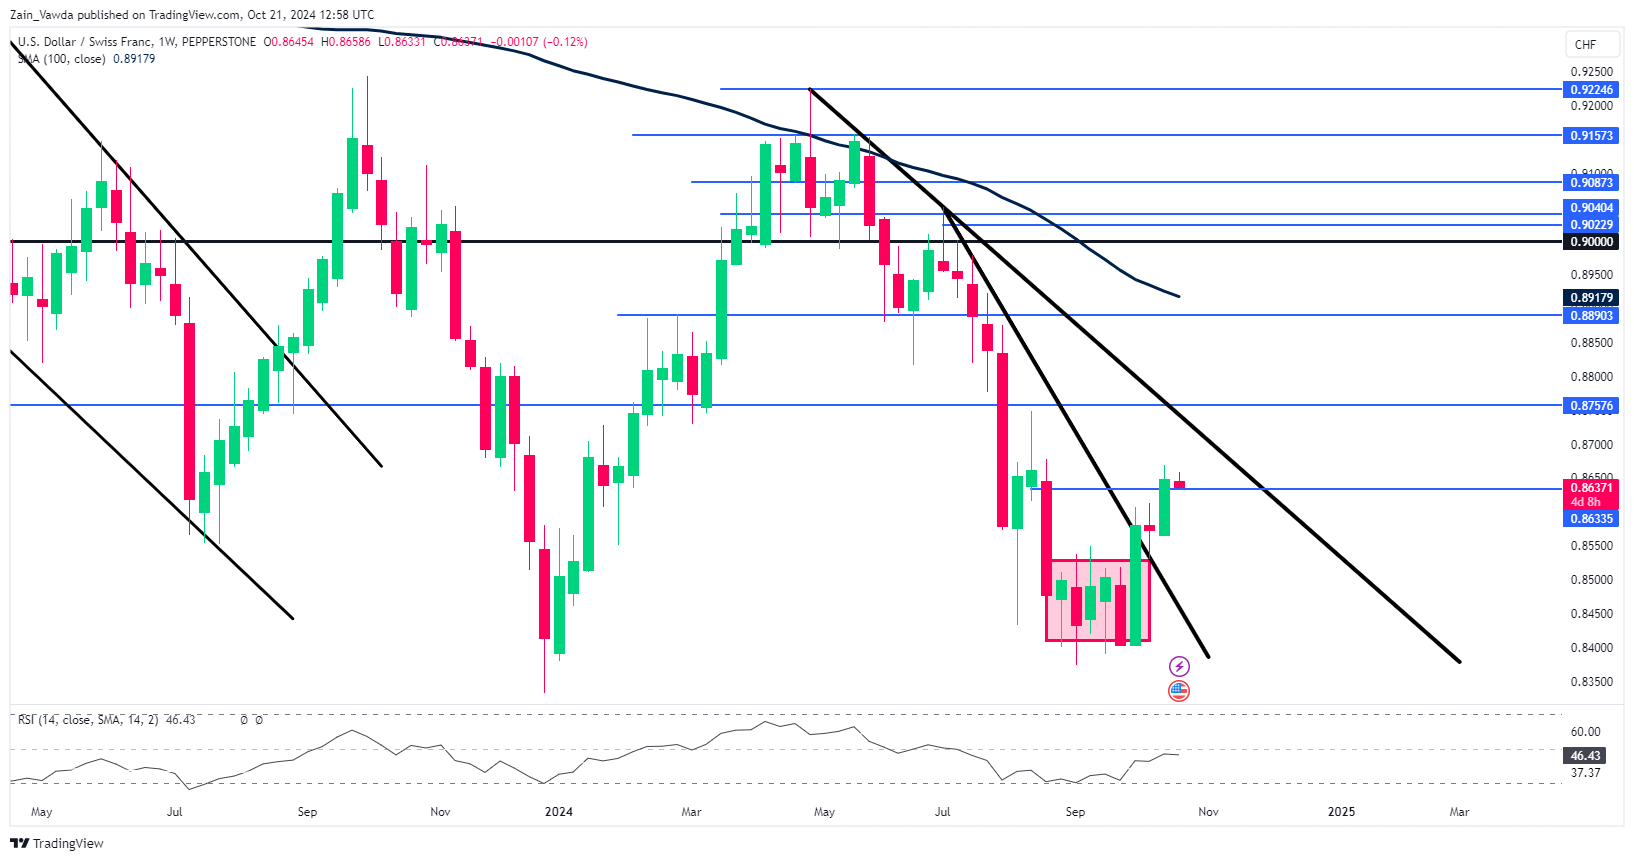
Source: TradingView (click to enlarge)
Looking down to the daily chart below and you can see price is currently resting on the support handle.Immediate resistance rests at 0.8700 which is the 100-day MA before.
A break above this level will finally give the pair a chance to retest the descending trendline. Will we get a break or a bounce?
Now there are other scenarios that may develop depending on external circumstances. There may be a short-term pullback toward 0.8550 support or the 0.8500 handle.
USD/CHF Daily Chart, October 21, 2024
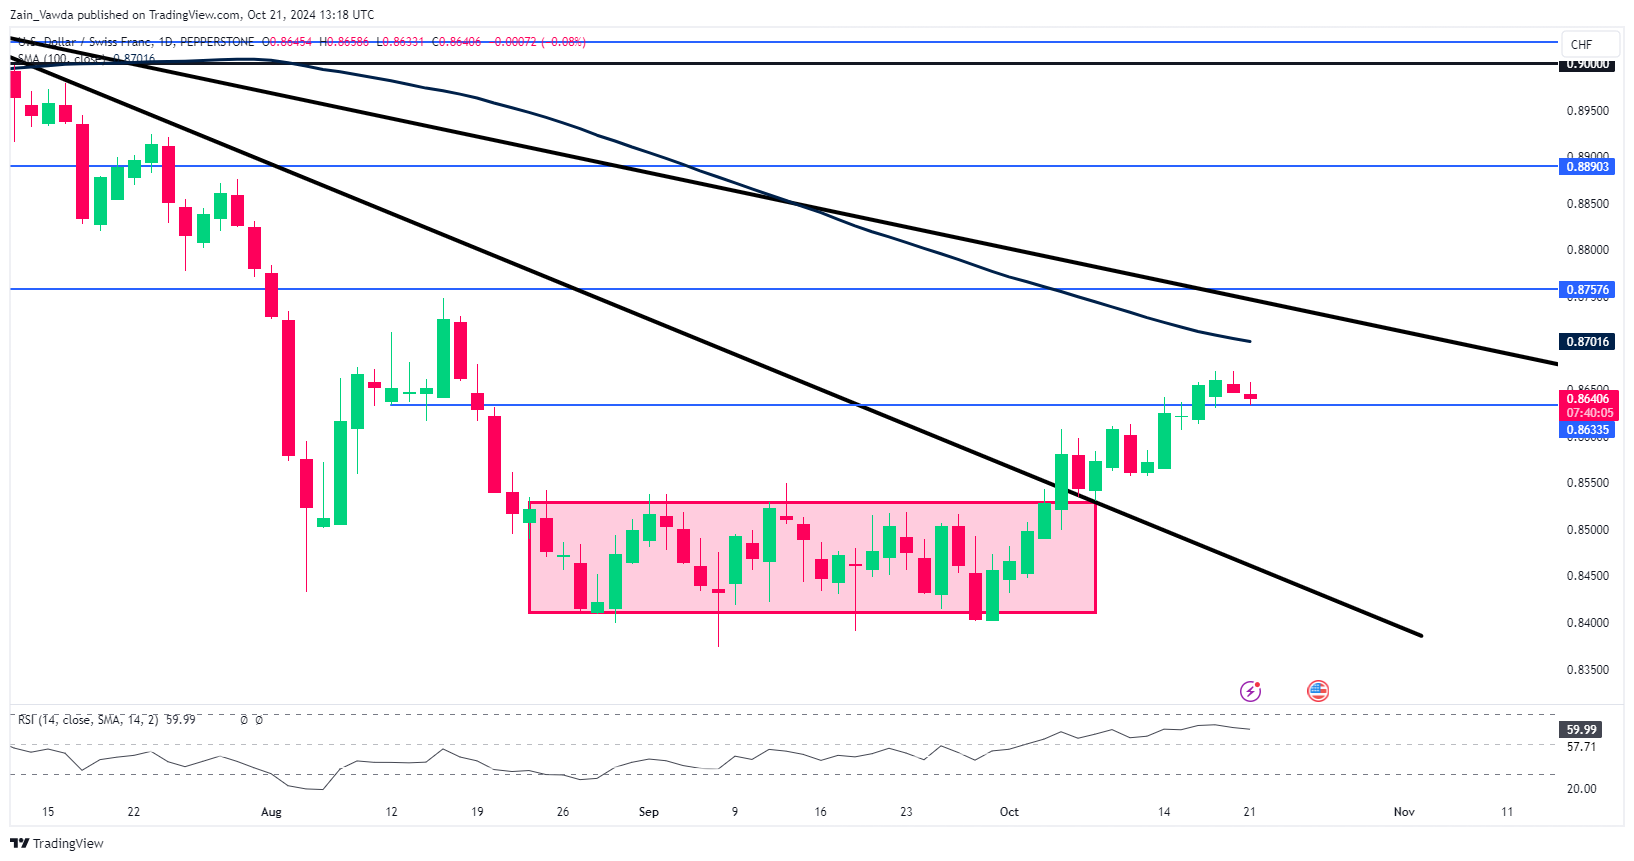
Source: TradingView (click to enlarge)
Support
- 0.8633
- 0.8550
- 0.8400
Resistance
- 0.8700
- 0.8756
- 0.8890