Sample Category Title
EUR/USD Mid-Day Outlook
Daily Pivots: (S1) 1.1024; (P) 1.1054; (R1) 1.1074; More....
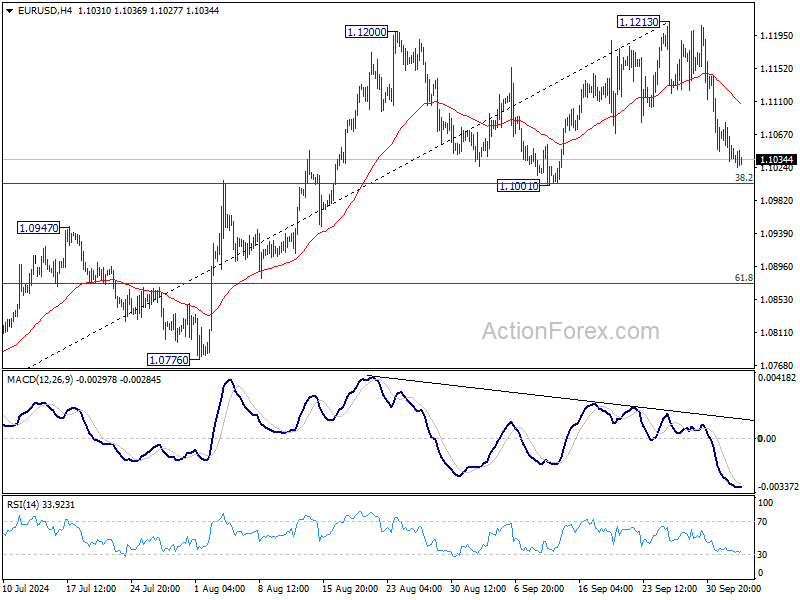
No change in EUR/USD's outlook. Intraday bias stays neutral and further rally is still expected with 1.1001 cluster support (38.2% retracement of 1.0665 to 1.1213 at 1.1004) intact. Break of 1.1213 will target 1.1274 high. However, decisive break of 1.1001/4 will confirm near term bearish reversal. Intraday bias will be turned back to 61.8% retracement at 1.0874.
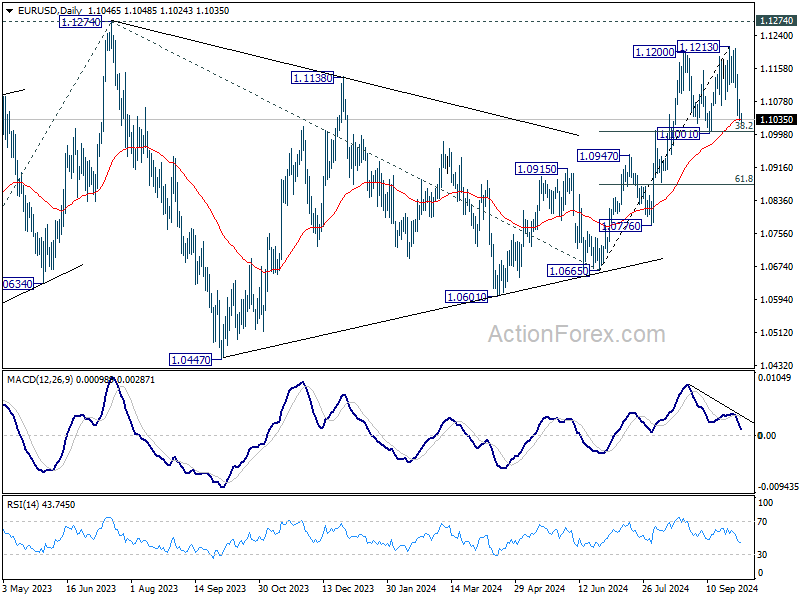
In the bigger picture, corrective pattern from 1.1274 should have completed at 1.0665 already. Decisive break of 1.1274 (2023 high) will confirm resumption of whole up trend from 0.9534 (2022 low). Next target will be 61.8% projection of 0.9534 to 1.1274 from 1.0665 at 1.1740. This will now be the favored case as long as 1.1001 support holds.
USD/CHF Mid-Day Outlook
Daily Pivots: (S1) 0.8459; (P) 0.8483; (R1) 0.8523; More…
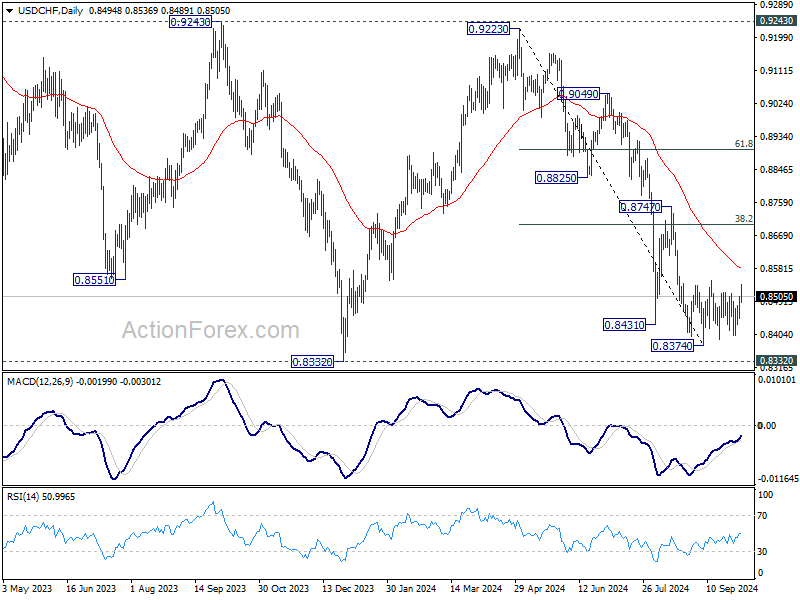
Range trading continues in USD/CHF and intraday bias remains neutral. On the downside, break of 0.8374 will resume the fall from 0.9223 to retest 0.8332 low. Decisive break there will indicate larger down trend resumption. Nevertheless, firm break of 0.8548 will argue that it's correcting whole fall from 0.9223. Intraday bias will be back on the upside for 38.2% retracement of 0.9223 to 0.8374 at 0.8698 at least.
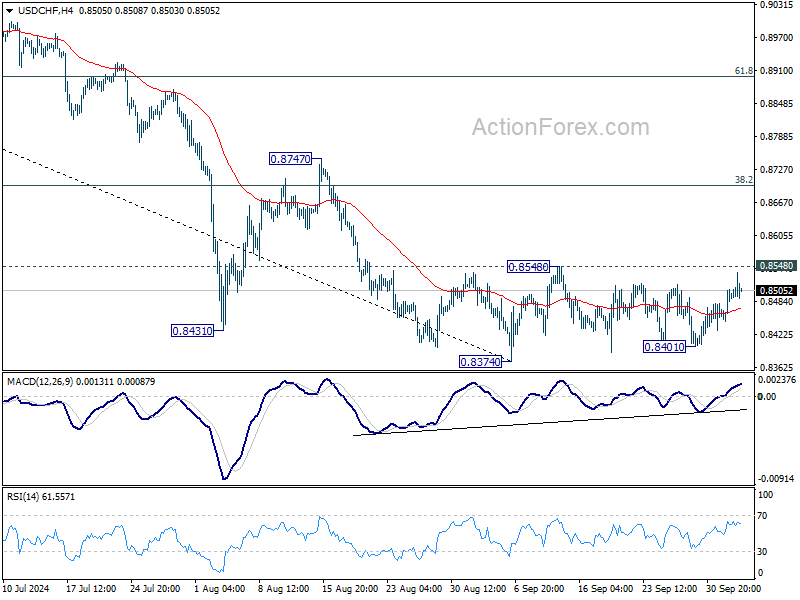
In the bigger picture, price actions from 0.8332 (2023 low) are currently seen as a medium term corrective pattern, with fall from 0.9223 as the second leg. Strong support could be seen from 0.8332 to bring rebound. Yet, overall outlook will continue to stay bearish as long as 0.9243 resistance holds. Firm break of 0.8332, however, will resume larger down trend from 1.0146 (2022 high).
USD/JPY Mid-Day Outlook
Daily Pivots: (S1) 144.41; (P) 145.47; (R1) 147.51; More...
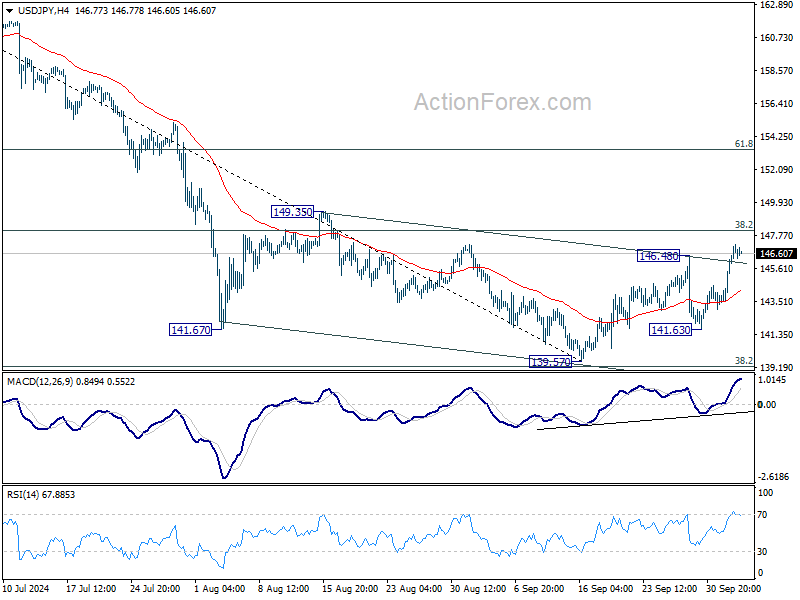
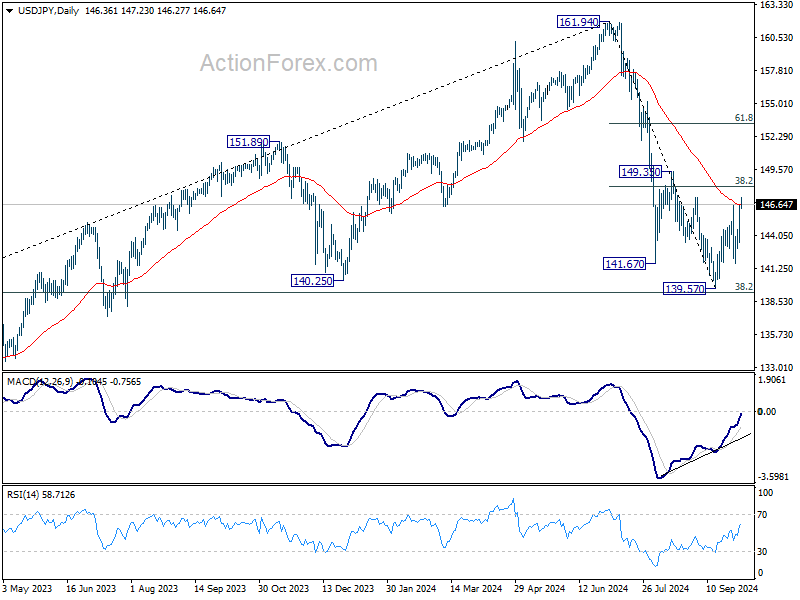
Intraday bias in USD/JPY remains on the upside for the moment. Rebound from 139.57 short term bottom is in progress for 38.2% retracement of 161.94 to 139.57 at 148.11. Decisive break there will argue that whole fall from 161.95 has completed ahead of 139.26 fibonacci level Further rally should then be seen to 61.8% retracement at 153.39. For now, risk will stay on the upside as long as 141.63 support holds, in case of retreat.
In the bigger picture, fall from 161.94 medium term top is seen as the first leg of the correction to whole up trend from 102.58 (2021 low). Strong support could be seen from 38.2% retracement of 102.58 to 161.94 at 139.26 to contain downside, at least on first attempt. Firm break of 149.35 resistance will indicate that the second leg has started. However, sustained break of 139.26 would open up deeper medium term decline to 61.8% retracement at 125.25.
EUR/GBP Mid-Day Outlook
Daily Pivots: (S1) 0.8319; (P) 0.8329; (R1) 0.8335; More...
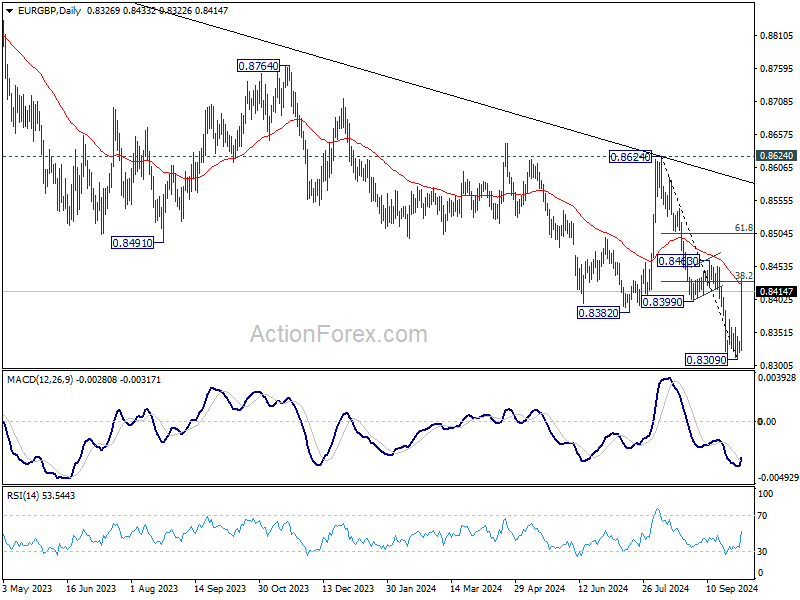
EUR/GBP's strong rebound and break of 0.8370 resistance confirms short term bottoming at 0.8309. Intraday bias is back on the upside. Decisive break of 38.2% retracement of 0.8624 to 0.8309 at 0.8429 will pave the way to 61.8% retracement at 0.8504 and possibly above. On the downside, below 0.8370 resistance turned support will turn intraday bias neutral first.
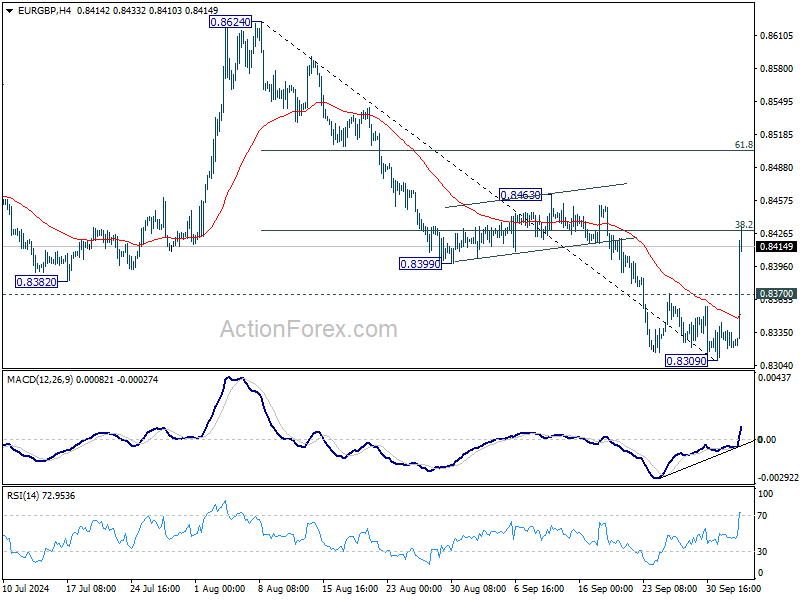
In the bigger picture, down trend from 0.9267 (2022 high) is in progress. Next target is 0.8201 (2022 low), but strong support should be seen there to bring rebound. However, outlook will remain bearish as long as 0.8624 resistance holds even in case of strong rebound.
Pound Dives as BoE’s Bailey Suggests Aggressive Rate Cuts Possible
Sterling fell sharply today after BoE Governor Andrew Bailey surprised markets by suggesting the possibility of aggressive rate cuts in an interview with The Guardian. Market expectations quickly adjusted, with swaps now fully pricing in a 25bps cut in November. The odds of a second 25bps cut in December also surged to 70%, up from 40% just a day earlier.
However, it is crucial to note that while being the face of BoE, Bailey's comments reflect just his personal stance, and BoE’s MPC is known to be divided. The narrow 5-4 vote in favor of the 25bps rate cut back in August highlighted these internal divisions, and future decisions could be just as close. Greater clarity on BoE’s direction will emerge when other influential members of the MPC, such as Deputy Governor Dave Ramsden and Chief Economist Huw Pill, share their perspectives.
Meanwhile, Swiss Franc has shown relative resilience despite softer inflation data. Switzerland’s CPI for September came in lower than expected, marking the weakest inflation reading in over three years. But even without this piece data, SNB is still widely expected to implement another 25bps rate cut in December to 0.75%. The main question now is whether SNB’s terminal rate will go as low as 0.50% or even 0.25%. However, as the pace of rate cuts by ECB and BoE could outpace that of SNB, that would keep Franc relatively stable for now.
Overall in the currency markets this week so far, Dollar is the strongest performer, followed by Loonie and then Aussie. Yen is the weakest, followed by Sterling and then New Zealand Dollar, with Swiss Franc and Euro positioned in the middle.
Technically, AUD/USD's pull back from 0.6941 is accelerating today, with focus now on 0.6823 resistance turned support. Decisive break there will confirm short term topping, and bring deeper correction towards 0.6621 support. The pair's next move would very much depend on how the stock markets performer at the upcoming Asian session, as well as US markets' reaction to NFP tomorrow.

In Europe, at the time of writing, FTSE is down -0.03%. DAX is down -0.72%. CAC is down -1.04%. UK 10-year yield is down -0.0104 at 4.015. Germany 10-year yield is up 0.0468 at 2.144. Earlier in Asia, Nikkei rose 1.97%. Hong Kong HSI fell -1.47%. China was on holiday. Singapore Strait Times fell -0.20%. Japan 10-year JGB yield rose 0.0076 to 0.827.
US initial jobless claims rises to 225k, vs exp 220k
US initial jobless claims rose 6k to 225k in the week ending September 28, above expectation of 220k. Four-week moving average of initial claims fell -750 to 224k.
Continuing claims fell -1k to 1826k in the week ending September 21. Four-week moving average of continuing claims fell -5k to 1829k.
BoE’s Bailey signals potential for "activist" rate cuts as inflation pressures fade
In an interview with The Guardian, BoE Governor Andrew Bailey highlighted that cost of living pressures have not been as persistent as the Bank previously feared, which could open the door for more proactive rate cuts.
He noted that if positive inflation data continues, the BoE may adopt a "more activist" stance on reducing interest rates, which currently stand at 5%.
However, Bailey also pointed to geopolitical risks, particularly in the Middle East, as a threat. "Geopolitical concerns are very serious," he said, acknowledging that ongoing conflicts could add strain to already "stretched markets."
UK PMI services finalized at 52.4, optimism remains amid cooling inflation
UK PMI Services was finalized at 52.4 in September, down from August's 53.7, while PMI Composite declined to 52.6 from 53.8. Despite the slight slowdown, the UK economy remains in positive territory, supported by improving order books and easing inflationary pressures.
Tim Moore, Economics Director at S&P Global Market Intelligence, highlighted that the decline in prices charged within the service sector—an important indicator of domestic inflation—reached its lowest level since February 2021. This cooling inflation is a promising sign for the broader economy, particularly as businesses prepare for the Autumn Budget on October 30th.
Although some service sector firms reported delays in decision-making due to uncertainty surrounding the upcoming budget, a majority (56%) of respondents expect a rise in business activity over the next year, with only 11% forecasting a downturn.
Business optimism saw a modest improvement compared to August, driven by lower borrowing costs, easing inflation, and more clarity on monetary policy expectations.
Eurozone PPI rises 0.6% mom in August, energy prices drive monthly increase
Eurozone PPI rose by 0.6% mom in August, exceeding expectations of 0.3% mom. On a year-over-year basis, however, PPI fell by -2.3% yoy, slightly better than the anticipated -2.4% yoy decline.
Breaking down the monthly data, Eurozone's industrial producer prices showed varying trends across sectors. While intermediate goods saw a slight decline of -0.1% mom, energy prices surged by 1.9% mom, driving the overall increase in PPI. Capital goods prices edged up by 0.1% mom, while prices for both durable and non-durable consumer goods remained stable.
EU's PPI rose by 0.4% mom but was down -2.1% yoy. Among individual countries, Estonia led with a 2.2% monthly increase in industrial producer prices, followed by Greece at 1.7% and Spain at 1.5%. On the downside, Ireland recorded the largest decrease, with prices falling by -3.8%, followed by Lithuania (-1.7%) and Romania (-1.6%).
Eurozone PMI composite finalized at 49.6, all big three economies in contraction
Eurozone PMI Services was finalized at 51.4 in September, down from August’s 52.9. PMI Composite fell to 49.6 from 51.0, both hitting 7-month lows. This marks the first month since December 2023 that all of the big-three Eurozone economies showed signs of contraction.
Spain led with a Composite PMI of 56.3, a 4-month high. However, Italy recorded a 9-month low at 49.7, France fell to 48.6, a 6-month low, and Germany’s Composite PMI dropped to 47.5, a 7-month low.
Cyrus de la Rubia, Chief Economist at Hamburg Commercial Bank, pointed out that service sector growth has slowed across the Eurozone, especially in Germany, Italy, and France, where activity "almost hit a wall".
He added that the decline in new business is a worrying sign, indicating that the service sector will "continue to deteriorate," dragging overall economic growth. With the industry also in contraction, Q3 growth in the Eurozone is expected to be minimal.
On the positive side, service sector operating costs saw their slowest rise since early 2021, and inflation in selling prices is easing. This economic softness strengthens the case for ECB to cut interest rates in October, a possibility ECB President Christine Lagarde has recently hinted at.
Swiss CPI slows to 0.8% yoy in Sep, import product prices plunge -2.7% yoy
Swiss CPI dropped by -0.3% mom in September, falling short of the expected -0.1% mom decline. Core CPI, which excludes fresh and seasonal products as well as energy and fuel, also declined by -0.2% mom. Prices for domestic products fell by -0.2% mom, while prices for imported goods saw a steeper decline of -0.5% mom.
On an annual basis, Swiss CPI growth slowed to 0.8% yoy, down from 1.1% and below expectations of 1.1% yoy. Core inflation eased to 1.0% from 1.1%. Notably, prices for imported goods dropped by -2.7% yoy, down from -1.9% yoy. Domestic product prices remained steady at 2.0% yoy.
The sharper-than-expected slowdown in inflation adds pressure on SNB to consider additional rate cuts. With core inflation and imported goods prices continuing to decline, SNB may need to act to prevent deflationary risks from taking hold in the coming months.
BoJ's Noguchi urges patience before Japan's inflation mindset shifts
BoJ Board Member Asahi Noguchi, a known dovish, emphasized in a speech today that Japanese society still needs "considerable time" to go before fully adopting a mindset aligned with the central bank's 2% inflation target. Noguchi highlighted the importance of BoJ maintaining its accommodative monetary policy until this shift in mindset occurs.
With inflation surpassing the 2% target for over two years and nominal wages rising, Japanese firms are increasingly willing to pass on higher costs through price hikes. However, Noguchi highlighted that real consumption remains weak, as households continue to expect low price growth—a mindset shaped by Japan's prolonged deflationary period.
Japan's PMI services finalized at 53.1, composite at 52.0
Japan’s services sector continued its expansion in September, although growth eased slightly. The final Services PMI was recorded at 53.1, down from 53.7 in August, marking a sustained rise in business activity for all but one of the past 25 months. Composite PMI, which includes both services and manufacturing, stood at 52.0, down from 52.9 in August, remaining above the 50-neutral threshold for the third consecutive month.
Usamah Bhatti, economist at S&P Global Market Intelligence, highlighted that the service sector’s strong performance carried into the end of Q3. The average reading for Q3 (53.5) was largely in line with Q1’s average of 53.4, signaling "sustained growth" in the service economy.
However, the manufacturing sector continued to struggle, weighing on overall private sector performance. While service sector remains a pillar of growth, aggregate new business growth slowed in September, and backlogs of work fell for the fifth consecutive month. The outlook for the wider private sector will depend on how the service economy responds to downside risks, including a stagnating economy.
EUR/GBP Mid-Day Outlook
Daily Pivots: (S1) 0.8319; (P) 0.8329; (R1) 0.8335; More...
EUR/GBP's strong rebound and break of 0.8370 resistance confirms short term bottoming at 0.8309. Intraday bias is back on the upside. Decisive break of 38.2% retracement of 0.8624 to 0.8309 at 0.8429 will pave the way to 61.8% retracement at 0.8504 and possibly above. On the downside, below 0.8370 resistance turned support will turn intraday bias neutral first.
In the bigger picture, down trend from 0.9267 (2022 high) is in progress. Next target is 0.8201 (2022 low), but strong support should be seen there to bring rebound. However, outlook will remain bearish as long as 0.8624 resistance holds even in case of strong rebound.
WTI Oil: Rising Geopolitical Risk Premiums and China Stimulus May Have Created a Medium-Term Floor at US$67.55-65.70
- The recent sell-off of 18% in WTI crude oil since August has stalled.
- An increase in hostilities in the Middle East and impending fiscal stimulus measures from China are likely to trigger a medium-term trend change in oil prices.
- Technical factors suggest a further potential rebound in WTI crude oil towards the next medium-term resistance zone at US$78.30/80.30.
In the past two months since the start of August, the price actions of West Texas Oil CFD (a proxy of the WTI crude oil futures) have plummeted more than expected in our prior report, breaching below the US$73.15/barrel level (a major “Symmetrical Triangle” range support from 20 March 20230 low) and tumbled by 18% to print a low of $65.65 on 10 September 2024.
The recent bout of sell-off in oil prices has been attributed to the OPEC+ change in inventory management strategy announced in June, a shift away from targeting US$100/barrel to restore its prior supply cuts by hiking production from September to until late 2025, which would boost oil output by more than 2 million barrels per day, in turn, to negate its declining market share lost to US shale gas producers.
In addition, China’s recent lackluster economic data in the past month ranging from inflation, retail sales, industrial production, manufacturing, and services PMIs have increased the odds of a deflationary spiral unfolding that eventually will reduce oil demand in China, a major consumer of energy products.
Increasing hostilities in the Middle East and China’s impending fiscal stimulus are the game changer
In a desperate attempt to reverse the deflationary spiral in China from being entrenched, China’s top policymakers have shifted gears from piecemeal stimulus measures enacted in the past two years to more forceful accommodating monetary policy (a series of simultaneous rate cuts on its key interest rates and banks’ reverse requirement ratio were announced last week) coupled with clear guidance from September’s Politburo meeting statement that “vowed” to stop the decline in China’s real estate market, a hint that more expansionary fiscal policies are in the pipeline to target consumer spending and confidence directly.
These potential moves by Beijing increased the chances of reflating China’s economy, which will likely boost oil demand as internal demand improves in China.
The second conduit to put a floor in the current spate of oil weakness is via the supply side. Tuesday, 1 October Iran’s missile strike on Israel sparked an increase in hostilities in the Middle East as Israel may consider an option to stage an attack next on Iran’s oil and gas assets as well as its nuclear facilities which can trigger major oil supply disruptions.
MACD trend indicator of WTI crude oil has turned bullish
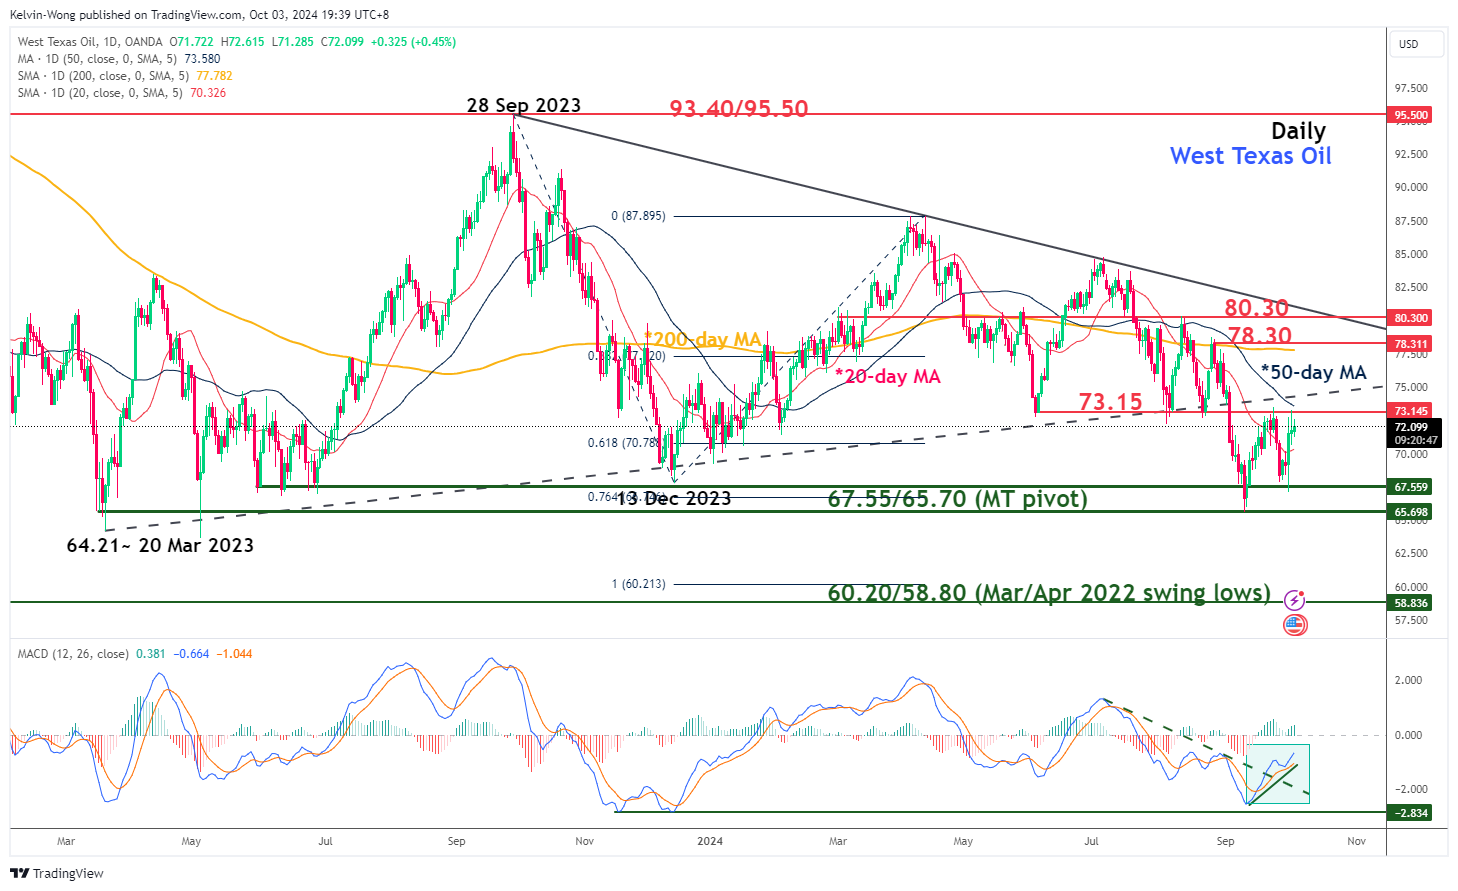
Fig 1: West Texas Oil CFD medium-term trend as of 3 Oct 2024 (Source: TradingView, click to enlarge chart)
The daily MACD trend indicator of West Texas Oil CFD (a proxy of the WTI crude oil futures) has shaped a higher low on 30 September and staged a bullish breakout from its prior parallel descending resistance in place since 5 July (see Fig 1).
These observations suggest that the bearish momentum of the recent price decline from 5 July to 10 September has been eased; increasing the odds of a trend change at least in the medium-term horizon (multi-week).
Watch the key medium-term pivotal support at US$67.55/65.70, and clearance above the US$73.15 intermediate resistance (also the 50-day moving average) may spark a potential rebound towards the next medium-term resistance zone at US$78.30/80.30 (also the 200-day moving average).
On the flip side, failure to hold at US$67.55/65.70 invalidates the bullish scenario to continue the potential impulsive down move sequence to expose the next medium-term support at US$60.20/58.80.
US initial jobless claims rises to 225k, vs exp 220k
US initial jobless claims rose 6k to 225k in the week ending September 28, above expectation of 220k. Four-week moving average of initial claims fell -750 to 224k.
Continuing claims fell -1k to 1826k in the week ending September 21. Four-week moving average of continuing claims fell -5k to 1829k.
Crypto Market Still Falling, But Bitcoin Already Stabilised
Market picture
The crypto market lost another 1.44% of its capitalisation in 24 hours to $2.13 trillion. The pressure is due to the ongoing wave of dollar gains and declines in risk assets due to the medium-term impact of the Middle East conflict and short-term profit-taking ahead of the US jobs report. The Sentiment Index returned to fear territory, falling to 37, a two-week low.
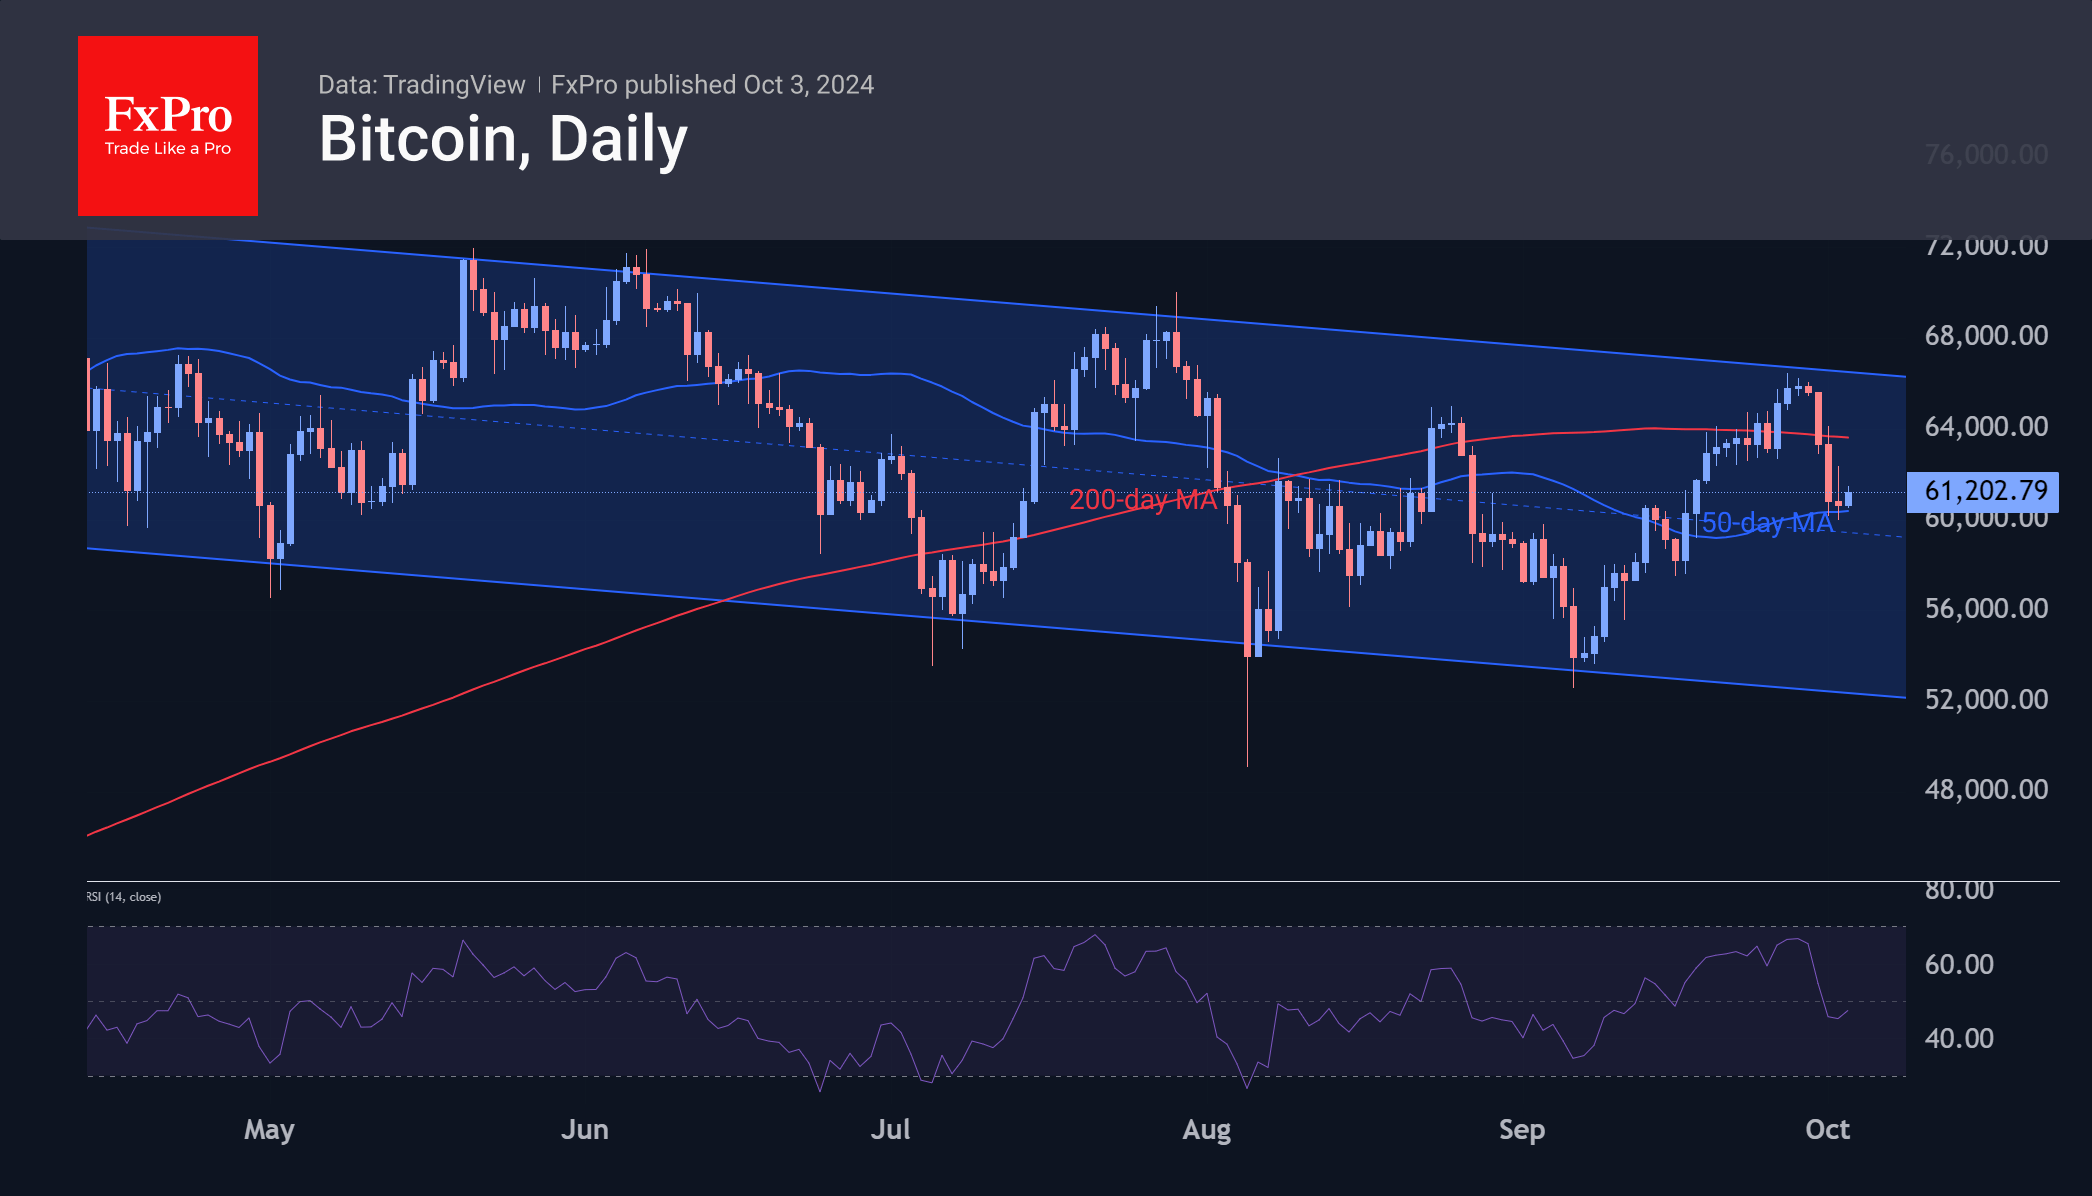
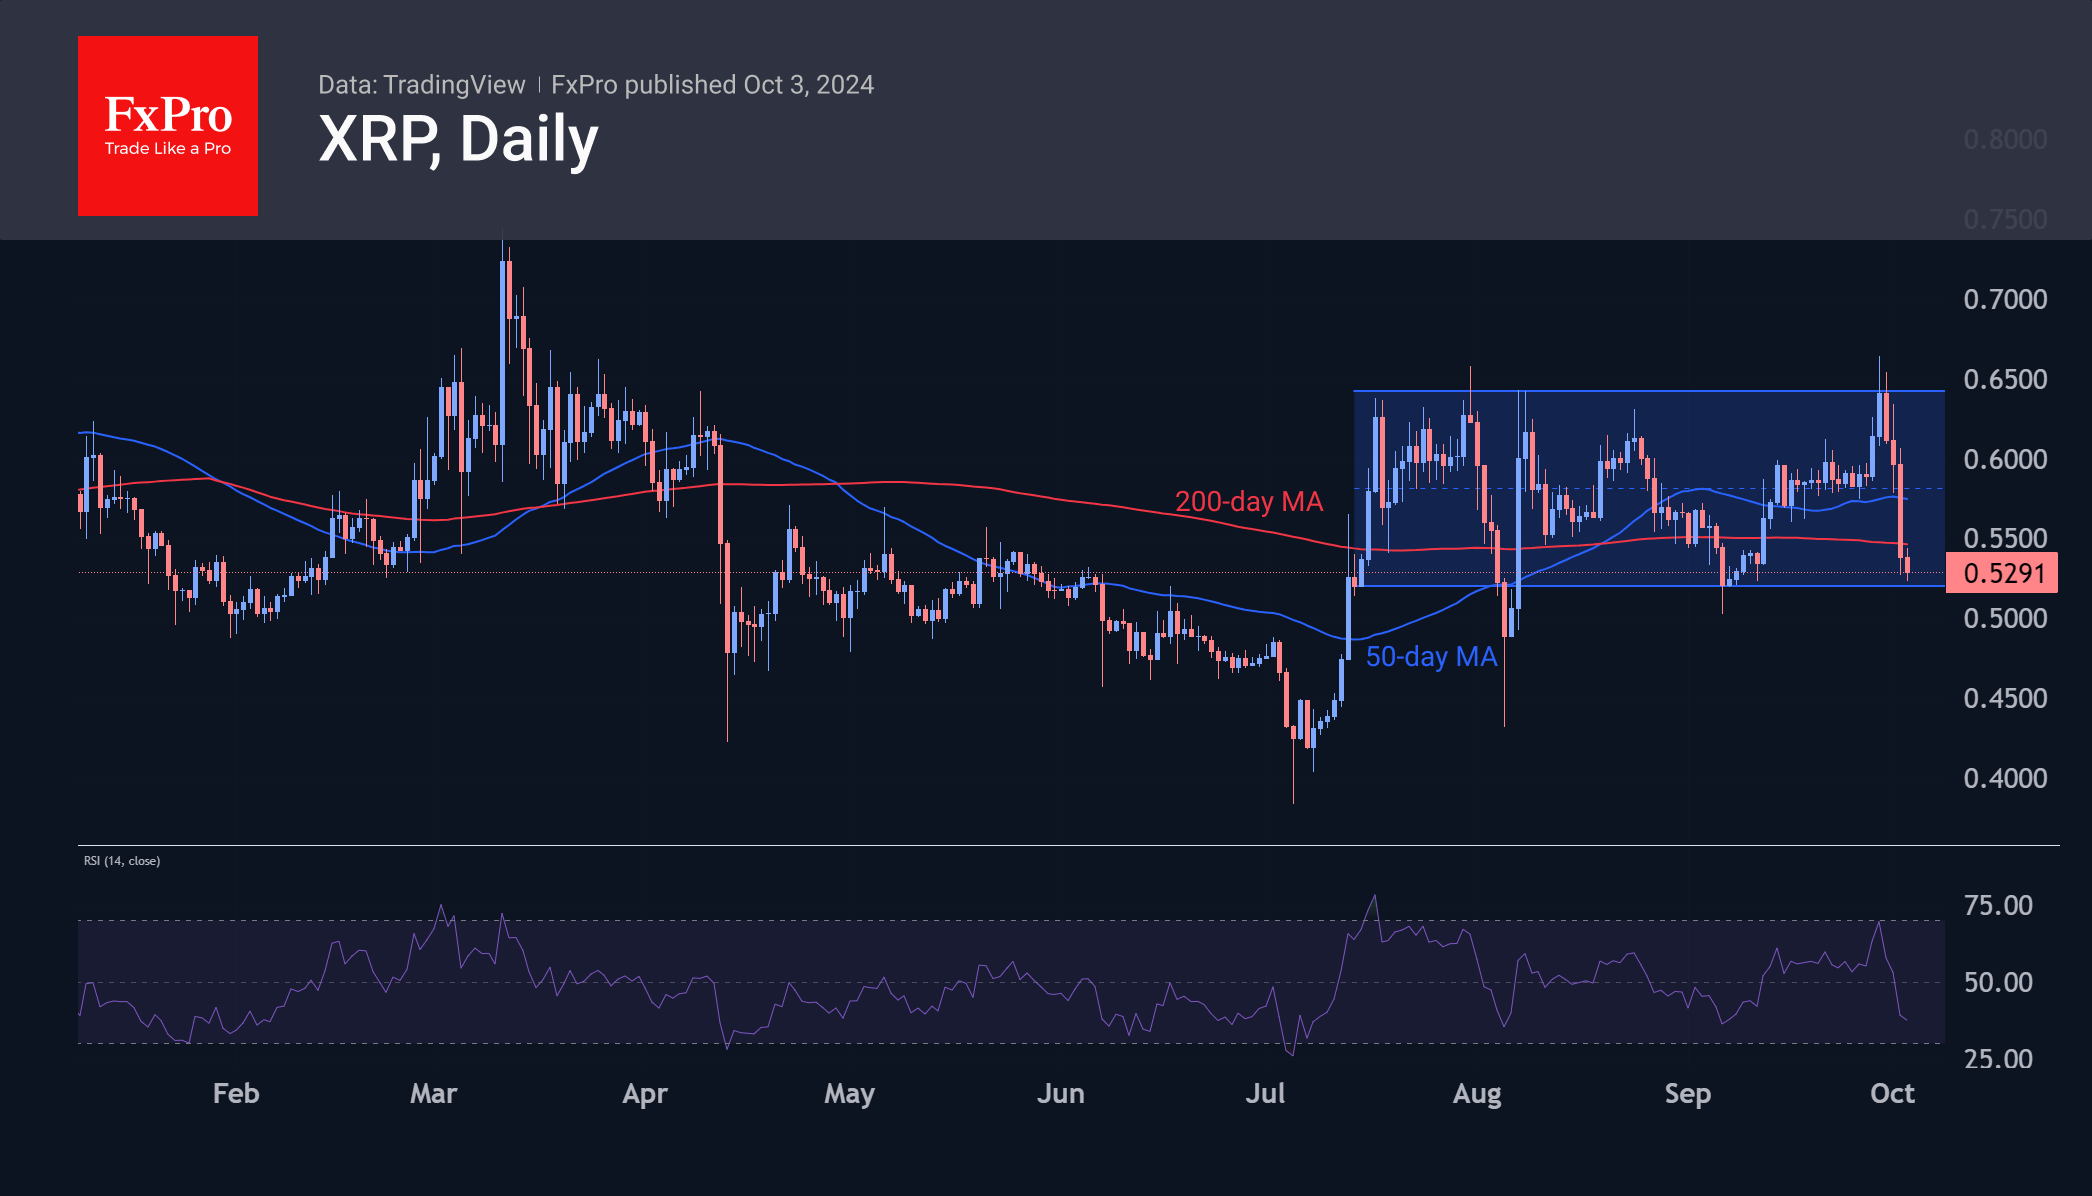
Bitcoin found support on the decline towards the 50-day moving average and the $60,000 area. Over the next two days, swings within the $60-63.6K area could be misleading market noise as the market awaits new information.
XRP, which has lost around 20% in four days, is failing to find support. Despite the news of the ETF application, the coin fell from the upper boundary of the sideways range to the lower boundary. On Wednesday, it broke the 50—and 200-day moving averages in one fell swoop, pulling back below $0.53. A breakout of the range with a confirmation below $0.50 could trigger a drop to $0.40.
News Background
According to CryptoQuant, the growth of stablecoin capitalisation in August-September may prolong the upward trend of cryptocurrencies. In two months, the figure rose by $8.73 billion to $172.75 billion, with the USDT balance on CEX reaching a record $22.5 billion.
A BTC rally is inevitable if its post-halving pattern remains relevant, reports Canaccord. According to historical patterns, bull rallies have occurred 6-12 months after the halving, with ATH forming another 2-6 months later.
According to The Block, bitcoin miners’ revenues fell to $815.7 million in September, the lowest since the beginning of the year. JPMorgan calculates that miners’ gross profit per mined block was down 6% from August.
Bitwise, a digital asset manager, filed to launch a spot exchange-traded fund based on XRP. The news did not lead to a significant reaction in XRP. The Ethereum example shows that launching an ETF does not guarantee exceptional growth.
Dogecoin was conceived as a joke, but 11 years later, the token has become popular with merchants to pay for purchases, according to Bloomberg. The average fee on the network is <$0.01, around 79 times cheaper than the bitcoin blockchain. Transactions are processed in less than a minute.
GBP/USD Outlook: Cable Falls to Three Week Low on Dovish Steer in Rate Outlook
Cable remains firmly in red and accelerated lower on Thursday morning, falling over 1% for the session.
Sterling came under increased pressure from dovish comments from BoE Governor Bailey, who said the central bank could be more aggressive on rate cuts, adding to expectations for 25 basis points cut at the November 7 policy meeting.
Weaker than expected UK September Services PMI (52.4 vs 52.8 f/c and 53.7 Aug) contributed to pound’s bearish stance.
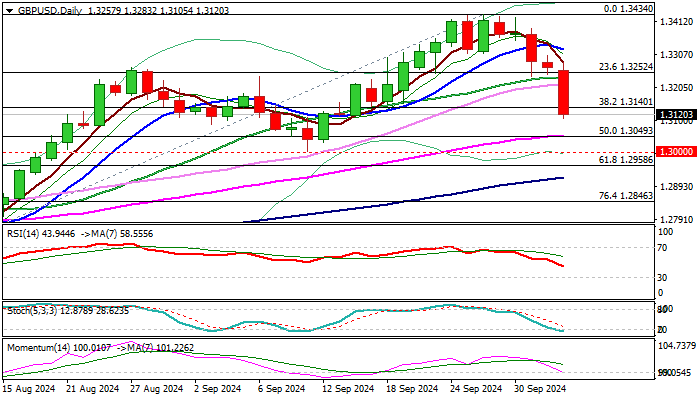
Fresh extension of bear-leg from 1.3434 (2024 high, posted on Sep 26) hit the lowest in three weeks, after break through pivotal Fibo support at 1.3140 (38.2% of1.2664/1.3434 rally) generated fresh bearish signal.
Weakening technical structure on daily chart (falling 14-d momentum cracks the centreline / 10/20 DMA’s above the price are converging and look to form a bear-cross) supports the notion.
Close below broken 1.3140 pivot to confirm signal and open way for attack at next targets at 1.3049/32 (50% retracement / 55DMA / daily cloud top) and 1.3000 (psychological / Sep 11 higher low / Fibo 38.2% of larger1.2299/1.3434 uptrend), with break of the latter to confirm reversal signal.
Res: 1.3140; 1.3200; 1.3217; 1.3252.
Sup: 1.3100; 1.3032; 1.3000; 1.2958.
NZD/USD Dips as Market Anticipates RBNZ Rate Cut
The NZD/USD pair continues its downward trend, dropping to 0.6240 in its third consecutive session of declines. This ongoing sell-off in the New Zealand dollar is driven by market expectations of an upcoming interest rate cut by the Reserve Bank of New Zealand (RBNZ). New Zealand's borrowing costs are currently at 5.25% per annum, with widespread anticipation of a 50-basis point reduction at the next RBNZ meeting.
The RBNZ is known for its proactive and flexible monetary policy, which swiftly adjusts to inflationary pressures and external economic indicators. This expected rate cut responds to such factors and aligns with the bank's strategy to manage economic growth and inflation.
Moreover, the NZD has been under additional pressure from a strengthening US dollar, bolstered by unexpectedly robust US employment statistics for September, reported by ADP. Although the ADP report does not directly correlate with the Nonfarm Payrolls (NFP) due shortly, it still shapes market expectations and sentiment.
Global risk appetite has also waned significantly due to escalating geopolitical tensions in the Middle East, further dampening the prospects for growth-sensitive currencies like the NZD.
NZD/USD technical analysis
The NZD/USD pair followed a bearish pattern, confirming a downward wave to 0.6265 and a corrective rise to 0.6313. The market is now forming a new decline towards 0.6210. Once this target is reached, a corrective move to retest 0.6265 from below may occur, potentially leading to further declines towards 0.6144. This bearish outlook is supported by the MACD indicator, which, despite being above zero, shows a strong downward trajectory.
> 
On the hourly chart, the pair is developing the third wave of its decline towards 0.6210. Following this, a corrective fourth wave up to 0.6260 is anticipated. This forecast aligns with the Stochastic oscillator readings, which indicate the signal line is below 50 and heading towards 20, suggesting a continuation of the downward momentum after a brief correction.