Sample Category Title
EURCAD Wave Analysis
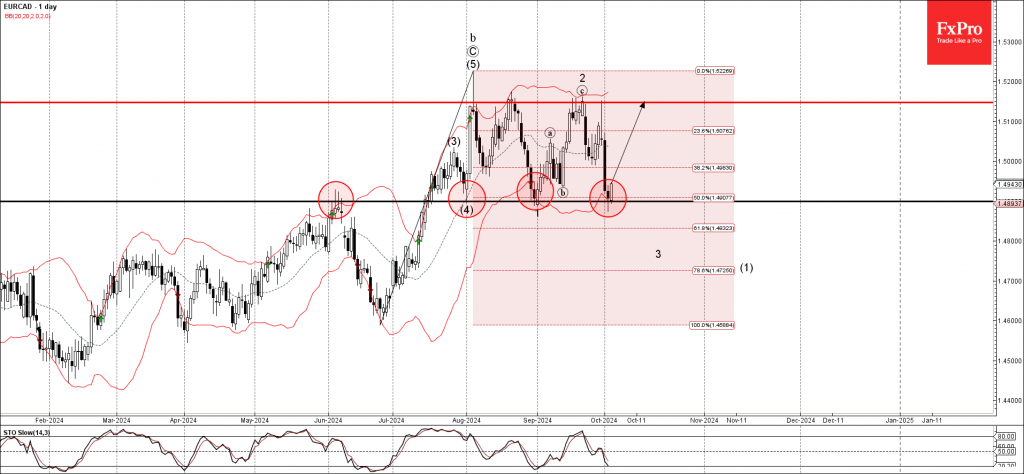
- EURCAD reversed from key support level 1.4900
- Likely to rise to resistance level 1.5150
EURCAD currency pair recently reversed up from the key support level 1.4900 (former resistance from June, which stopped the previous waves (4) and 1) intersecting with the lower daily Bollinger Band and the 50% Fibonacci correction of the sharp upward impulse from June.
The upward reversal from the support level 1.4900 created the daily Japanese candlesticks reversal pattern Hammer.
Given the clear daily uptrend, EURCAD currency pair can be expected to rise further to the next resistance level 1.5150 (top of wave 2 from last month).
GBPUSD Seeking Supply Zones After Thursday’s Massive Sell-off
Fundamental Analysis
The pound has faced strong bearish pressure following statements from Bank of England Governor Andrew Bailey, who hinted that the institution might adopt a more proactive stance on rate cuts if inflation continues to decline. Additionally, the September services and composite PMI data came in at 52.4 and 52.6, respectively, below previous figures and market expectations. These results reflect a slowdown in UK economic activity, further weakening the pound, which fell to 1.3130, its lowest level in two weeks.
On the other hand, the strengthening of the US dollar has exacerbated GBPUSD’s decline, driven by solid US labour market data, increasing expectations of a less aggressive rate-cut scenario by the Federal Reserve. Despite market volatility due to tensions in the Middle East, the dollar has solidified its position as a safe haven, keeping pressure on the pair and opening the possibility of further declines if support at 1.3100 does not hold.
Technical Analysis
GBPUSD, H2
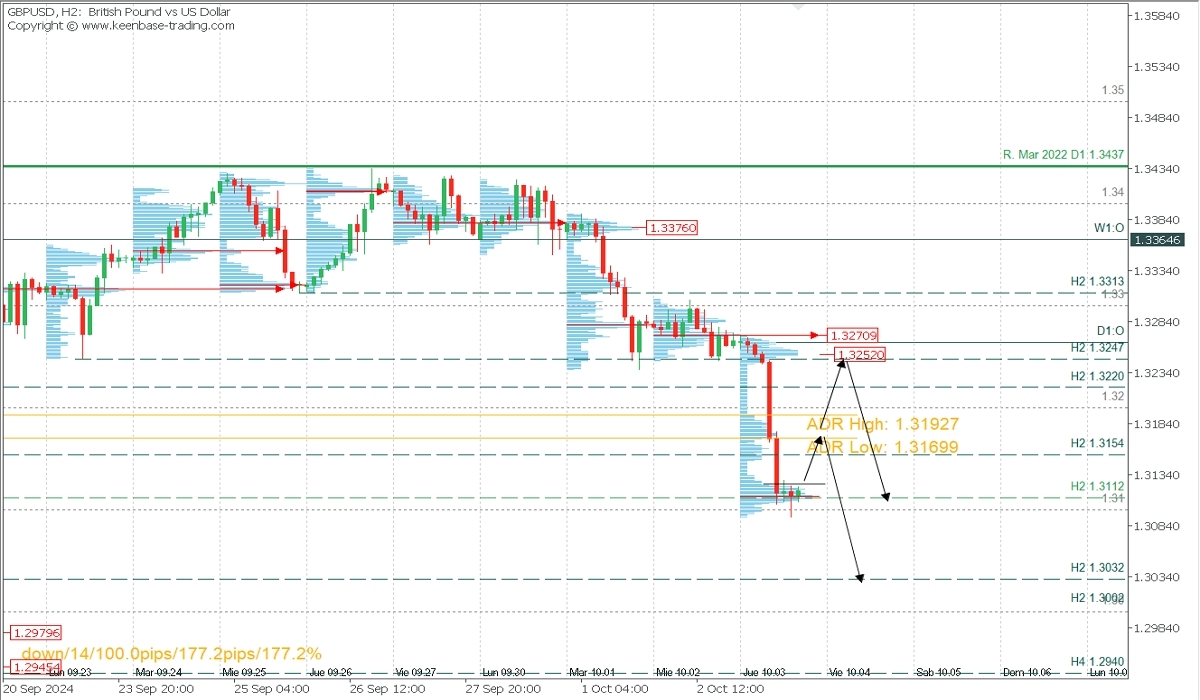
- Supply Zones (Sells): 145.08 and 145.89
- Demand Zones (Buys): 143.13, 142.00, and 140.60
After reaching a buy zone at 1.3112, breaking through the day’s bearish range, a corrective rebound towards 1.3154 and the high-volume node zone below the daily bullish range can be expected. There's potential to extend the buying on Friday during early sessions towards 1.3220 or the supply zone around 1.3252. Both areas have the potential to trigger bears to renew intraday sells toward 1.31 again and 1.3032 or 1.30 on further downside on Friday.
Technical Summary
- Buys above 1.3128 with TP at 1.3154, 1.32, 1.3220, or 1.3247 extension. All these levels have the potential to activate bulls, so it’s suggested to wait for the formation and confirmation of an exhaustion/reversal pattern on M5.
- Sells below 1.3190 if an exhaustion/reversal pattern (PAR) forms and confirms on M5; otherwise, wait to sell around 1.3247.
Always wait for the formation and confirmation of an Exhaustion/Reversal Pattern (PAR)on M5 like those shown [here](https://t.me/spanishfbs/2258) before entering any trade in the key zones indicated.
POC Discovered:
POC = Point of Control: The level or zone where the highest concentration of volume occurred. If a bearish move follows, it is considered a sell zone, forming a resistance zone. Conversely, if a bullish move follows, it is considered a buy zone, usually located at lows, forming support zones.
US: ISM Shows Services Growth Picks Up in September
The ISM Services index stepped up in September, registering 54.9, up from 51.5 in August and well ahead of the 51.7 print expected. This is the third consecutive month of improvement and the strongest print since February 2023. Twelve industries of eighteen reported growth in September, up from ten in August.
The strong headline print was lifted by healthy gains in both the business activity (up to 59.9 from 53.3) and new orders (59.4 from 53.0) sub-indexes.
The prices paid sub-component ticked up again to 59.4 percentage points (pp) from 57.3 in August, and is now back above its 2019 average. The supplier deliveries sub-index flipped to 51.2 (from 49.6), indicating elongating supplier delivery times.
In contrast to indicators of stronger demand, the employment sub-component fell back into contraction territory again (48.1), and has now indicated shrinking payrolls in six of the nine months so far this year.
Key Implications
The services sector sprung back to life in September, lifted higher by activity and growing order books. While the strength of the print is certainly a surprise at this stage of the cycle, shrinking payrolls are a fly in the ointment. Upward pressure on input prices leading into the ongoing dockworker strike, also presents an upside to the inflation outlook.
Today's report suggests that the economy still has some legs, with healthy demand figures from the services sector. Looking ahead, the Fed has been focused on prices and developments in the labor market, and more clarity on the latter point will come from Friday's jobs report for September. That said, as the Fed looks to stick the soft landing, pockets of growth will be a welcome sign.
Could Friday’s Data Tip the Balance in Favour of a 50bps Fed Rate Cut?
- Discussions about the size of the November Fed rate cut continue
- Mixed labour market data up to now with ADP surprising on the upside
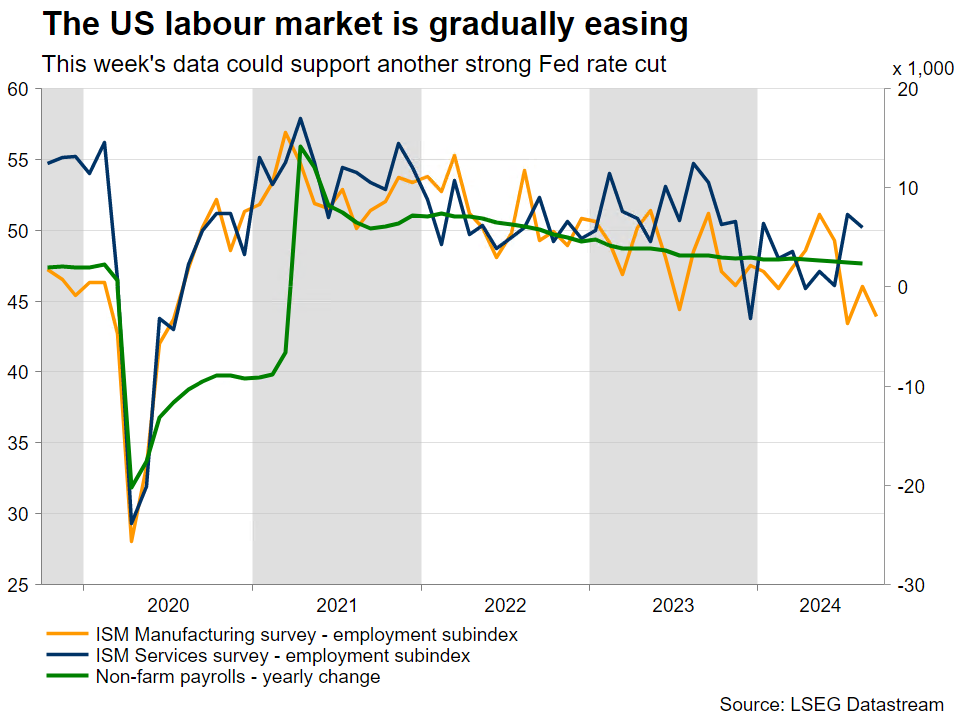
- Friday’s data matters the most; non-farm payrolls seen rising by 140k
- Geopolitics boost demand for dollar, data could reverse this trend
Fed rate cut discussions continue
With the market trying to figure out the next development in the Middle East and the likely market impact, the debate about the size of the November Fed rate cut continues. On Monday, Chairman Powell poured cold water on expectations by suggesting that the Fed would likely stick with 25bps rate cuts moving forward, with a total of 50bps of easing to be announced in the two remaining gatherings for 2024.
The Fed doves are not yet ready to accept defeat with the market still pricing in a sizeable 36% probability for a 50bps move in early November. However, with the economy progressing well, the housing market showing signs of life and core inflation remaining comfortably north of 3%, the bears face an enormous task to gather enough votes at the next FOMC meeting in order to achieve a second consecutive 50bps rate cut.
Having said that, since Powell’s Jackson Hole speech in late August, the labour market has become the crucial factor in the Fed's decision-making process. This is not odd since the Fed operates with a dual mandate of price stability and full employment, contrary to the ECB’s single target of price stability. As such, the incoming labour market data, primarily Friday’s non-farm payrolls figure, could put the option of another aggressive rate cut back on the table.
Mixed US labor market data up to now
Despite the positive JOLTS job opening figure, both the ISM and PMI manufacturing surveys remain comfortably below the 50 threshold. Additionally, their respective employment subcomponents have resumed their recent downward trend, thus bringing some smiles to the doves’ faces.
However, these smiles have probably disappeared following yesterday’s ADP employment report. It managed to produce a small upside surprise by posting a 143k increase, above the market forecasts for an 120k jump, with the August number also getting a small upwards revision. However, both the Fed doves and market participants should be cautious as the ADP employment figure tends to be a very weak predictor of the non-farm payrolls print.
Key data today, but the focus is on Friday's calendar
Today’s monthly Challenger job cuts, the weekly jobless claims and, predominantly, the ISM and PMI services surveys should serve as the best appetizer for Friday’s data. Another set of weak prints today will add to the current theme of a labour market weakness, and possibly force economists to lower their forecasts for tomorrow’s data.
Economists are currently looking for a 140k increase in the non-farm payrolls figure with both the unemployment rate and the average hourly earnings growth seen stable at 4.2% and 3.8% respectively. Confirmation of these expectations or an upside surprise, particularly in non-farm payrolls, would temporarily pause the discussion for a 50bps rate cut on November 7, with the doves hoping that the next set of labour market data in early November is more favourable to their case.
However, a sub-100k print tomorrow, a downward revision to August’s non-farm payrolls figure and an abrupt increase in the unemployment rate could support arguments for a 50bps rate cut in November, with the doves quickly appearing on the newswires to support such a move.
Dollar could underperform upon a weak set of data
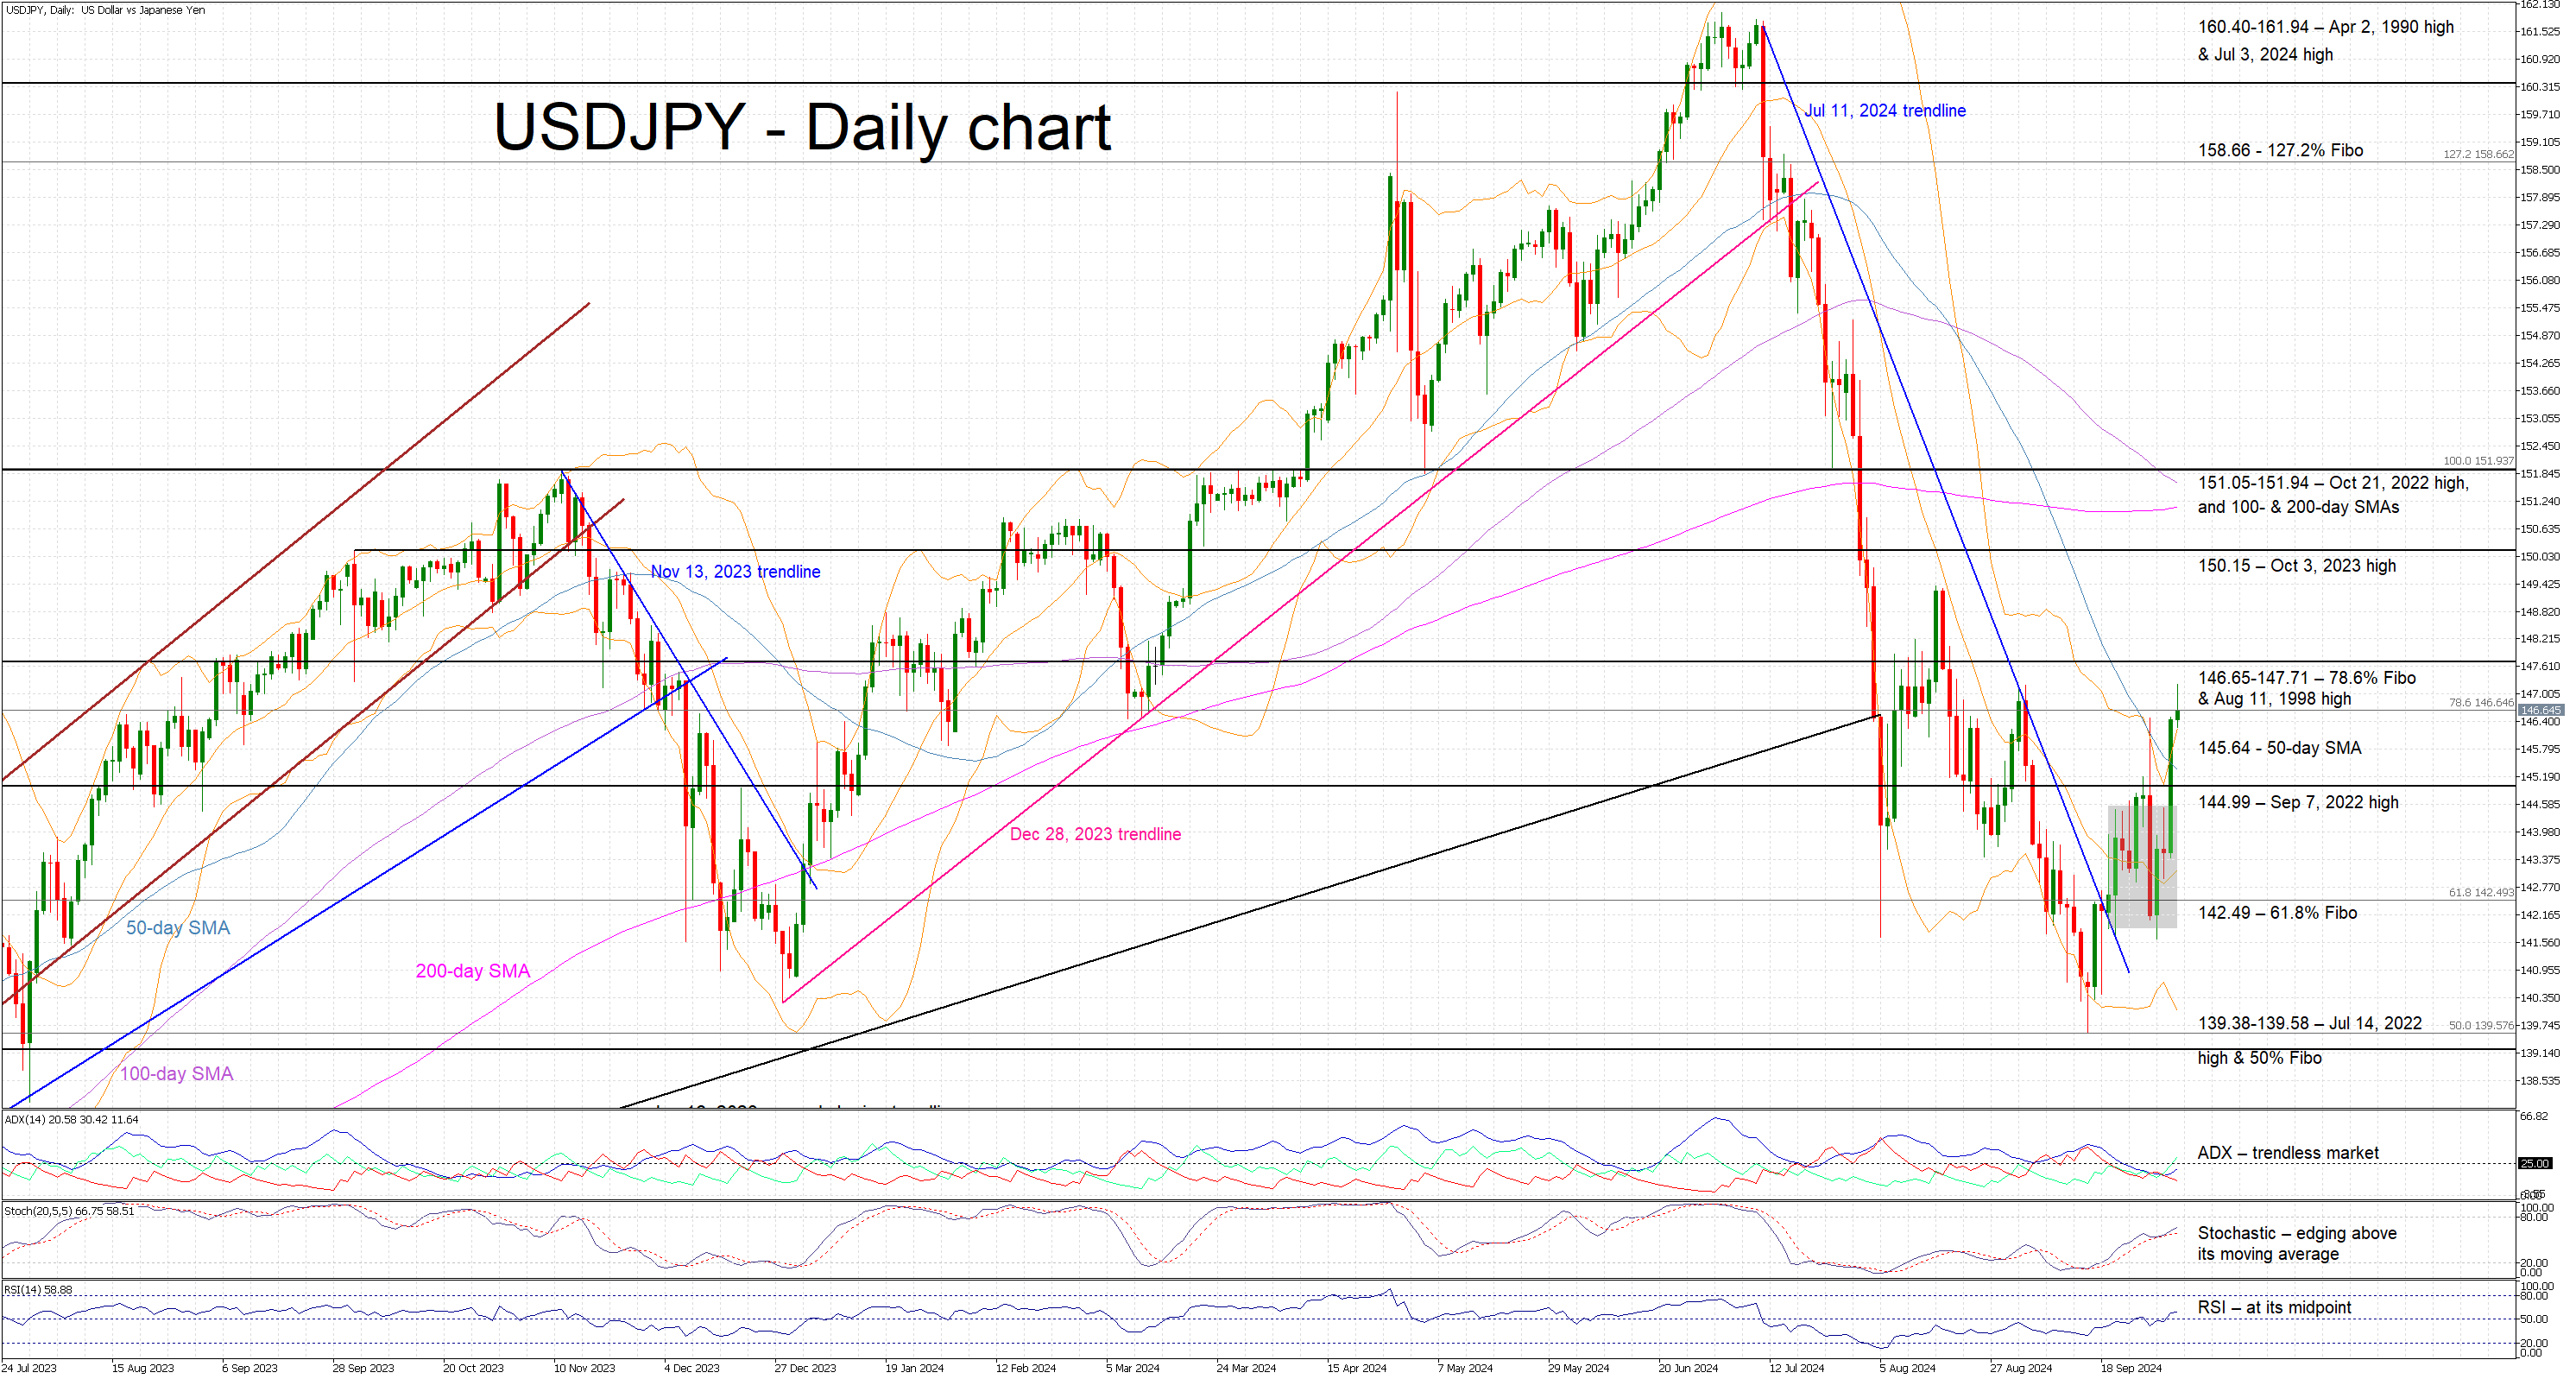
The geopolitics-induced risk-off reaction has boosted the US dollar with the euro/dollar pair dropping towards the 1.1030 region and dollar/yen recovering abruptly. Assuming that there is no further escalation in the Middle East, weak labour market data on Friday will keep the discussion alive for another 50bps rate cut in November, and thus potentially reverse the current dollar/yen upleg. The 142.49 level is probably the plausible target for the dollar bears.
On the flip side, an upside surprise in the non-farm payrolls figure and a likely acceleration in the hourly earnings could help the dollar maintain its recent gains. A break above the busy 146.65-147.71 area could open the door for a more protracted rally in dollar/yen.
Sunset Market Commentary
Markets
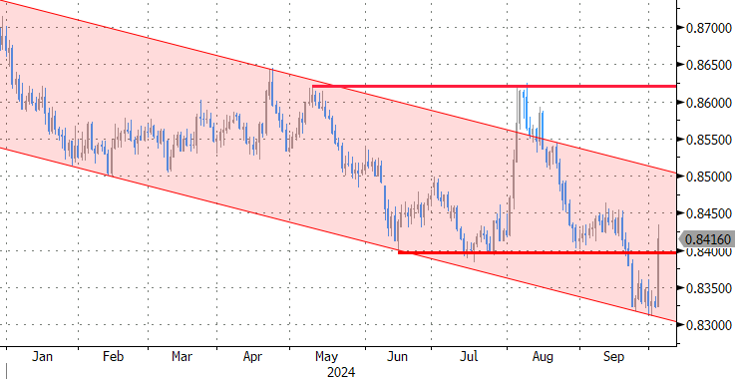
An interview of BoE Governor Bailey in The Guardian changed (relative) prospects for UK yield markets and sterling. Until now, markets expected the BoE to keep a cautious approach on easing as (especially underlying) inflation proved sticky, raising doubts the BoE would be able to reach its 2.0% target in a sustainable way anytime soon. Still, Andrew Bailey now flags the BOE could become a bit more activist/aggressive when on rate cuts if inflation data remain good. Bailey also said that cost-of living pressures turned out less persistent than the BoE feared. The BoE Decision Maker Panel survey (DMP) published today, admittedly only one source on inflation (expectations), at least didn’t signal a faster decline. Firms saw their output prices an average 4.2% Y/Y higher in the three months to September (4.0% August). Year-ahead own price growth is seen unchanged at 3.6%. CPI inflation expectations for the year ahead declined marginally (2.6% from 2.7%). Whatever, UK rates in a steepening move declined between 5 bps (2-y) and 0.5 bps (30-y). A November cut remains fully discounted and markets now see a 75% chance of a back-to-back December cut (from <50%). Sterling is losing its status as a ‘high-yield safe haven’. EUR/GBP jumped from the 0.833 area to currently trade near 84.15. For cable, 1.34 levels still in vogue on Monday, suddenly are very far away (1.31). Sterling from now will likely follow an asymmetric data dependent reaction function similar to the euro and the dollar, with weak data having most impact.
Core bond markets (EMU and the US) and equities were in a (mostly controlled) ‘selling’ modus. The Eurostoxx 50 is ceding 0.8%. S&P 500 declines 0.2% Oil stays well bid (brent $75.3) as markets await next developments in the Middle East conflict. For now this doesn’t cause safe haven buying of core bonds. EMU (and US) yields are looking for a bottom (German 2-y +5.0 bps, 30-y +6.5 bps). Dovish comments from (often hawkishly oriented) ECB’s Schnabel yesterday only had limited impact as back-to back 25 bps rate cuts for October and December are discounted. In the US, jobless claims remained low (223k). The services ISM was strong. The headline index unexpectedly jumped from 51.5 to 54.9. Most subindices confirmed this trend, also the price data (new orders 59.4 from 53.0, business activity 59.9 from 53.3, prices paid 59.4 from 57.3). However, a very important one walked the opposite way (employment falling from 50.2 to 48.1). Still US yields extended intraday gains rising between 6.0 bps (5-y) and 3 bps (30-y). USD gains again stay modest (DXY 101.88 from 101.60, EUR/USD 1.1035 from 1.1045, USD/JPY 147.0 from 146.5).
News & Views
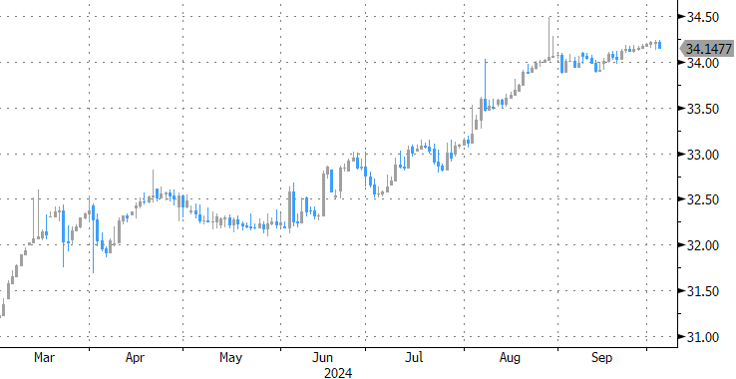
Turkish inflation eased from +51% in both the headline and core gauge to a little over 49% in September. The drop is an important milestone: with the policy rate at 50% real rates have thus turned positive for the first time in more than three years. Inflation nevertheless was stronger than expected. The 2.97% monthly reading easily topped the 2.20% analysts’ estimate. The rise from August (2.47%) also resulted in an uptick of the three-month rolling average to the highest since May. Sharply rising education prices (+14.2% m/m) were to blame. In the minutes of the September 19 meeting published last week, the CBRT bank flagged the matter (alongside transport services) as keeping services inflation stubbornly strong, but that didn’t prevent CBRT from dropping an explicit commitment to raise rates if necessary. This dovish twist opened up the debate on a first rate cut only to be overtaken by reality two weeks later. USD/TRY drops a tad intraday on TRY appreciation but remains near record highs around 34.2.
Swiss inflation eased further in September and now ventures in the lower part of the 0-2% Swiss National Bank (SNB) target band. A monthly 0.3% drop pushed the yearly figure down from 1.1% to just 0.8%. Both missed expectations (-0.1% m/m and 1% y/y). Core inflation was 1%, missing the 1.1% analyst estimate as well. Headline inflation was about in line with the SNB’s recently sharply downgraded forecasts of an average 1.1% in Q3 though. But that also means SNB projections of mere 0.5% inflation through 2025 remain intact. It validates the statement noting that more cuts after last week’s one (to 1%) may be necessary. Despite the data, the Swiss franc only eased temporarily today with a fragile risk environment (geopolitical tensions) triggering some safe haven flows on FX markets. EUR/CHF trades near opening levels just south of 0.94. In addition, SNB has less room left to ease policy further compared to the ECB and Fed (assuming a zero lower bound). That’s giving the CHF a relative rate advantage. SNB president Schlegel this week didn’t rule out returning to negative rates but markets don’t buy that currently.
Graphs
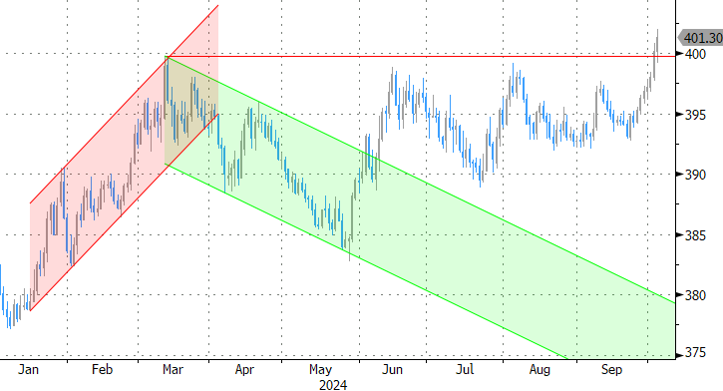
EUR/HUF: forint weakens beyond 400 mark on global risk-off and as Hungary is facing new legal battle with the EU.
EUR/TRY: Turkish lira holding near all-time lows against the dollar even as CBRT real policy rate turns positive.
EUR/GBP jumps back north of 0.84 as BoE’s Bailey sees room for more activist rate cuts.
US 2-y yield rebounds off recent lows as data mute the debate on additional 50 bps Fed steps (for now).
US ISM services surges to 54.9 in Sep, highest since Feb 2023
US ISM Services PMI jumped from 51.5 to 54.9 in September, above expectation of 51.5, marking the highest reading since February 2023. The data also points to sector expansion for the 49th time in 52 months.
Looking at some details, business activity/production surged from 53.3 to 59.9. New orders jumped from 53.0 to 59.3. However, employment fell from 50.2 to 48.1. Prices also rose from 57.3 to 59.4.
ISM said: “The past relationship between the Services PMI® and the overall economy indicates that the Services PMI® for September (54.9 percent) corresponds to a 1.9-percentage point increase in real gross domestic product (GDP) on an annualized basis.”
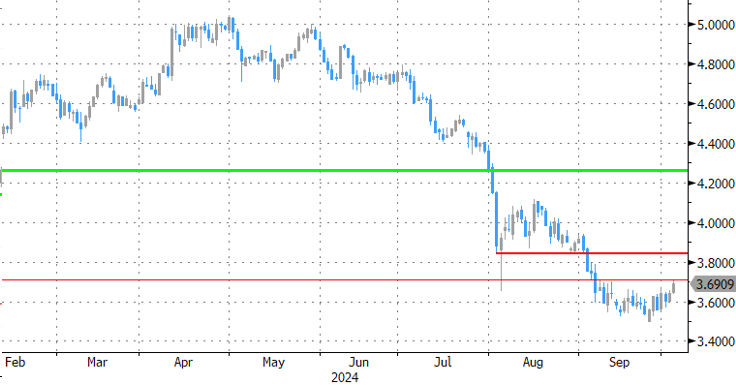
Bitcoin in a Slippery Mode Within SMAs
- Bitcoin battles with 60,200 area
- RSI implies further decreases
Bitcoin prices have been falling since they peaked at 66,450 and have been hovering within the 50- and 100-day simple moving averages (SMAs) over the last couple of days. If the market continues to dive, then immediate support could come from the 57,600 support level ahead of the 52,470 barrier, registered on September 7.
On the other hand, if the market successfully climbs above the 100-day SMA, it may re-challenge the 200-day SMA, which is near the 63,540 area. Further increases may open the way towards the previous top of 66,450 before heading north to the 69,950 resistance level.
Technically, the RSI indicator has been in a strong declining move, crossing beneath the 50 zone after the rally to the overbought region, suggesting a steeper downside trend.
All in all, bitcoin has been in a bearish tendency since it peaked at 71,885 on June 7, and any new lows below the 49,480 bottom could endorse this outlook. However, a rise above 71,885 could switch the outlook to a more bullish one.
Dollar Growth or Just a Rebound? NFP Holds the Key
The Dollar Index rallied for the fourth day in a row, gaining over 1.7%. Thanks to a mix of geopolitics and shifting expectations for the Fed’s next move, the dollar bounced solidly off the 100-point low on the DXY. After the decline, the dollar came close to testing the key medium-term 50-day moving average and the upper boundary of the consolidation range. The release of employment data may determine the Dollar’s direction in the coming weeks.
The Dollar Index has been supported since the beginning of the week after touching the 100 area, a round level that has been a support since the beginning of 2023. This time around, the importance of this area has been reinforced by the fact that the 200-week moving average, which defines multi-year trends in the currency market, passes through it.
The bulls are also encouraged by the divergence between the price and the RSI, where a lower low in the price coincided with a higher low in the index. In addition, the price rose from oversold territory, indicating that the downward momentum has been exhausted.

Technically, upside potential has formed on the weekly chart from the current 101.9 to 104 (50-week) or 106-107 (area of the last 12-month highs). A break below 100 opens downside potential to multi-year lows around 89-90.
On a lower – daily – timeframe, the DXY has climbed to the 50-day moving average and the pivot point from the first half of September. The Dollar has thus approached resistance, having exhausted the potential for a small bounce. Although the price may cross technical levels intraday, a close above 102 for the day, or better still for the week, is a reliable signal.

For further gains, the Dollar will need a driver in the form of a change in expectations for the economy and monetary policy. The closest such driver is Friday’s US employment report. Among the indirect indicators, we will be looking for a jump in the number of job openings in August and an increase in private sector employment according to the ADP estimate of 143K in September, up from 103K previously.
Later on Thursday, weekly estimates for jobless claims and the ISM services index will be released, while nonfarm payrolls are due on Friday. After the decisive rate cut in September, the Fed is paying more attention to the labour market than to inflation. Signs that the economy is slipping into recession will trigger a fresh wave of dollar weakness, while strong data will suggest a wave of dollar growth rather than a short-term bounce.
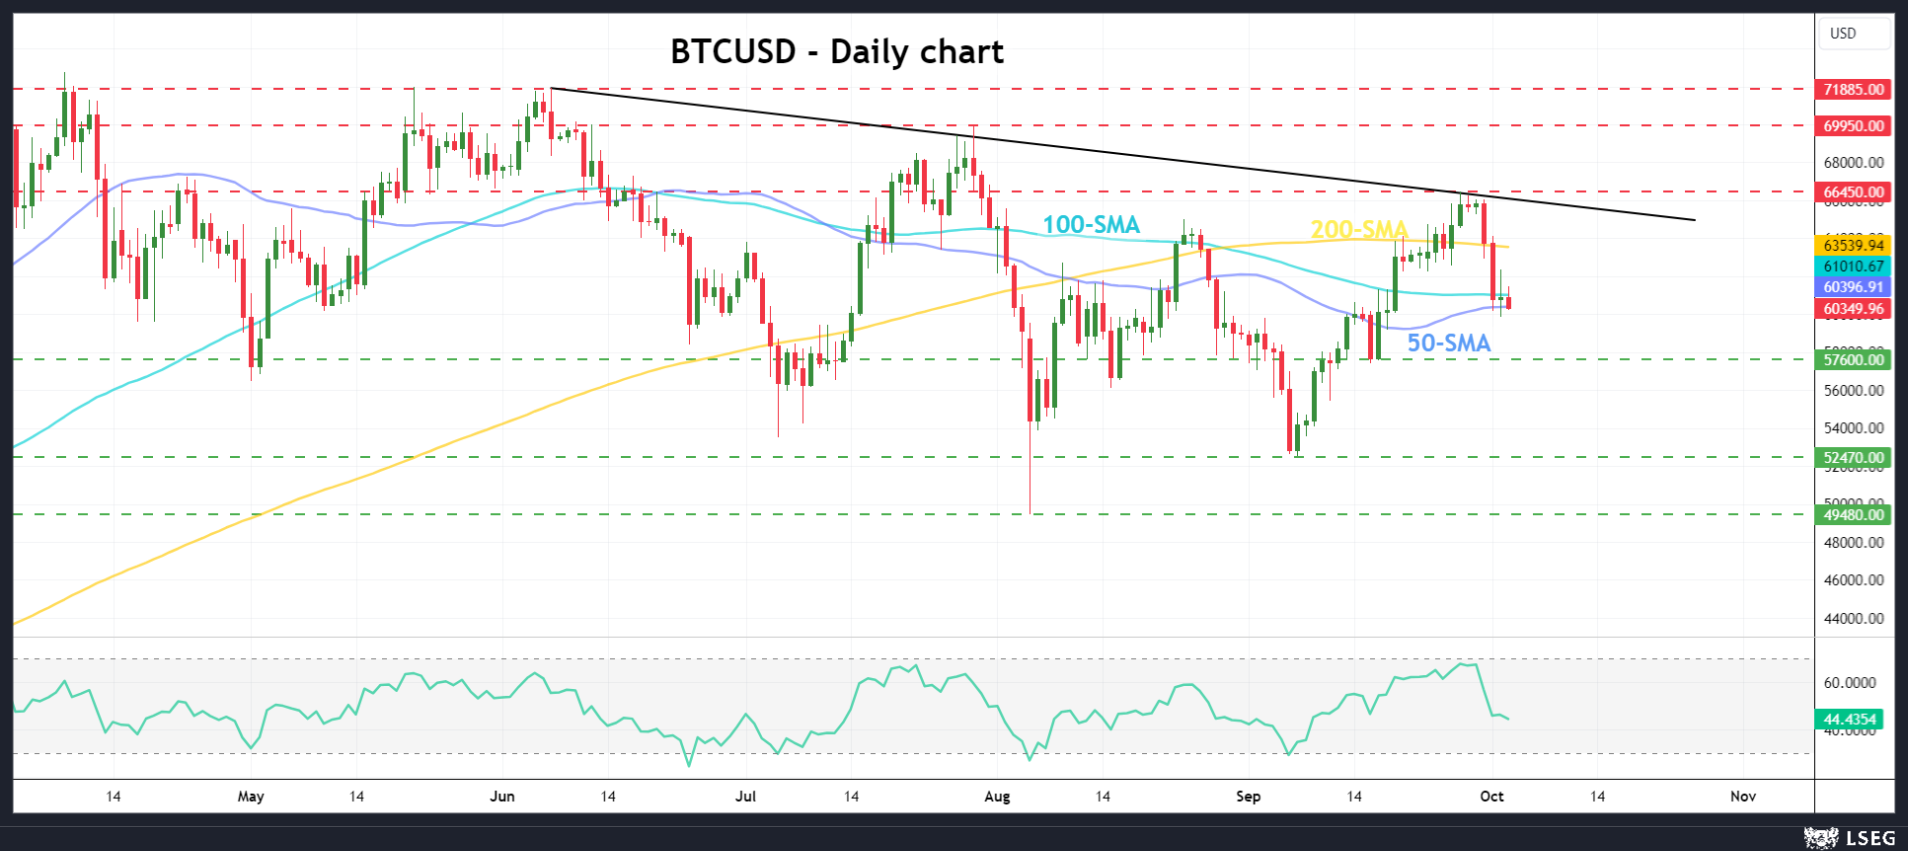
GBP/USD Mid-Day Outlook
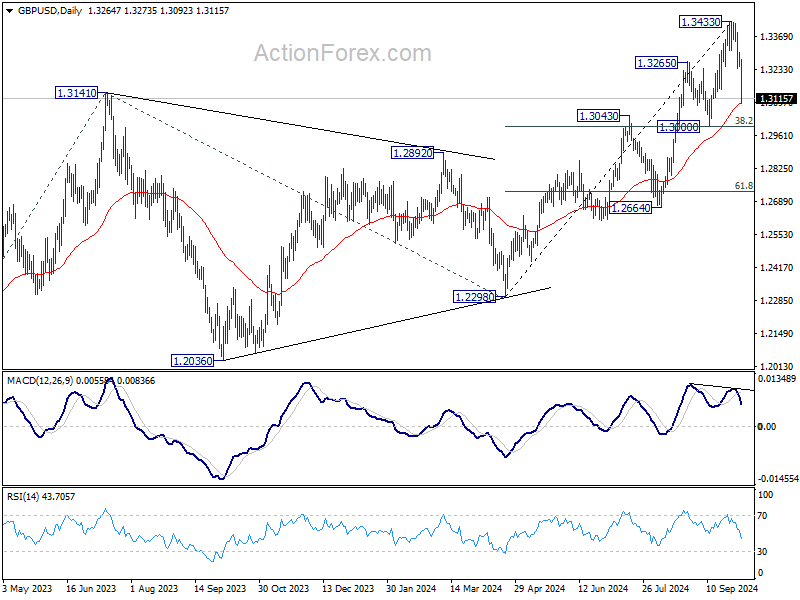
Daily Pivots: (S1) 1.3239; (P) 1.3273; (R1) 1.3300; More...
Intraday bias in GBP/USD remains on the downside for the moment. Fall from 1.3433 short term top could extend through 55 D EMA (now at 1.3090). But strong support is expected from 1.3000 cluster (38.2% retracement of 1.2298 to 1.3433 at 1.2999 to bring rebound. On the upside, above 1.3236 minor resistance will turn intraday bias neutral first.
In the bigger picture, up trend from 1.0351 (2022 low) is in progress. Next target is 61.8% projection of 1.0351 to 1.3141 from 1.2298 at 1.4022. For now, outlook will stay bullish as long as 1.3000 support holds, even in case of deep pullback.