Sample Category Title
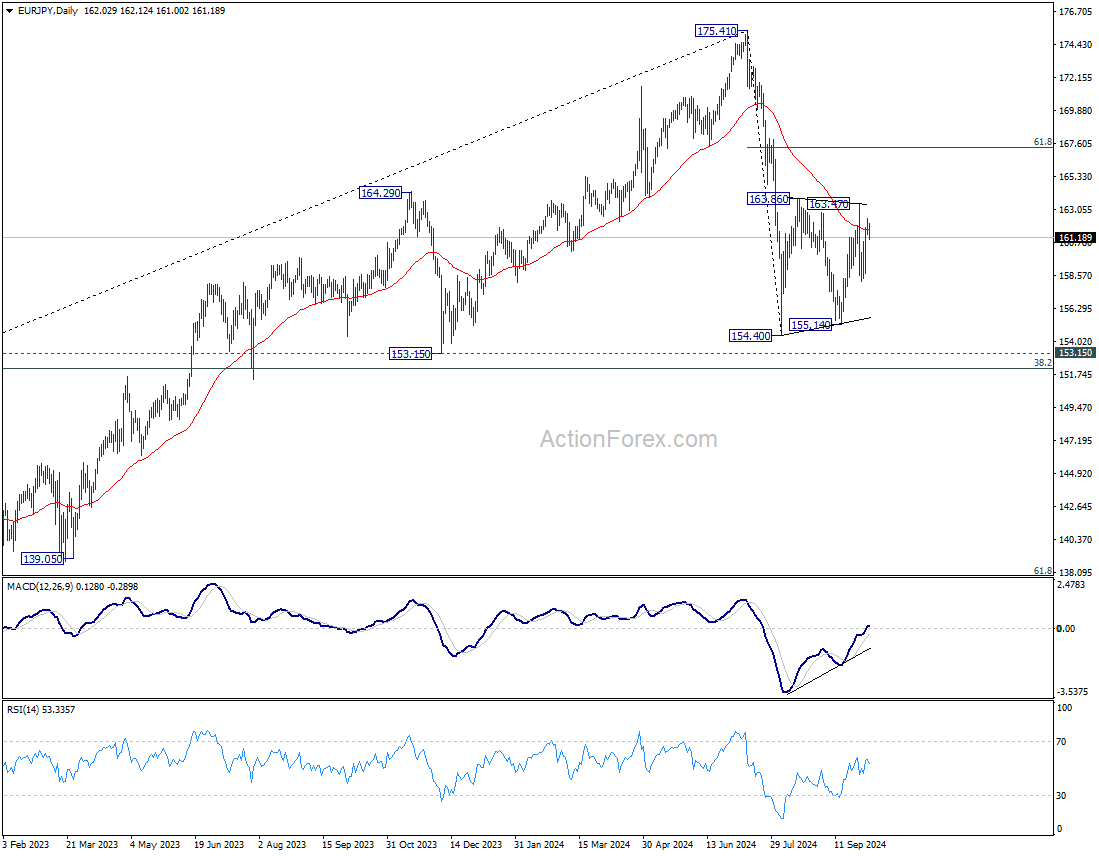
EUR/JPY Daily Outlook
Daily Pivots: (S1) 161.48; (P) 161.98; (R1) 162.60; More....
Intraday bias is EUR/JPY stays neutral at this point. On the upside, break of 163.47 will resume the rise from 155.14 to 61.8% retracement of 175.41 to 154.40 at 167.38. On the downside, break of 158.09 will bring deeper fall back to 154.40/155.14 support zone.
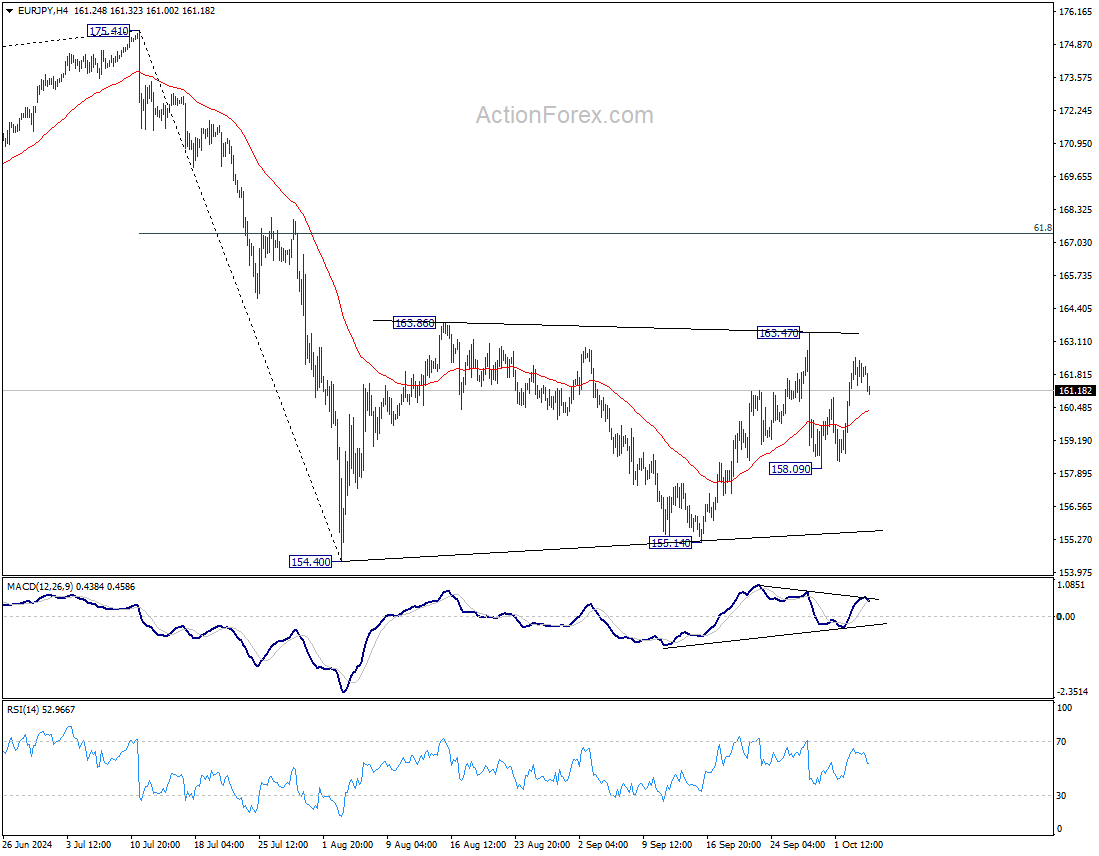
In the bigger picture, price actions from 175.41 are seen as correction to rally from 114.42 (2020 low). The range of consolidation should have been set between 38.2% retracement of 114.42 to 175.41 at 152.11 and 175.41 high. However, decisive break of 152.11 would argue that deeper correction is underway.
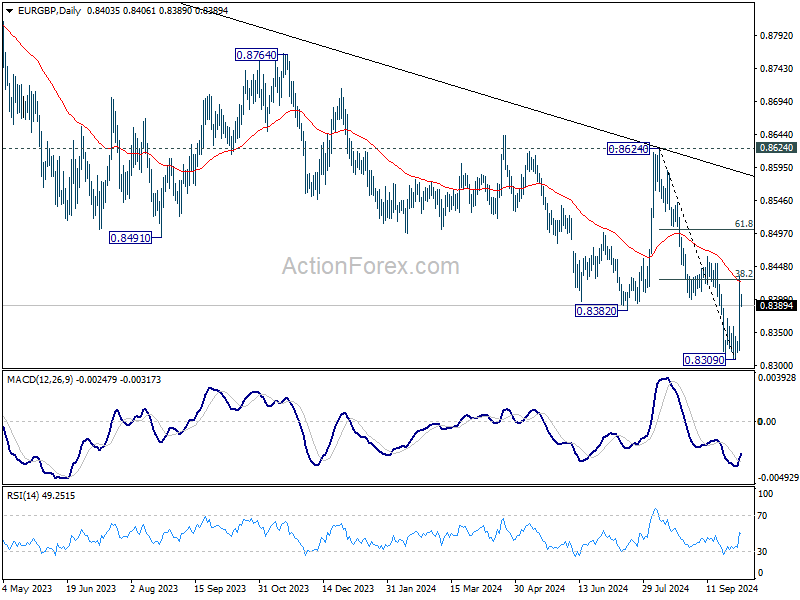
EUR/GBP Daily Outlook
Daily Pivots: (S1) 0.8341; (P) 0.8387; (R1) 0.8452; More...
Intraday bias in EUR/GBP stays on the upside for the moment. Decisive break of 38.2% retracement of 0.8624 to 0.8309 at 0.8429 will pave the way to 61.8% retracement at 0.8504 and possibly above. On the downside, below 0.8370 resistance turned support will turn intraday bias neutral first.
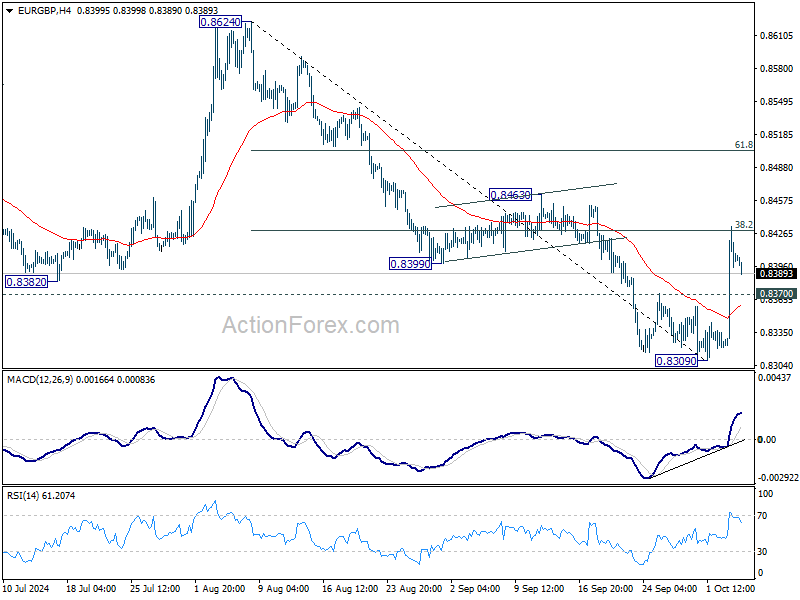
In the bigger picture, down trend from 0.9267 (2022 high) is in progress. Next target is 0.8201 (2022 low), but strong support should be seen there to bring rebound. However, outlook will remain bearish as long as 0.8624 resistance holds even in case of strong rebound.
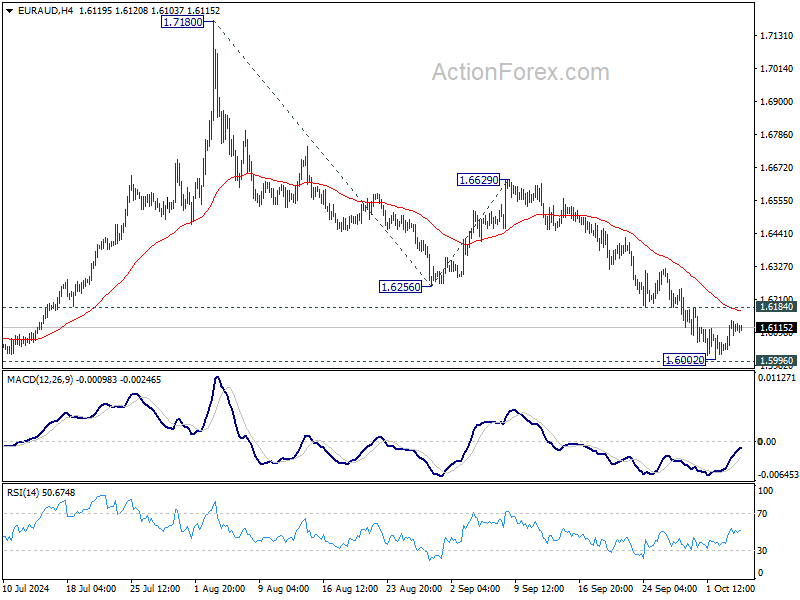
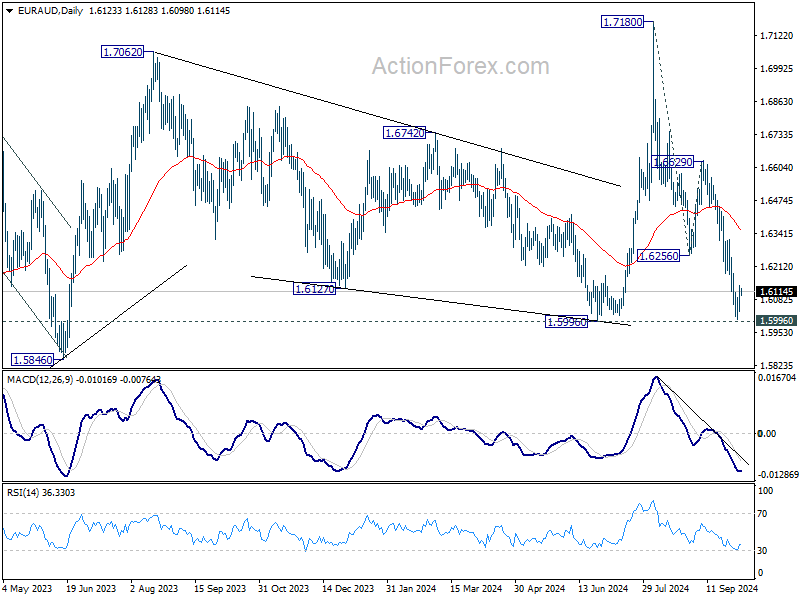
EUR/AUD Daily Outlook
Daily Pivots: (S1) 1.6061; (P) 1.6101; (R1) 1.6163; More...
Intraday bias in EUR/AUD stays neutral at this point. Strong rebound from 1.5996 support, followed by 1.6184 minor resistance, will indicate short term bottoming. Intraday bias will be turned back to the upside for stronger rebound. However, decisive break of 1.5996 will carry larger bearish implications. Next target will be 100% projection of 1.7180 to 1.6256 from 1.6629 at 1.5705.
In the bigger picture, outlook is mixed up by the deeper than expected fall from 1.7180. Yet as long as 1.5996 support holds, up trend from 1.4281 (2022 low) is still in favor to resume at a later stage. However, decisive break of 1.5996 will argue that the medium term trend has reversed.
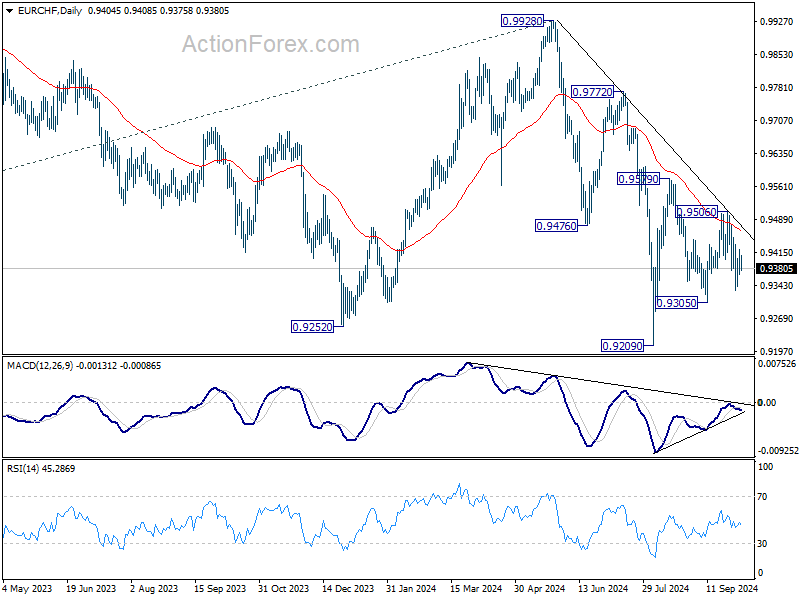
EUR/CHF Daily Outlook
Daily Pivots: (S1) 0.9376; (P) 0.9399; (R1) 0.9431; More....
Range trading continues in EUR/CHF and intraday bias remains neutral first. On the downside, break of 0.9305 will resume the fall from 0.9579 to retest 0.9209 low. On the upside, above 0.9506 will resume the rebound from 0.9305 to 0.9579 resistance.
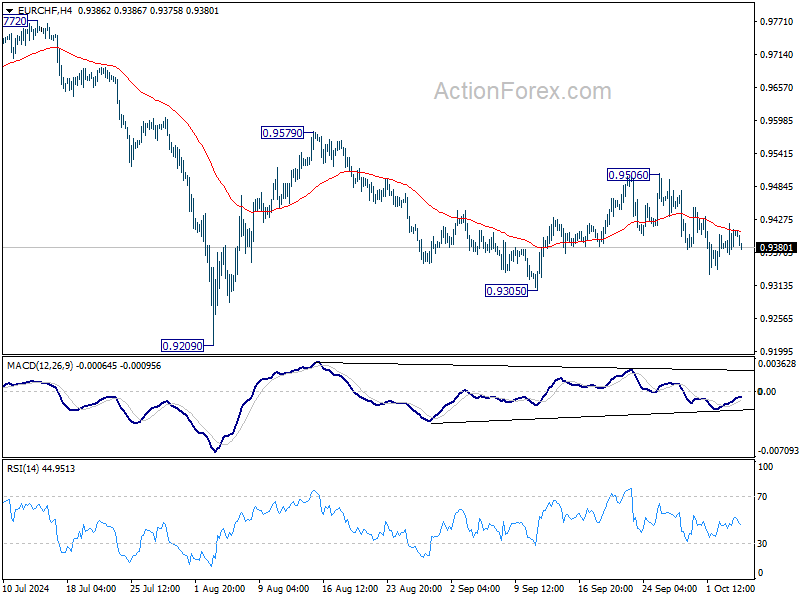
In the bigger picture, medium term corrective pattern from 0.9407 (2022 low) might have completed with three waves to 0.9928. Decisive break of 0.9252 (2023 low) will confirm long term down trend resumption. Next target will be 61.8% projection of 1.1149 to 0.9407 from 0.9928 at 0.8851. For now, outlook will stay bearish as long as 0.9928 resistance holds, even in case of strong rebound.
Pound’s Bullish Run in jeopardy
Global headlines were shaken yesterday by the news that Israel is considering striking Iran’s oil facilities, and that Joe Biden may let Israel do it. This comes after Iran’s latest attack, which was in response to a Hezbollah strike on Israel. And that, of course, followed Israel’s ongoing conflict in Gaza. It’s a complex chain of events, but the possibility of Israel targeting Iran’s oil infrastructure is definitely raising eyebrows around the world and giving a decent energy boost to oil prices. The barrel of US crude closed yesterday nearly 4% higher and above the critical Fibonacci resistance of $72.85pb, the major 38.2% retracement on July to September retreat. As such, US crude has now left its bearish summer trend and stepped into the medium-term bullish consolidation zone. The next resistance stands at $75pb, the 50% retracement, then $77 and $80pb levels. The upside potential is clearly present, the rising tensions if coupled with the threat of lower Iranian supplies, should give a further reason to the oil bulls to extend their tactical long positions. But it’s important to keep in mind that the gains that are made on the back of geopolitical tensions will – sooner rather than later – be given back. Tactical longs will benefit from the rising tensions as long as they last, and until the focus will return to the market fundamentals of ample global supply and prospects of slowing global demand.
Rising energy prices, US threat to supply chains increase inflation outlook
Even though the rising oil prices should not last long (hopefully), they may have an impact on the short and medium-run inflation outlook. That, combined with strikes in US East and Gulf coasts are inflationary. The spike in energy prices and supply chain disruptions were the main responsible for the soaring global inflation after the 2020s. Of course, today’s situation is not comparable to the pandemic period, but could – maybe - get the Federal Reserve (Fed) members question their overly optimistic view on inflation, and their overly dovish stance on rates.
The expectation of another jumbo rate cut is melting by the day. Activity on Fed funds futures gives less than one third chance of another 50bp cut from the Fed in the November meeting. Especially given that the recent data hasn’t been *that* bad, really. Released earlier this week, both the jolts and the ADP reports have surprised to the upside. The ISM manufacturing index showed further weakness in both activity, prices and employment, but yesterday’s ISM services revealed a stronger expansion both in terms of activity and prices; the prices component of the index soared to nearly 60! All looked well besides employment. And overall, Citi’s US Surprise Index -which has hit a bottom this summer – rebounded strongly since then, and stepped into the positive territory lately, meaning that there are more positive surprises to the data these days than negative surprises and that the Fed doves have probably went far ahead of themselves.
US jobs watch
Today’s jobs data will be very important in providing a final conclusion to the week’s so far stronger-than-expected US jobs figures. The US economy is expected to have added near 147K new nonfarm jobs in September, the unemployment rate may have steadied near 4.2% and wages may have grown slightly slower than they did last month, but still by 3.8% on a yearly basis. A set of soft jobs report from the US has the potential to fuel the dovish Fed expectations, weigh on the US yields, the dollar and perhaps keep appetite in equities robust. A stronger-than-expected set of figures, on the other hand, should bring the Fed doves back on earth, lead to a further rebound in the US yields and the dollar and probably weigh on equity investors’ appetite.
The dollar, on the other hand, will likely remain under the pressure of softening majors elsewhere. After the yen selloff earlier this week, the British pound took a severe hit yesterday, after the Bank of England (BoE) Governor Bailey, said in an unusually dovish statement that the Bank could become a ‘ bit more aggressive’ and a ‘but more activist’ in its approach to cutting the rates. Cable tumbled more than 1% in a single session and remains under pressure. The BoE’s hawkish stance – and its surprisingly strong economic performance in H1 – were the major drivers of the sterling bulls this year, and both look like they are in jeopardy at this point.
Watch Out for September NFP
In focus today
This week's most important macro release, the US September Jobs Report, is due at 14.30 CET. We forecast non-farm payrolls growth at +160k, slightly above consensus. We foresee average hourly earnings growth at +0.2% m/m SA and unemployment rate steady at 4.2%. A solid print in line with our call would ease the Fed's pressure for further large rate cuts. We still expect only 25bp reductions at the upcoming meetings.
Economic and market news
What happened yesterday
In the US, ISM services for September printed stronger than expected at 54.9 (cons: 51.7), driven by upticks in all subcomponents except employment. The Challenger report showed declining layoffs in September. This week's labour market data has generally surprised positively, while leading indicators such as ISM and PMI have signalled cooling employment growth. All in all, it suggests that labour market conditions are relatively robust.
In the euro area, the September euro area services PMI was revised up to 51.4 (flash: 50.5), and the composite PMI to 49.6 from 48.9. Thus, services continue to expand, though at a lower pace, while manufacturing remains below 50. The upward revision driven by Spain and France, while German services PMI was steady at 50.6 and a slight downward revision for Italy. With the service sector holding up growth, we estimate that euro area GDP continued to expand in Q3 thanks to the Southern European economies holding the average composite PMI above 50 in Q3.
In Norway, the seasonally adjusted house prices rose 0.4% m/m in September, coming in just below Norges Bank's forecast of 0.3%. However, we do not see this as a deciding factor for the rate setting and our call of a pause in November and December.
In Switzerland, the inflation figures for September surprised markedly to the downside. Headline came in at 0.8% y/y (cons: 1.0%, prior: 1.1%), core likewise dropped to 1.0% (cons: 1.1%, prior: 1.1%), and monthly pressures fell into negative territory. We have two more prints until the SNB December meeting, but with inflation now in lower part of the target range this should increase the probability of 50bp cut in December. While SNB updated their inflation forecasts last week, inflation once again undershoot the projections.
In Sweden, the September services PMI surprisingly dropped below 50 (49.1 from 52.4), as all subcomponents are now below the neutral level. This contradicts last week's NIER business survey, which showed improved sentiment in the services sector. That said, it remains to be seen if this is a one-off or a shift in the trend.
In the UK, Bank of England (BoE) Governor Bailey noted, in an interview with the Guardian, that if the news on inflation continued to be good there was a chance of BoE becoming "a bit more activist" in its approach to cutting interest rates. While the comments reinforce that Bailey is in the dovish camp (opposed to chief economist Pill, who will give a speech today) a gradual pace of cutting remains the BoE base case. Bailey's comments largely drove the sharp weakening of GBP yesterday vs both EUR and USD. We think the large move lower vs EUR and USD likely reflects some profit taking. Additionally, we are inclined to think the market may be overreacting, placing too much emphasis on a single comment given the limited MPC communication. The MPC showed a strong preference for the gradual approach with an 8-1 vote favouring an unchanged decision in September coupled with hawkish commentary.
In commodities space, oil prices jumped 5% during yesterday's session due to growing concerns over potential Israeli retaliation against Iran's oil industry amid comments from US President Biden.
Equities: Global equities were lower yesterday, with most regions, excluding Japan, experiencing declines. Defensive stocks outperformed, though not in a full-blown risk-off manner, and notably, the technology sector in the US registered gains yesterday. We are currently on course for a modest weekly decline in equities; however, much could change following the non-farm payrolls (NFP) release today. More notably, the implied volatility is on the rise, with the VIX escalating from 18 to 21 this week. This increase signals heightened uncertainty rather than a shift in the prevailing narrative. Investors continue to anticipate a soft landing, yet the array of factors at play currently contributes to significant uncertainty. In this late-cycle phase, where growth is improving and operating above potential, we typically advocate for the VIX to be in the 15-17 range. Consequently, the current level of risk and uncertainty is curbing optimism and limiting equity performance. In the US yesterday, the indices closed as follows: Dow -0.4%, S&P 500 -0.2%, Nasdaq -0.04%, and Russell 2000 -0.7%. Asian markets presented a mixed picture this morning, with Chinese stocks in Hong Kong notably outperforming. Futures in the US and Europe are marginally higher.
FI: Global rates moved higher through yesterday's session as inflation expectations rose in tandem with energy prices following Biden's comments of a potential Israeli strike on Iranian energy facilities. Brent is now trading at USD77.5/barrel vs USD72/barrel at the start of the week. Yesterday's move in rates was especially evident in the long end, where 10Y yields rose 5bp in Germany and 7bp in the US. With markets now pricing 33bp ahead of the November FOMC meeting, today's NFP release has the potential to push market volatility substantially higher.
FX: Yesterday's strong ISM services print pushed US yields higher, acting as a tailwind for the greenback with EUR/USD edging closer to one-month lows around 1.10. Oil prices continue to climb on the back of heightened geopolitical risks, with Brent reaching the highest levels since late August. GBP and JPY were among yesterday's losers, whereas Scandies were little changed on the day. We decided to book a profit on our long NOK/SEK as the cross edged above 0.97.
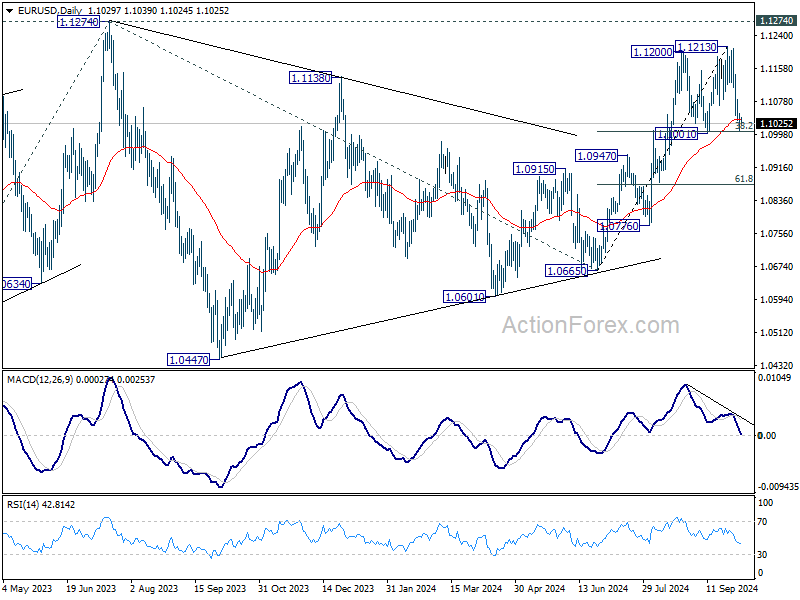
EUR/USD Daily Outlook
Daily Pivots: (S1) 1.1008; (P) 1.1030; (R1) 1.1052; More....
Intraday bias in EUR/USD remains neutral, with focus on 1.1001 cluster support (38.2% retracement of 1.0665 to 1.1213 at 1.1004). Strong rebound from this level will retain near term bullishness. Above 1.1082 minor resistance will turn bias to the upside for 1.1213 and then 1.1274 high. However,decisive break of 1.1001/4 will confirm near term bearish reversal. Intraday bias will be turned back to 61.8% retracement at 1.0874.
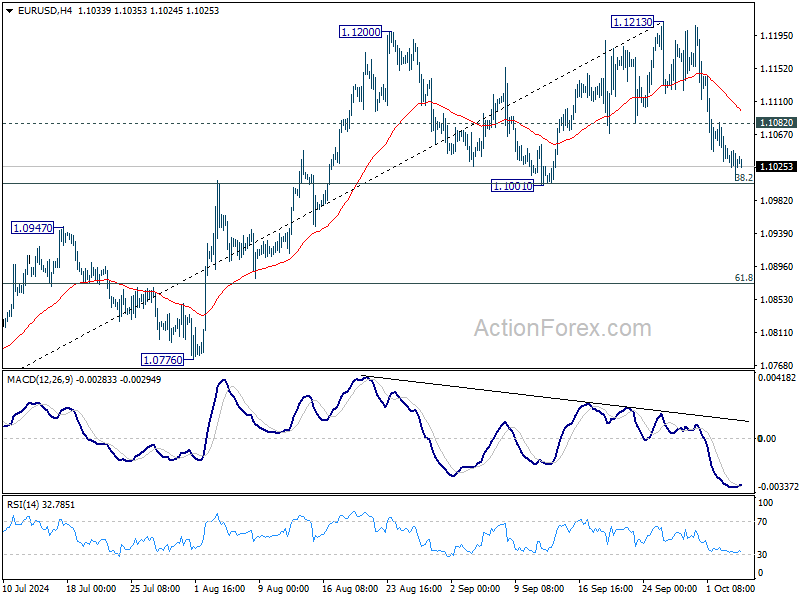
In the bigger picture, corrective pattern from 1.1274 should have completed at 1.0665 already. Decisive break of 1.1274 (2023 high) will confirm resumption of whole up trend from 0.9534 (2022 low). Next target will be 61.8% projection of 0.9534 to 1.1274 from 1.0665 at 1.1740. However, decisive break of 1.1001 will argue that corrective pattern from 1.1274 is extending with another falling leg.
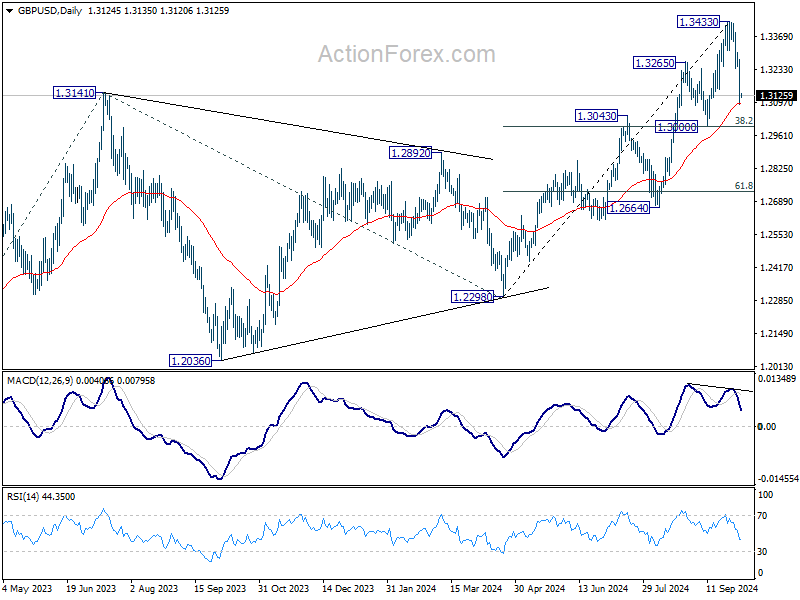
GBP/USD Daily Outlook
Daily Pivots: (S1) 1.3050; (P) 1.3166; (R1) 1.3241; More...
GBP/USD's fall from 1.3433 short term top is in progress. Intraday bias remains on the downside for deeper decline. But strong support is expected from 1.3000 cluster (38.2% retracement of 1.2298 to 1.3433 at 1.2999 to bring rebound. On the upside, above 1.3236 minor resistance will turn intraday bias neutral first.
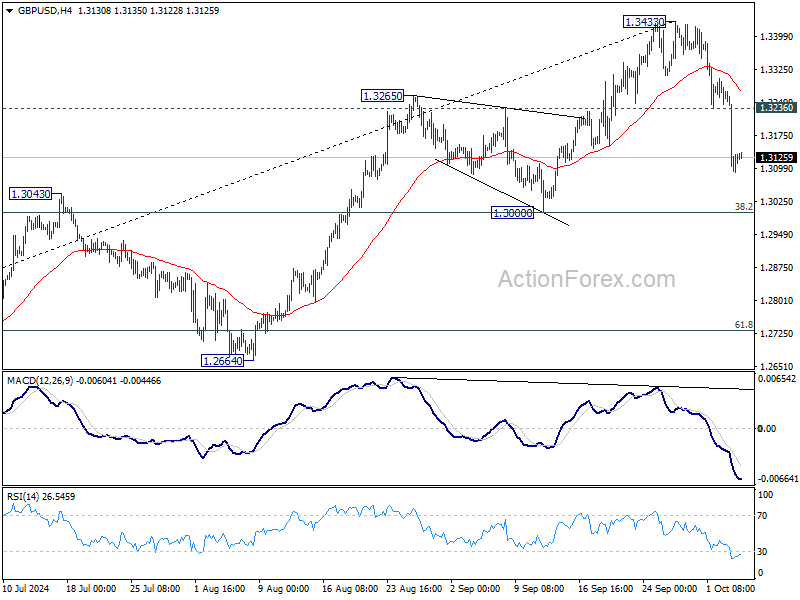
In the bigger picture, up trend from 1.0351 (2022 low) is in progress. Next target is 61.8% projection of 1.0351 to 1.3141 from 1.2298 at 1.4022. For now, outlook will stay bullish as long as 1.3000 support holds, even in case of deep pullback.
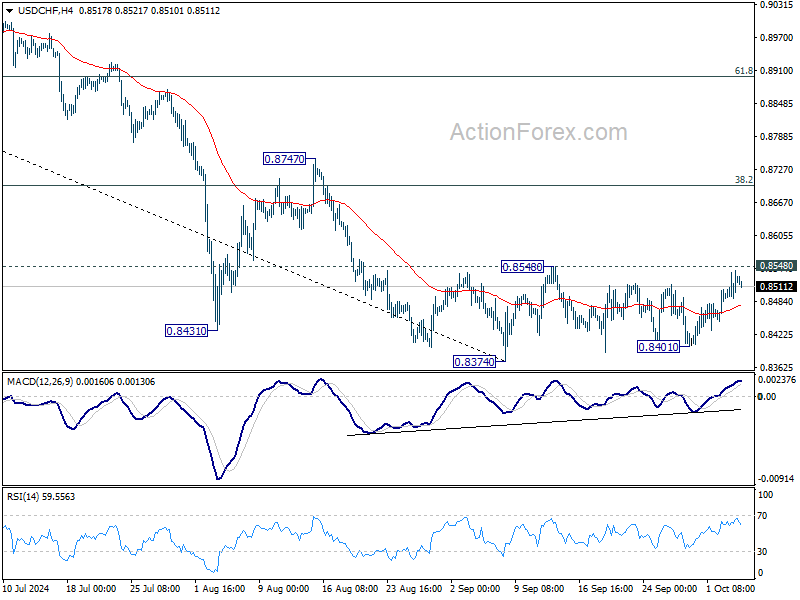
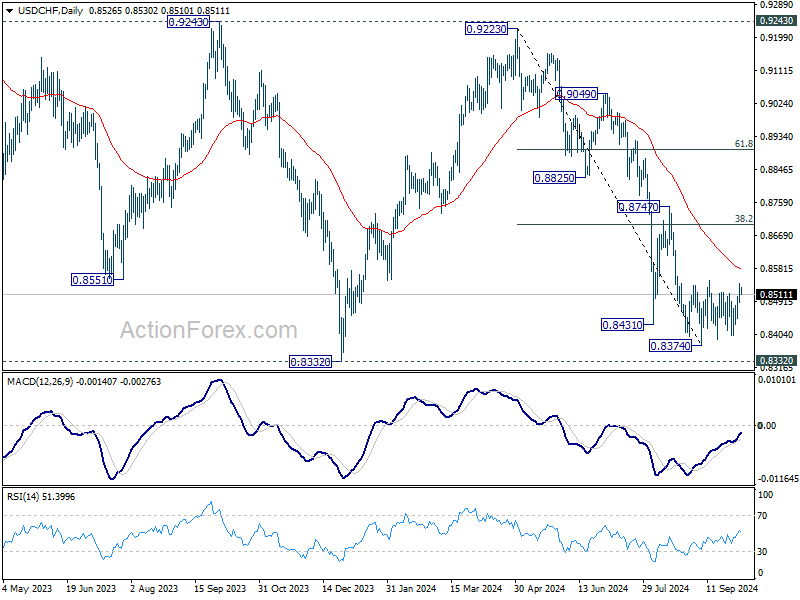
USD/CHF Daily Outlook
Daily Pivots: (S1) 0.8499; (P) 0.8521; (R1) 0.8551; More…
Intraday bias in USD/CHF stays neutral as range trading continues. On the upside, firm break of 0.8548 will argue that it's correcting whole fall from 0.9223. Intraday bias will be back on the upside for 38.2% retracement of 0.9223 to 0.8374 at 0.8698 at least. On the downside, break of 0.8374 will resume the fall from 0.9223 to retest 0.8332 low. Decisive break there will indicate larger down trend resumption.
In the bigger picture, price actions from 0.8332 (2023 low) are currently seen as a medium term corrective pattern, with fall from 0.9223 as the second leg. Strong support could be seen from 0.8332 to bring rebound. Yet, overall outlook will continue to stay bearish as long as 0.9243 resistance holds. Firm break of 0.8332, however, will resume larger down trend from 1.0146 (2022 high).
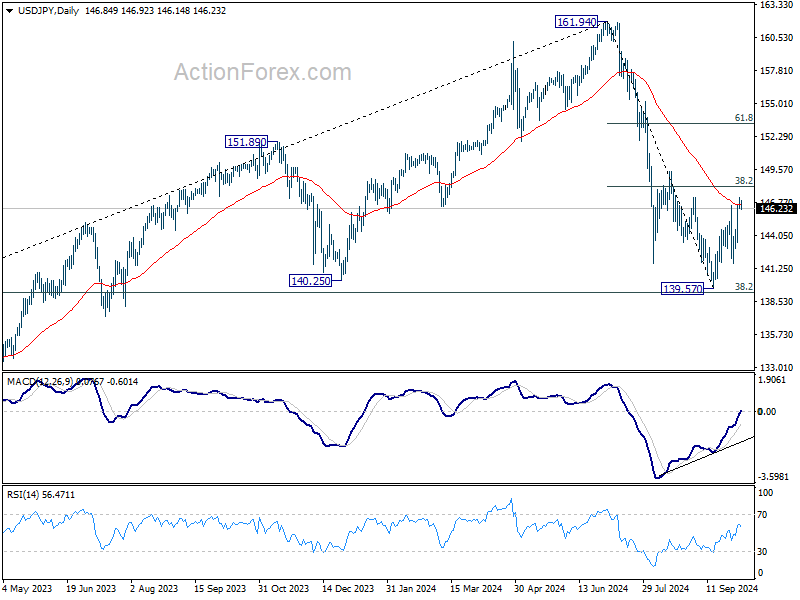
USD/JPY Daily Outlook
Daily Pivots: (S1) 146.37; (P) 146.80; (R1) 147.40; More...
Intraday bias in USD/JPY stays on the upside as rebound from 139.57 short term bottom is in progress for 38.2% retracement of 161.94 to 139.57 at 148.11. Decisive break there will argue that whole fall from 161.95 has completed ahead of 139.26 fibonacci level. Further rally should then be seen to 61.8% retracement at 153.39. However, break of 141.63 support will bring retest of 139.57 low instead.
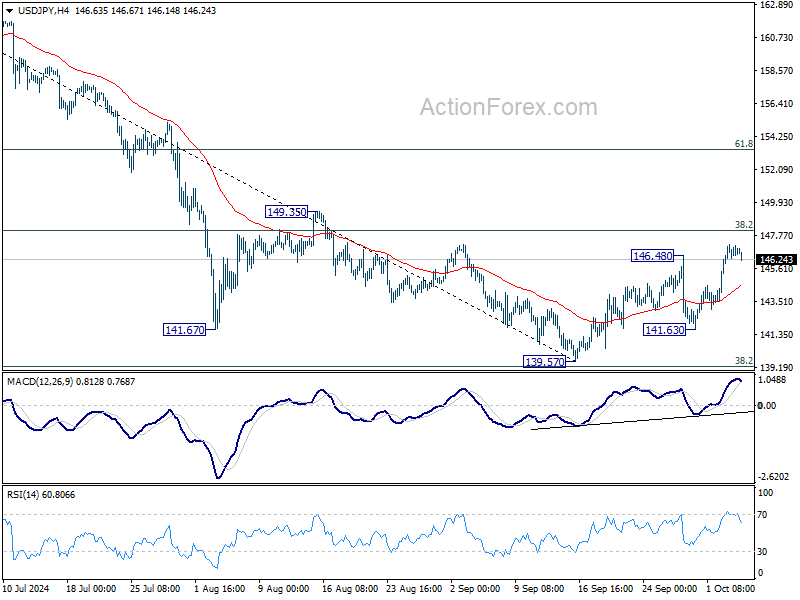
In the bigger picture, fall from 161.94 medium term top is seen as the first leg of the correction to whole up trend from 102.58 (2021 low). Strong support could be seen from 38.2% retracement of 102.58 to 161.94 at 139.26 to contain downside, at least on first attempt. Firm break of 149.35 resistance will indicate that the second leg has started. However, sustained break of 139.26 would open up deeper medium term decline to 61.8% retracement at 125.25.