
Sample Category Title
The FOMC Favours a Steady Hand
The FOMC kept the stance of policy and their outlook unchanged in April as expected, at Powell’s last meeting as FOMC Chair.
As expected, the FOMC kept the stance of policy unchanged at its April meeting and, broadly speaking, portrayed a balanced baseline and risk outlook. This is despite not explicitly stating a hike is as likely as a cut – language the dissenters Hammack, Kashkari, and Logan arguably would have preferred. This outcome is consistent with our and the market’s expectations as well as the degree of uncertainty evident in financial markets – the price of Brent crude rising circa 7% today to USD120 per barrel while US equities held near record highs.
The Committee’s take on economic activity was sanguine, with GDP characterised as “expanding at a solid pace” and the unemployment rate “little changed in recent months” even as job gains “remained low”. Members’ views on the price outlook showed caution but not overt concern, with inflation simply characterised as "elevated". "The Committee is [also] attentive to the risks to both sides of its dual mandate", and Chair Powell noted in the press conference that, in his view, policy is in a good place to take time to monitor conditions, being at the "high end of neutral”, “perhaps mildly restrictive".
We have been more concerned than the FOMC over domestic inflation stemming from capacity constraints and, in such an economic state, believe outsized and/or persistent second-round effects of energy and tariff inflation are meaningful risks. Still, with growth below trend in Q4 2025 and Q1 2026, and likely through mid-2027, there is no urgency to take a hawkish stance, let alone hike. Per Chair Powell’s remarks and current market pricing, the best course is to hold and continue assessing current conditions and uncertainties.
Like all other major central banks, the road ahead for the Federal Reserve is challenging. The domestic and international risks the economy and Committee face are disparate and could persist for some time. The FOMC will also have to navigate considerable US fiscal uncertainty over the year(s) ahead. A continued uptrend in the US 10-year yield, and consequently the 30-year mortgage rate, will limit the breadth of growth across the economy and weigh on household and financial market confidence. In time, it will also restrict the Government’s capacity to act against a meaningful deterioration in economic momentum as the interest burden grows. As such, we cannot discount policy rate cuts entirely, though they are more likely to be a topic of conversation in 2027 or 2028 than 2026.
Finally, with Kevin Warsh's nomination for FOMC Chair advancing from the Committee stage to a full vote in the Senate, it is important to recognise this meeting was Powell’s last meeting as Chair. In the press conference though, Powell made clear he still intends to stay on as a Federal Reserve Governor, and consequently a member of the FOMC, until the investigations into the Federal Reserve are “well and truly over with finality and transparency”. The Department of Justice dropping their criminal investigation into the organisation and Chair Powell are a decisive step in that direction, but the Supreme Court decision in Lisa Cook’s case is still to come, and the Federal Reserve’s own investigation into construction costs has to be completed to rule out the Department of Justice re-opening its investigation. Powell remaining in place as a Governor over the period will provide continuity while these uncertainties are resolved.
FOMC Holds Rates Steady, But Hawks Dissent on Easing Bias
The Federal Open Market Committee (FOMC) held the policy rate steady at the target range of 3.5%-3.75% for a third consecutive meeting.
There were only a few minor changes to the policy statement. While the Committee still views economic activity as expanding at a solid pace, it was noted that the "developments in the Middle East are contributing to a high level of uncertainty about the economic outlook".
The wording on inflation was also tweaked, with the Committee now seeing it as "elevated" as opposed to "somewhat elevated". There was also a nod to the fact that higher energy prices are already leading to higher inflation.
Eleven of the twelve FOMC members voted in favor of today's decision, though three of those participants voted against maintaining an easing bias in the statement. Only Stephen Miran dissented in favor of a 25-bps cut.
Key Implications
With the economic outlook largely unchanged since the last FOMC meeting and energy prices still elevated amid unresolved issues to reopen the Strait of Hormuz, the Fed opted to maintain the status quo, holding the fed funds rate steady and only making minor changes to its policy statement. But the overall sentiment leaned slightly hawkish, with several participants voting against maintaining the current easing bias in the statement.
Today marks the end of an era for Jerome Powell, with this afternoon's press conference likely his last as Fed chair. If all goes as planned, Kevin Warsh will be in-seat for the next interest rate decision on June 16-17, though it remains unclear whether Powell will serve out the remaining two-years of his term on the board of governors. Either way, it seems very unlikely that a Warsh Fed will quickly pivot to lowering interest rates. Decisions are made by a majority vote, and it's becoming clear that many participants are reluctant to take rates any lower amid a resilient economy and still elevated inflationary pressures. We see the Fed staying on hold through at least the summer, with the potential for more rate cuts later this year should inflation show more compelling evidence of moving back towards the Fed's 2% target.
Eco Data 4/30/26
| GMT | Ccy | Events | Act | Cons | Prev | Rev |
|---|---|---|---|---|---|---|
| 23:50 | JPY | Industrial Production M/M Mar P | -0.50% | 1.10% | -2.00% | |
| 23:50 | JPY | Retail Trade Y/Y Mar | 1.70% | 0.80% | -0.20% | -0.10% |
| 01:00 | NZD | ANZ Business Confidence Apr | -10.6 | 32.5 | ||
| 01:00 | NZD | ANZ Activity Outlook Apr | 19.6 | 39.3 | ||
| 01:30 | AUD | Private Sector Credit M/M Mar | 0.70% | 0.60% | 0.60% | |
| 01:30 | AUD | Import Price Index Q/Q Q1 | 0.10% | -0.60% | 0.90% | |
| 01:30 | CNY | NBS Manufacturing PMI Apr | 50.3 | 50.2 | 50.4 | |
| 01:30 | CNY | NBS Non-Manufacturing PMI Apr | 49.4 | 49.9 | 50.1 | |
| 01:45 | CNY | RatingDog Manufacturing PMI Apr | 52.2 | 50.9 | 50.8 | |
| 05:00 | JPY | Housing Starts Y/Y Mar | -29.30% | -28.90% | -4.90% | |
| 05:00 | JPY | Consumer Confidence Index Apr | 32.2 | 32.6 | 33.3 | |
| 05:30 | EUR | France GDP Q/Q Q1 P | 0.00% | 0.20% | 0.20% | |
| 06:00 | EUR | Germany Import Price Index M/M Mar | 3.60% | 3.30% | 0.30% | |
| 06:00 | EUR | Germany Retail Sales M/M Mar | -2.00% | -0.20% | -0.60% | |
| 07:00 | CHF | KOF Economic Barometer Mar | 97.9 | 96 | 96.1 | |
| 07:55 | EUR | Germany Unemployment Change Mar | 20K | 5K | 0K | 3K |
| 07:55 | EUR | Germany Unemployment Rate Mar | 6.40% | 6.30% | 6.30% | |
| 08:00 | EUR | Germany GDP Q/Q Q1 P | 0.30% | 0.20% | 0.30% | |
| 09:00 | EUR | Eurozone GDP Q/Q Q1 P | 0.10% | 0.20% | 0.20% | |
| 09:00 | EUR | Eurozone CPI Y/Y Apr P | 3.00% | 3.00% | 2.60% | |
| 09:00 | EUR | Eurozone Core CPI Y/Y Apr P | 2.20% | 2.20% | 2.30% | |
| 11:00 | GBP | BoE Interest Rate Decision | 3.75% | 3.75% | 3.75% | |
| 11:00 | GBP | MPC Official Bank Rate Votes | 1--0--8 | 0--0--9 | 0--0--9 | |
| 12:15 | EUR | ECB Rate On Deposit Facility | 2.00% | 2.00% | 2.00% | |
| 12:15 | EUR | ECB Main Refinancing Operations Rate | 2.15% | 2.15% | 2.15% | |
| 12:30 | CAD | GDP M/M Feb | 0.20% | 0.20% | 0.10% | |
| 12:30 | USD | GDP Annualized Q1 P | 2.00% | 2.20% | 0.50% | |
| 12:30 | USD | GDP Price Index Q1 P | 3.60% | 3.90% | 3.70% | |
| 12:30 | USD | Initial Jobless Claims (Apr 24) | 189K | 212K | 214K | |
| 12:30 | USD | Personal Income M/M Mar | 0.60% | 0.30% | -0.10% | 0% |
| 12:30 | USD | Personal Spending Mar | 0.90% | 0.90% | 0.50% | 0.60% |
| 12:30 | USD | PCE Price Index M/M Mar | 0.70% | 0.70% | 0.40% | |
| 12:30 | USD | PCE Price Index Y/Y Mar | 3.50% | 3.50% | 2.80% | |
| 12:30 | USD | Core PCE Price Index M/M Mar | 0.30% | 0.30% | 0.40% | |
| 12:30 | USD | Core PCE Price Index Y/Y Mar | 3.20% | 3.20% | 3.00% | |
| 12:45 | EUR | ECB Press Conference | ||||
| 13:45 | USD | Chicago PMI Apr | 49.2 | 55.3 | 52.8 | |
| 14:30 | USD | Natural Gas Storage (Apr 24) | 79B | 83B | 103B |
| 23:50 | JPY |
| Industrial Production M/M Mar P | |
| Actual | -0.50% |
| Consensus | 1.10% |
| Previous | -2.00% |
| 23:50 | JPY |
| Retail Trade Y/Y Mar | |
| Actual | 1.70% |
| Consensus | 0.80% |
| Previous | -0.20% |
| Revised | -0.10% |
| 01:00 | NZD |
| ANZ Business Confidence Apr | |
| Actual | -10.6 |
| Consensus | |
| Previous | 32.5 |
| 01:00 | NZD |
| ANZ Activity Outlook Apr | |
| Actual | 19.6 |
| Consensus | |
| Previous | 39.3 |
| 01:30 | AUD |
| Private Sector Credit M/M Mar | |
| Actual | 0.70% |
| Consensus | 0.60% |
| Previous | 0.60% |
| 01:30 | AUD |
| Import Price Index Q/Q Q1 | |
| Actual | 0.10% |
| Consensus | -0.60% |
| Previous | 0.90% |
| 01:30 | CNY |
| NBS Manufacturing PMI Apr | |
| Actual | 50.3 |
| Consensus | 50.2 |
| Previous | 50.4 |
| 01:30 | CNY |
| NBS Non-Manufacturing PMI Apr | |
| Actual | 49.4 |
| Consensus | 49.9 |
| Previous | 50.1 |
| 01:45 | CNY |
| RatingDog Manufacturing PMI Apr | |
| Actual | 52.2 |
| Consensus | 50.9 |
| Previous | 50.8 |
| 05:00 | JPY |
| Housing Starts Y/Y Mar | |
| Actual | -29.30% |
| Consensus | -28.90% |
| Previous | -4.90% |
| 05:00 | JPY |
| Consumer Confidence Index Apr | |
| Actual | 32.2 |
| Consensus | 32.6 |
| Previous | 33.3 |
| 05:30 | EUR |
| France GDP Q/Q Q1 P | |
| Actual | 0.00% |
| Consensus | 0.20% |
| Previous | 0.20% |
| 06:00 | EUR |
| Germany Import Price Index M/M Mar | |
| Actual | 3.60% |
| Consensus | 3.30% |
| Previous | 0.30% |
| 06:00 | EUR |
| Germany Retail Sales M/M Mar | |
| Actual | -2.00% |
| Consensus | -0.20% |
| Previous | -0.60% |
| 07:00 | CHF |
| KOF Economic Barometer Mar | |
| Actual | 97.9 |
| Consensus | 96 |
| Previous | 96.1 |
| 07:55 | EUR |
| Germany Unemployment Change Mar | |
| Actual | 20K |
| Consensus | 5K |
| Previous | 0K |
| Revised | 3K |
| 07:55 | EUR |
| Germany Unemployment Rate Mar | |
| Actual | 6.40% |
| Consensus | 6.30% |
| Previous | 6.30% |
| 08:00 | EUR |
| Germany GDP Q/Q Q1 P | |
| Actual | 0.30% |
| Consensus | 0.20% |
| Previous | 0.30% |
| 09:00 | EUR |
| Eurozone GDP Q/Q Q1 P | |
| Actual | 0.10% |
| Consensus | 0.20% |
| Previous | 0.20% |
| 09:00 | EUR |
| Eurozone CPI Y/Y Apr P | |
| Actual | 3.00% |
| Consensus | 3.00% |
| Previous | 2.60% |
| 09:00 | EUR |
| Eurozone Core CPI Y/Y Apr P | |
| Actual | 2.20% |
| Consensus | 2.20% |
| Previous | 2.30% |
| 11:00 | GBP |
| BoE Interest Rate Decision | |
| Actual | 3.75% |
| Consensus | 3.75% |
| Previous | 3.75% |
| 11:00 | GBP |
| MPC Official Bank Rate Votes | |
| Actual | 1--0--8 |
| Consensus | 0--0--9 |
| Previous | 0--0--9 |
| 12:15 | EUR |
| ECB Rate On Deposit Facility | |
| Actual | 2.00% |
| Consensus | 2.00% |
| Previous | 2.00% |
| 12:15 | EUR |
| ECB Main Refinancing Operations Rate | |
| Actual | 2.15% |
| Consensus | 2.15% |
| Previous | 2.15% |
| 12:30 | CAD |
| GDP M/M Feb | |
| Actual | 0.20% |
| Consensus | 0.20% |
| Previous | 0.10% |
| 12:30 | USD |
| GDP Annualized Q1 P | |
| Actual | 2.00% |
| Consensus | 2.20% |
| Previous | 0.50% |
| 12:30 | USD |
| GDP Price Index Q1 P | |
| Actual | 3.60% |
| Consensus | 3.90% |
| Previous | 3.70% |
| 12:30 | USD |
| Initial Jobless Claims (Apr 24) | |
| Actual | 189K |
| Consensus | 212K |
| Previous | 214K |
| 12:30 | USD |
| Personal Income M/M Mar | |
| Actual | 0.60% |
| Consensus | 0.30% |
| Previous | -0.10% |
| Revised | 0% |
| 12:30 | USD |
| Personal Spending Mar | |
| Actual | 0.90% |
| Consensus | 0.90% |
| Previous | 0.50% |
| Revised | 0.60% |
| 12:30 | USD |
| PCE Price Index M/M Mar | |
| Actual | 0.70% |
| Consensus | 0.70% |
| Previous | 0.40% |
| 12:30 | USD |
| PCE Price Index Y/Y Mar | |
| Actual | 3.50% |
| Consensus | 3.50% |
| Previous | 2.80% |
| 12:30 | USD |
| Core PCE Price Index M/M Mar | |
| Actual | 0.30% |
| Consensus | 0.30% |
| Previous | 0.40% |
| 12:30 | USD |
| Core PCE Price Index Y/Y Mar | |
| Actual | 3.20% |
| Consensus | 3.20% |
| Previous | 3.00% |
| 12:45 | EUR |
| ECB Press Conference | |
| Actual | |
| Consensus | |
| Previous | |
| 13:45 | USD |
| Chicago PMI Apr | |
| Actual | 49.2 |
| Consensus | 55.3 |
| Previous | 52.8 |
| 14:30 | USD |
| Natural Gas Storage (Apr 24) | |
| Actual | 79B |
| Consensus | 83B |
| Previous | 103B |
Fed Holds Steady as Internal Split Highlights Growing Policy Uncertainty
Federal Reserve left its policy rate unchanged at 3.50–3.75%, in line with expectations, but the decision revealed a widening divide within the Committee. Governor Stephen Miran again dissented in favor of a 25bps cut, while Beth Hammack, Neel Kashkari, and Lorie Logan opposed the inclusion of an easing bias in the statement, signaling resistance to any premature shift toward rate cuts.
The statement itself struck a balanced tone. Economic activity was described as expanding at a "solid pace", while labor market conditions remain stable but without strong job gains. Inflation was acknowledged as "elevated", partly due to rising global energy prices.
The policy split suggests the Fed is far from a consensus on the next move. While one camp is leaning toward easing in response to cooling growth and labor dynamics, another is pushing back against signaling cuts while inflation remains above target.
For markets, the message leans toward a cautious hold rather than a clear directional shift. The absence of a unified easing signal, combined with resistance from several officials, suggests that rate cuts are not imminent. Instead, policy is likely to remain data-dependent, with the Fed waiting for clearer evidence on whether energy-driven inflation will prove temporary or more persistent.
(FED) Federal Reserve Issues FOMC Statement
Recent indicators suggest that economic activity has been expanding at a solid pace. Job gains have remained low, on average, and the unemployment rate has been little changed in recent months. Inflation is elevated, in part reflecting the recent increase in global energy prices.
The Committee seeks to achieve maximum employment and inflation at the rate of 2 percent over the longer run. Developments in the Middle East are contributing to a high level of uncertainty about the economic outlook. The Committee is attentive to the risks to both sides of its dual mandate.
In support of its goals, the Committee decided to maintain the target range for the federal funds rate at 3‑1/2 to 3‑3/4 percent. In considering the extent and timing of additional adjustments to the target range for the federal funds rate, the Committee will carefully assess incoming data, the evolving outlook, and the balance of risks. The Committee is strongly committed to supporting maximum employment and returning inflation to its 2 percent objective.
In assessing the appropriate stance of monetary policy, the Committee will continue to monitor the implications of incoming information for the economic outlook. The Committee would be prepared to adjust the stance of monetary policy as appropriate if risks emerge that could impede the attainment of the Committee's goals. The Committee's assessments will take into account a wide range of information, including readings on labor market conditions, inflation pressures and inflation expectations, and financial and international developments.
Voting for the monetary policy action were Jerome H. Powell, Chair; John C. Williams, Vice Chair; Michael S. Barr; Michelle W. Bowman; Lisa D. Cook; Philip N. Jefferson; Anna Paulson; and Christopher J. Waller. Voting against this action were Stephen I. Miran, who preferred to lower the target range for the federal funds rate by 1/4 percentage point at this meeting; and Beth M. Hammack, Neel Kashkari, and Lorie K. Logan, who supported maintaining the target range for the federal funds rate but did not support inclusion of an easing bias in the statement at this time.
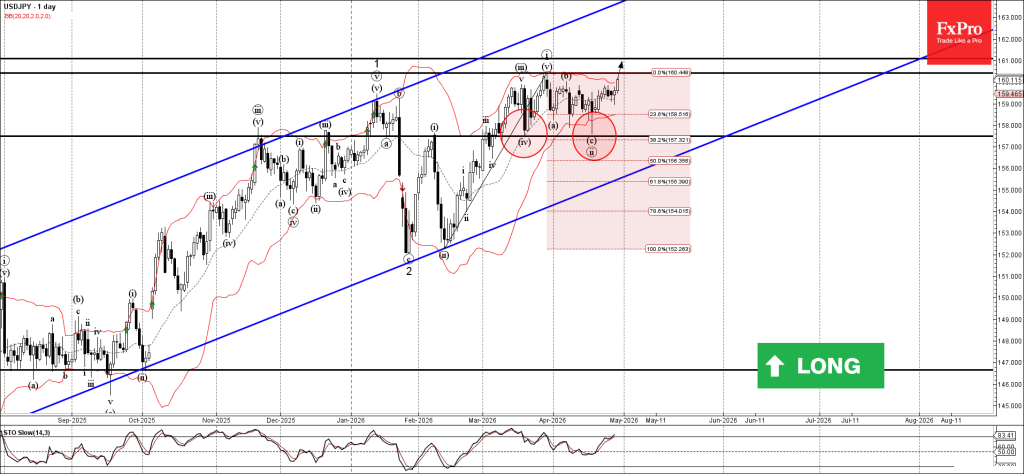
USDJPY Wave Analysis
USDJPY: ⬆️ Buy
- USDJPY from the support zone
- Likely to test resistance levels 160.40 and 161.00
USDJPY currency pair recently reversed from the support zone between the key support level 157.50 (which stopped the previous correction iv) and the lower daily Bollinger Band.
The upward reversal from this support zone created the daily Hammer, which started the earlier short-term impulse wave iii.
Given the strong daily uptrend and the bullish US dollar sentiment seen today, USDJPY currency pair can be expected to rise to the next resistance levels 160.40 and 161.00.
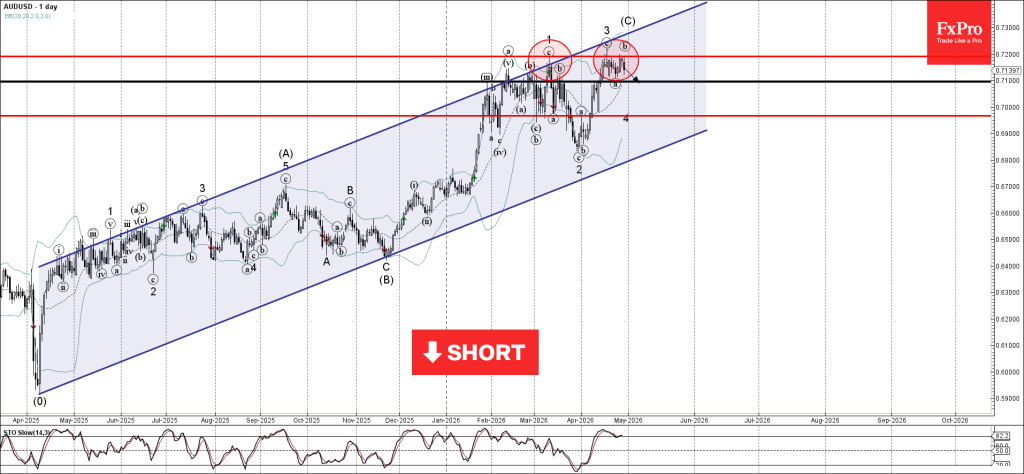
AUDUSD Wave Analysis
AUDUSD: ⬇️ Sell
- AUDUSD reversed from key resistance level 0.7190
- Likely to fall to support level 0.7100
AUDUSD currency pair recently reversed from the resistance zone between the key resistance level 0.7190 (which has been reversing the price from March) and the upper daily Bollinger Band.
The downward reversal from the key resistance level 0.7190 stopped the earlier short-term impulse wave 3 – which belongs to wave (C) from November.
Given the strength of the resistance level 0.7190 and the overbought daily Stochastic, AUDUSD currency pair can be expected to fall to the next support level 0.7100 (low of the previous wave ii).
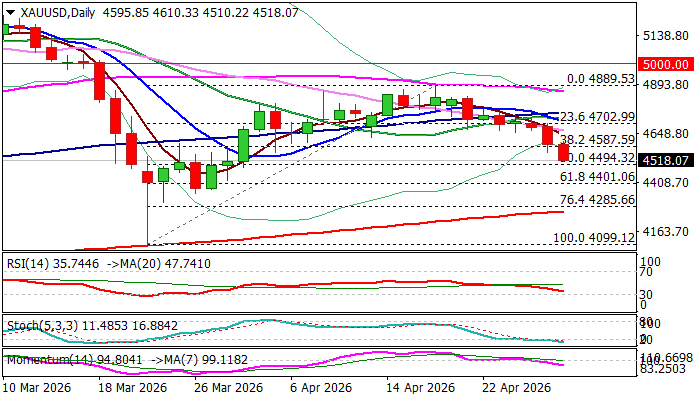
Gold Remains Under Increased Pressure Ahead of FOMC Decision and More Important Remarks from Powell
Gold holds in red for the third consecutive day, pressured by growing fears that elevated oil prices would lift inflation and prompt Fed to take more hawkish stance on monetary policy.
The yellow metal remains in defensive since mid-April ($4889 recovery peak) and has so far retraced over 38.2% of $4099/$4889 recovery leg, with weakening daily studies (10/100; 10/20DMA bear-crosses / strengthening negative momentum) opening prospects for deeper drop.
Bears face immediate targets at $4500/$4494 (psychological / 50% retracement) where headwinds could be expected due to oversold conditions, but upticks are likely to be limited (ideally to be capped under $4600 zone) and keep protected the most significant barrier at $4702 (daily Ichimoku cloud base).
Clear break of $4500 zone to open way towards $4401 (Fibo 61.8%) and unmask 200DMA ($4264).
With situation in the Middle East remaining fragile, traders shift focus towards Fed policy decision (due later today) and more important remarks from Chief Powell (as the central bank is widely expected to stay on hold this time) to estimate the depth of the impact from the war and signals of Fed’s direction in coming months.
Overall picture should remain negative in case of persisting uncertainty or escalation in the Middle East, as this would also accelerate Fed’s action on interest rates and likely shift narrative towards fresh policy tightening.
Res: 4587; 4632; 4702; 4725
Sup: 4494; 4401; 4351; 4264
Bank of Canada Neutral Hold (2.25%) – USD/CAD Rallies to 1.37 – Press Conference Coming Up
- The Bank of Canada kicked off the Central Bank sessions with a hawkish hold
- Oil prices continue to maintain bullish inflows in the Canadian Dollar but communications are still mixed
- In-depth Technical Analysis and technical levels for USD/CAD and EUR/CAD
The Bank of Canada just released its Policy Rate decision, maintaining rates unchanged for the fourth time since October 2025 and, quite frankly, not hinting at much change in its stance.
The Statement (which you can access here) had nothing particularly surprising, with the Bank noting that the outlook isn't much different from that indicated in the January Decision.
Some concerns about the Quarterly MPC Projections regarding the economic outlook maintain the Bank's view of a not-so-strong Canadian economy, which takes some pricing out of rate hikes.
Nonetheless, the BoC assumed a $75 Crude Oil barrel, so if it stays closer to $100 for the next meeting, the Bank should turn more hawkish.
On the Loonie, it yoyo'd quite aggressively throughout the ups and downs of the Middle Eastern war – With WTI Crude bouncing back above $100 just today, the CAD is seeing a two-catalyst recipe for its daily performance; At least against other Major currencies (with USD traders awaiting the FOMC).
Even if the war really settles, the Canadian Dollar should not regain its prior lows, with increased Oil revenues and orders, which would underpin the CAD for the next few months at least – The BoC mentioned this in relation to Oil developments.
"While the war in Iran may alter its composition, overall GDP growth is little changed in the updated forecast: Since Canada is a large net exporter of oil, higher oil prices increase national income even as consumers are squeezed by higher gasoline prices."
The Press Conference starts very soon, access it here.
Let's dive right into a two-timeframe USD/CAD analysis.
USD/CAD Daily and Intraday Technical Analysis
USD/CAD Daily Chart
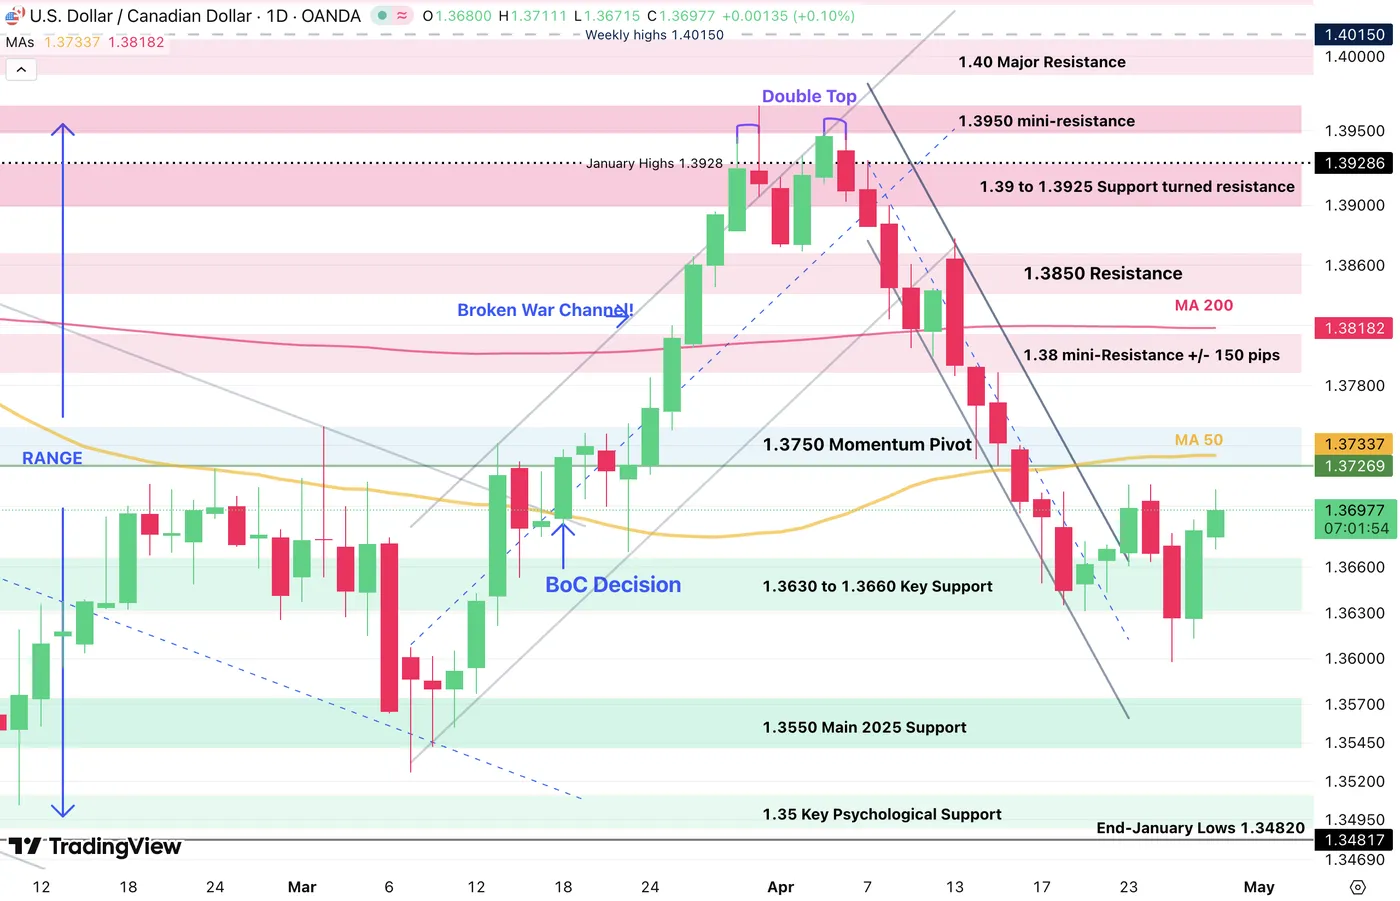
USD/CAD Daily Chart, April 29, 2026 – Source: TradingView
USD/CAD has officially stalled its correction, now bouncing from its 1.3660 Support Zone.
With the BoC not showing many hawkish signs, the CAD is immediately losing some strength and this should normally extend the price action back towards the 50-Day Moving Average (1.37330).
Above 1.3750, expect to see further rallies in the North American Pair back towards 1.39.
USD/CAD 1H Chart and Trading Levels
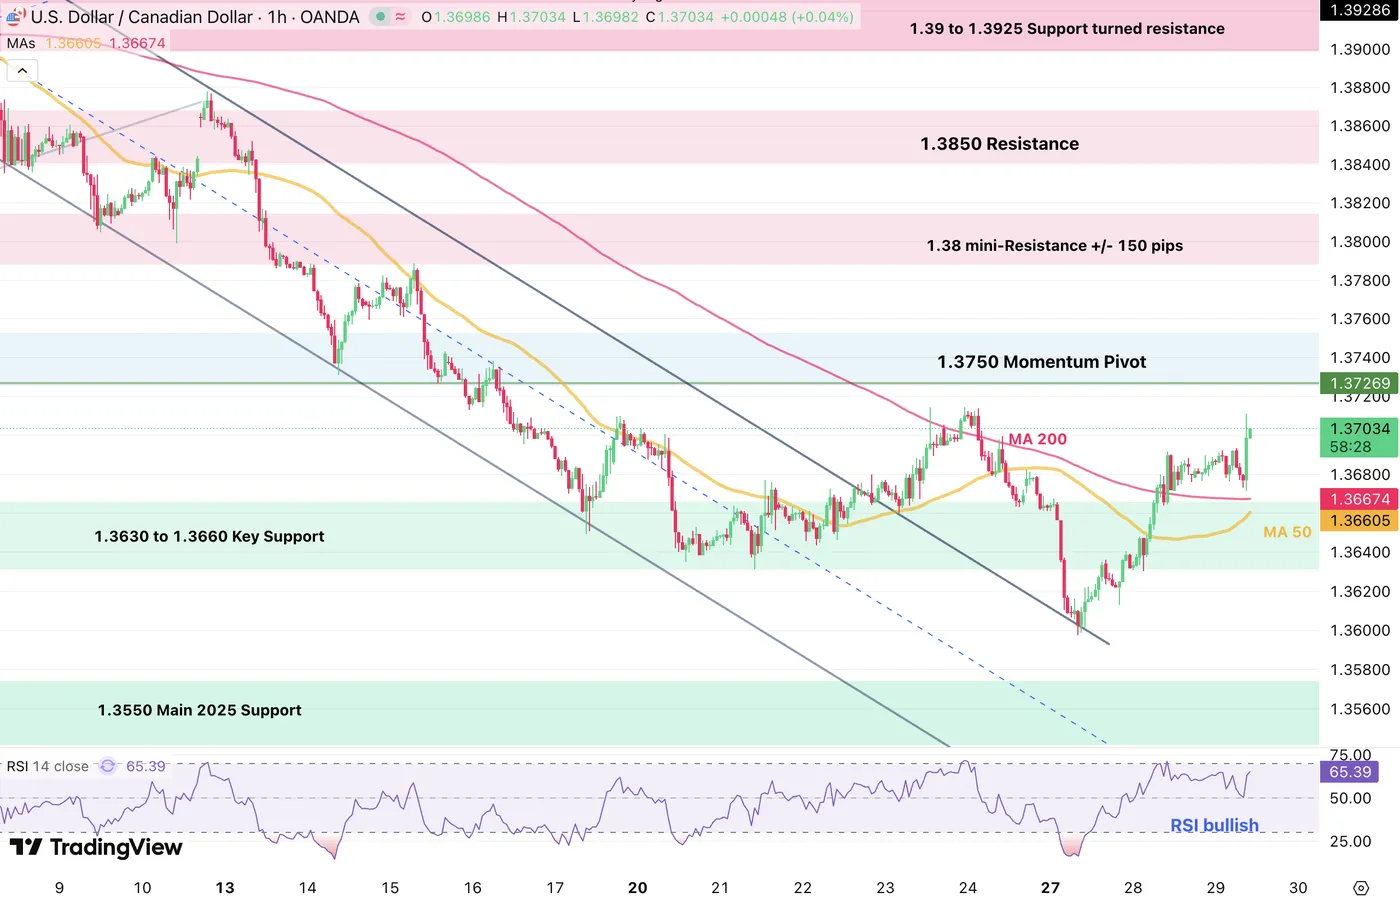
USD/CAD 1H Chart, April 29, 2026 – Source: TradingView
The FX Pair has officially broken its downward channel and having passed above its 50 and 200 Hour MAs, the rebound should see continuation.
Look for a break above the 1.3710 particularly if the FOMC adds fuel to the fire in the US Dollar – It will be Jerome Powell's ultimate Press Conference, so don't expect anything too crazy there.
Levels to place on your USD/CAD charts:
Resistance Levels:
- 1.3720 – 1.3750 Pivot 50-Day Moving Average (1.37330).
- 1.38 mini-Resistance +/- 150 pips
- 1.3850 - 1.3870 Momentum Pivot (Channel retest 1.3860)
- 1.39 to 1.3925 Support turned resistance
Support Levels:
- 1.3675 200-Hour MA
- 1.3630 to 1.3660 Key Support
- 1.3550 Main 2025 Support (Range Lows)
- End-January Lows 1.34820
Bank of Canada Holds, But Cites Risks from Oil Prices and Trade
The Bank of Canada held its policy rate at 2.25%, maintaining the level it has kept in place since October.
The Bank said its outlook for growth “has not changed significantly since our January projection,” despite global shocks. It noted that higher oil prices alter the composition of growth, but have only a small net effect on the total.
The Monetary Policy Report projects that GDP growth will be “1.2% in 2026 and 1.6% in 2027,” with inflation returning to target as oil prices ease. The Bank's estimates of the range for the neutral rate were unchanged at 2.25% to 3.25%, while potential GDP was revised marginally higher on past upward revisions to GDP and the capital stock, and some assumed positive impacts from AI adoption.
Higher energy prices are expected to cause CPI inflation to “peak around 3% in April and ease back to the 2% target by early next year.” While near‑term inflation expectations have moved up due to gasoline and food prices, the Bank emphasized that, “[a]s expected, there is little evidence that higher oil prices have fed through to other goods and services prices more broadly,” but that this needs to be closely monitored. It also noted that longer‑term expectations remain anchored.
Governing Council judged that “a policy rate close to current settings looks appropriate” if oil prices decline and tariffs remain unchanged. However, risks are elevated, noting that should "significant new trade restrictions" be imposed on Canada by the U.S., more cuts may be needed. Conversely, if oil prices continue to rise, and remain elevated, "the risk that higher energy prices become ongoing generalized inflation increases" raising the prospect for "consecutive increases in the policy rate".
Key Implications
As expected, the Bank of Canada (BoC) stayed put. Inflation readings are due to pick up as the energy shock gradually propagates through the economy. However, they are starting from a good place as near-term measures of core inflation have trended well within the target range, and the labour market has remained soft. These factors underpin a softer starting point for inflation and the risks the BoC is looking to confront.
From our lens, the outlook has only gradually shifted. The BOS survey suggested some upside to business confidence, but the outlook for firms remains very murky. The worry is what happens with energy prices. Our expectation (like the BoC's) is that prices peak this quarter and gradually fall, taking pressure off inflation and allowing the BoC to stay on hold at the lower end of their neutral range. Of course, the risks to the outlook at high, and remain contingent on the course of the Middle East conflict.