Sample Category Title
Market Positioning Driven by Considerations on What Could/Should Be Appropriate Fed Tactics
Markets
(US) eco data on Friday were few and mostly second tier. US August import and export price data were softer than expected. The Michigan consumer confidence was slightly better than expected (69 from 67.9). The inflation expectations subindices (1-y 2.7% from 2.8%, LT 3.1% from 3.0%) also didn’t add much to the Fed easing debate. US yields declined further between 5.7 bps (2-y) and 0.9 bps (30-y) but most of this move already realized before the publication of the data. Market positioning was driven by considerations on what could/should be an appropriate Fed tactics. What Fed-strategy (fast 50 bps steps start, or gradual 25 bp lift-off) would best serve the Fed’s aim to engineer a soft landing with no additional further damage to the labour market? This debate, also ‘orchestrated’ by some high profile articles in the financial press (WSJ, FT) on Friday again tilted back to a growing chance of 50 bps first step (+/- 60% chance). German Bunds again underperformed Treasuries with yields changing between 1.4 bps (2-y) and +0.6 bps (30-y). ECB policy makers on Friday and this weekend basically confirmed ECB Chair Lagarde’s guidance from press conference on Thursday that easing of inflationary pressures should allow the ECB to cut rates further (Nagel, Wunsch) but they didn’t commit on the timing of further steps. EBC Holzmann indicated that December rather than October might be the right time for a next ECB cut. The revival of expectations on an aggressive start of the Fed easing cycle, this time again supported equities with the Dow (+ 0.72%) and the S&P 500 (+0.54%) again trading within reach of the all-time records. Easing of global financial conditions again put the dollar in the defensive. DXY again tested the 101 level but closed above (101.1). Gains in EUR/USD were marginal (1.1075). The yen still outperformed (USD/JPY close 140.85).
This morning, Japanese, mainland China and Korean markets are closed. Chinese August activity data (retail sales, production & investment data published this weekend) again showed a mediocre growth performance spurring calls for additional policy stimulus (cf infra). The dollar remains under pressure with EUR/USD testing the 1.11 barrier. USD/JPY (140.1) is even breaking below the key 140.25 area (December low). Today, the data calendar is thin with the US Empire manufacturing survey the exception to the rule (expected at -4.3 from -4.7). ECB governors Panetta, de Guindos and Lane are scheduled to speak. We don’t see much reason for markets to backtrack on its assessment of a growing chance for a 50 bps Fed inaugural rate cut on Wednesday. We don’t expect the US August retail sales (to be published tomorrow) to be a gamechanger anymore. On FX, USD weakness looks to be the by default FX bias going into the Fed policy decision. The Bank of England (Thursday) and the Bank of Japan (Friday) also will hold regular policy meeting but are expected to leave policy unchanged.
News & Views
UK property website Rightmove said that average asking prices for homes rose by 0.8% M/M in September following a steep 1.5% drop in August. It’s double the long-term average pace in September. The average price stood at £370 759, which is 1.2% higher on a yearly basis. Rightmove’s director of property science referred to the new government and the Bank of England’s first rate cut as key drivers. Improving buyer demand was also visible in the increase of number of sales agreed between buyers and sellers (+27% Y/Y). The average five-year fixed mortgage was 4.67% in September, coming off a 6.11% peak in July 2023. London house prices increased by 0.7% M/M (1.4% Y/Y) to average £682 375.
The People Bank of China on Friday signaled more action in fighting deflation and reviving the economy. In a rare statement, they vowed to make maintaining price stability and pushing for the mild rebound in prices an important consideration for monetary policy. They also stressed meeting reasonable financing demand for consumption in a more targeted way. Policymakers are “preparing to launch some additional measures, further lower the financing costs for businesses and households, and keep liquidity reasonably ample.” The central bank sets 5-yr (currently 3.85%) and 1-yr prime loan rates (3.35%) at its September 20 meeting. Both were reduced by 10 bps in July.
Graphs
GE 10y yield
The ECB cut policy rates by 25 bps in June and in September. Stubborn inflation (core, services) make follow-up moves less evident. We expect the central bank to stick with the quarterly reduction pace. Disappointing US and unconvincing EMU activity data dragged the long end of the curve down. The move accelerated during the early August market meltdown.
US 10y yield
The Fed in its July meeting paved the way for a first cut in September. It turned attentive to risks to the both sides of its dual mandate as the economy is moving to a better in to balance. The pivot weakened the technical picture in US yields. A string of weak eco data and a risk-off market climate pushed and kept the 10-yr sub 4%. We think we could be up to three 50 bps rate cuts this year.
EUR/USD
EUR/USD moved above the 1.09 resistance area as the dollar lost interest rate support at stealth pace. US recession risks and bets on fast and large rate cuts trumped traditional safe haven flows into USD. EUR/USD 1.1276 (2023 top) serves as next technical references.
EUR/GBP
The BoE delivered a hawkish cut in August. Policy restrictiveness will be further unwound gradually on a pace determined by a broad range of data. The strategy similar to the ECB’s balances out EUR/GBP in a monetary perspective. Recent better UK activity data and a cautious assessment of BoE’s Bailey at Jackson Hole are pushing EUR/GBP lower in the 0.84/0.086 range.
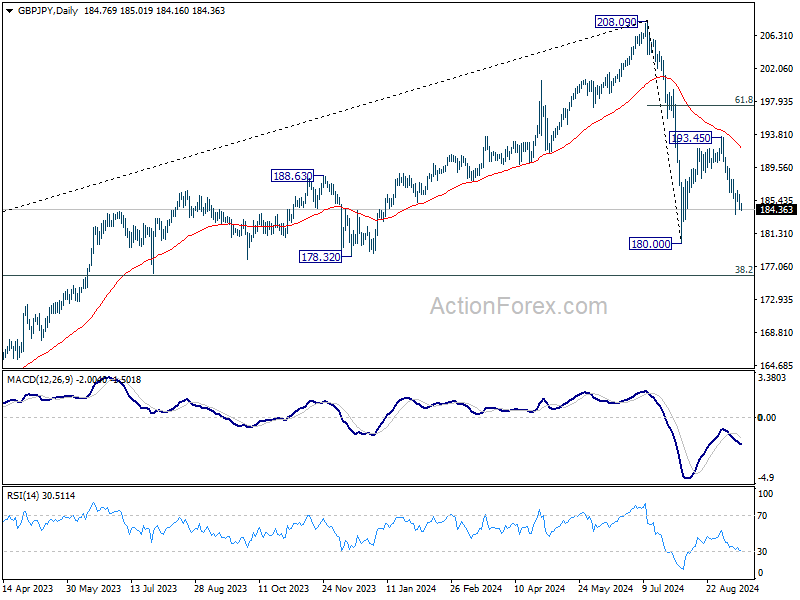
GBP/JPY Daily Outlook
Daily Pivots: (S1) 184.03; (P) 185.13; (R1) 185.88; More...
Intraday bias in GBP/JPY remains neutral for the moment, and outlook will stay cautiously bearish as long as 189.72 resistance holds. Below 183.70 will resume the fall from 193.45 to retest 180.00 low. Firm break there will extend whole decline from 208.09 to 175.94 fibonacci level.
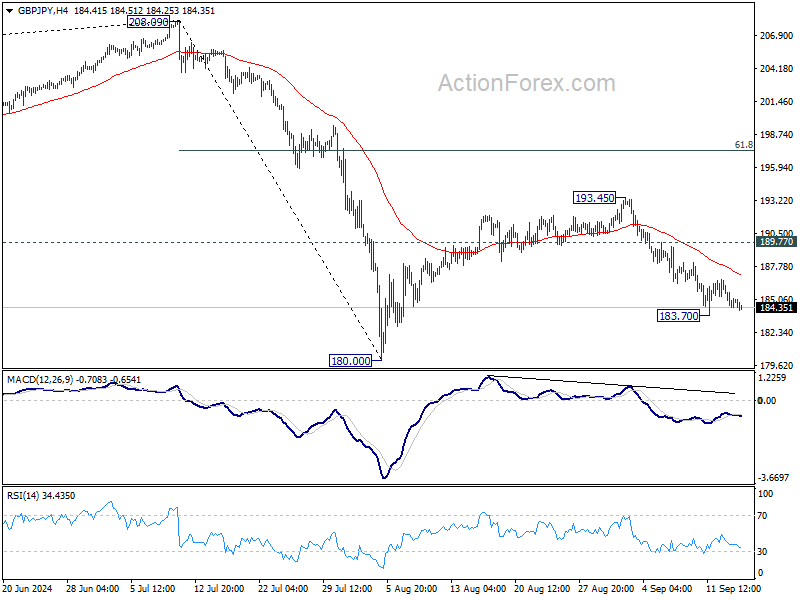
In the bigger picture, price actions from 208.09 are seen as a correction to whole rally from 123.94 (2020 low). The range of consolidation should be set between 38.2% retracement of 123.94 to 208.09 at 175.94 and 208.09. However, decisive break of 175.94 will argue that deeper correction is underway.
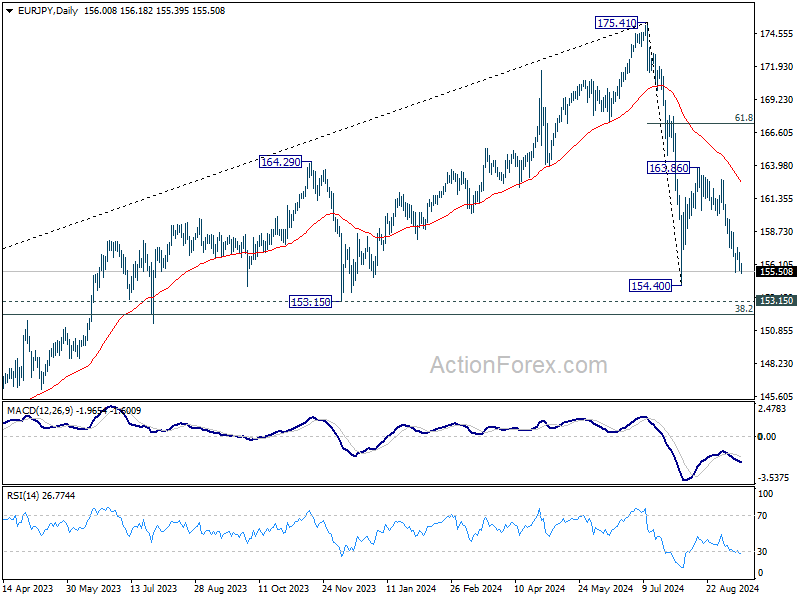
EUR/JPY Daily Outlook
Daily Pivots: (S1) 155.38; (P) 156.26; (R1) 156.90; More....
Intraday bias in EUR/JPY is back on the downside with breach of 155.45 temporary low. Fall from 163.86 is resuming to retest 154.40 low. Firm break there will resume whole decline from 1785.41 to 153.15 support, and possibly further to 152.11 fibonacci level. On the upside, above 157.50 minor resistance will turn intraday bias neutral again.
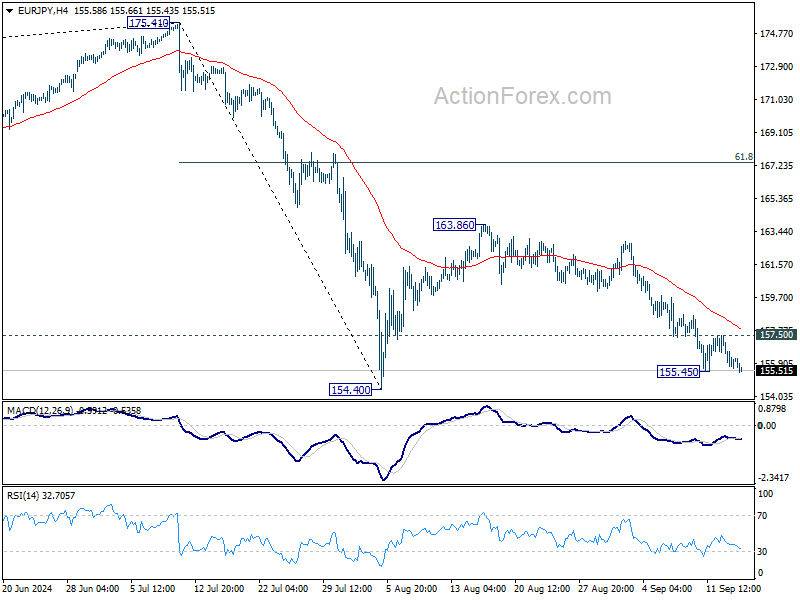
In the bigger picture, price actions from 175.41 are seen as correction to rally from 114.42 (2020 low). The range of consolidation should have been set between 38.2% retracement of 114.42 to 175.41 at 152.11 and 175.41 high. However, decisive break of 152.11 would argue that deeper correction is underway.
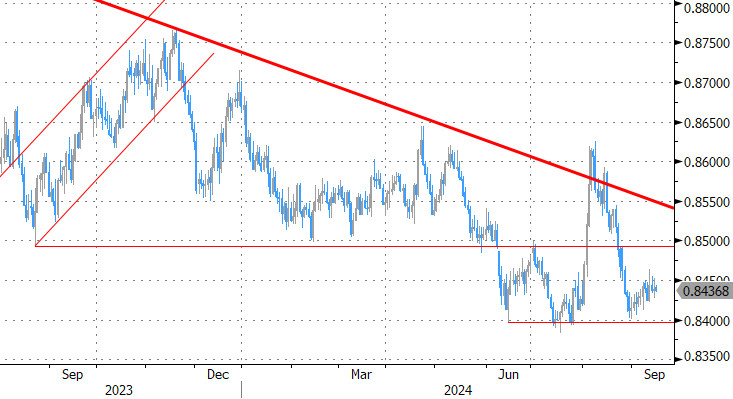
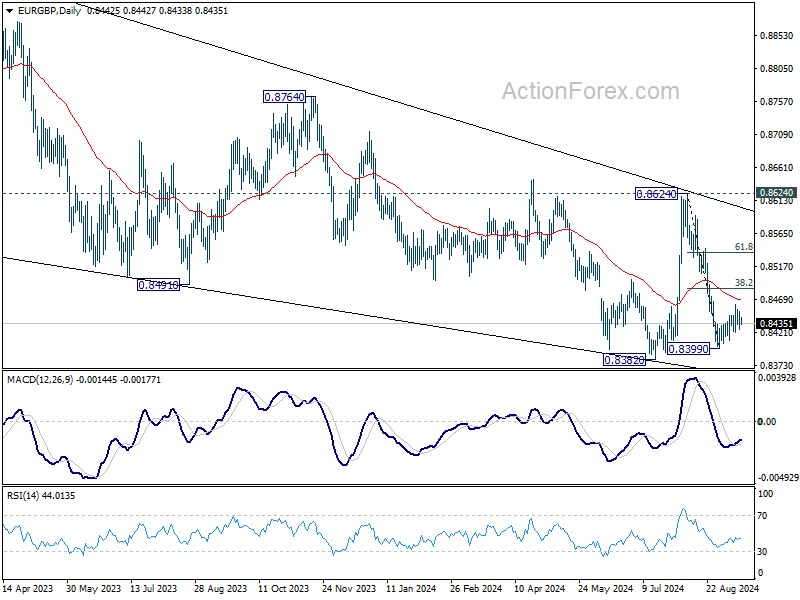
EUR/GBP Daily Outlook
Daily Pivots: (S1) 0.8427; (P) 0.8440; (R1) 0.8453; More...
Intraday bias in EUR/GBP remains neutral for the moment. Consolidation from 0.8399 is in progress and stronger recovery cannot be ruled out. But upside should be limited by 38.2% retracement of 0.8624 to 0.8399 at 0.8485. Break of 0.8399 will bring retest of 0.8382 low. Firm break there will resume larger down trend. However, sustained break of 0.8485 will bring stronger rally to 61.8% retracement at 0.8538 and possibly above.
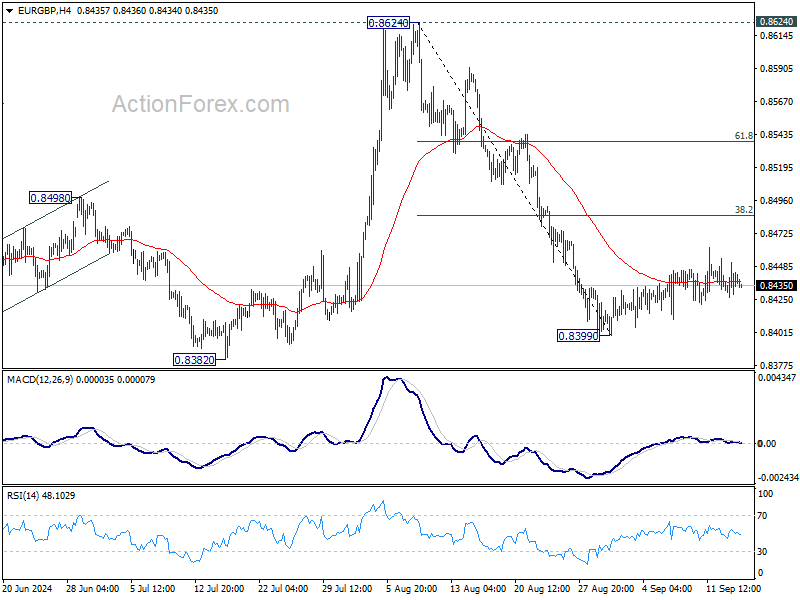
In the bigger picture, as long as 0.8624 resistance holds, down trend from 0.9267 is expected to continue. Firm break of 0.8382 will target 0.8201 (2022 low). However, decisive break of 0.8624 will indicate that such down trend has completed, and turn outlook bullish for 0.8764 resistance next.
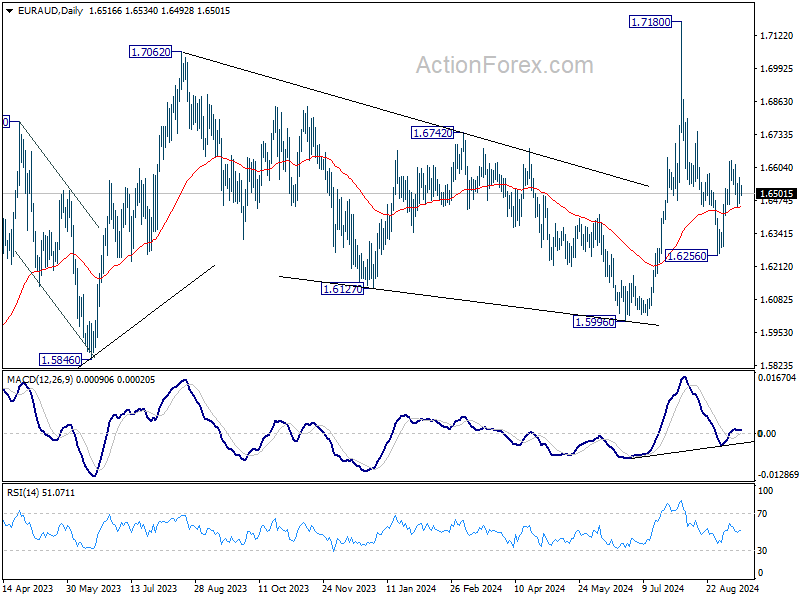
EUR/AUD Daily Outlook
Daily Pivots: (S1) 1.6467; (P) 1.6516; (R1) 1.6570; More...
Intraday bias in EUR/AUD remains neutral for the moment. For now, the favored case remains that corrective fall from 1.7180 has completed at 1.6256 already. On the upside, above 1.6629 will resume the rebound for retesting 1.7180 high. However, firm break of 1.6457 minor support will dampen this view and turn bias back to the downside for 1.6256 again.
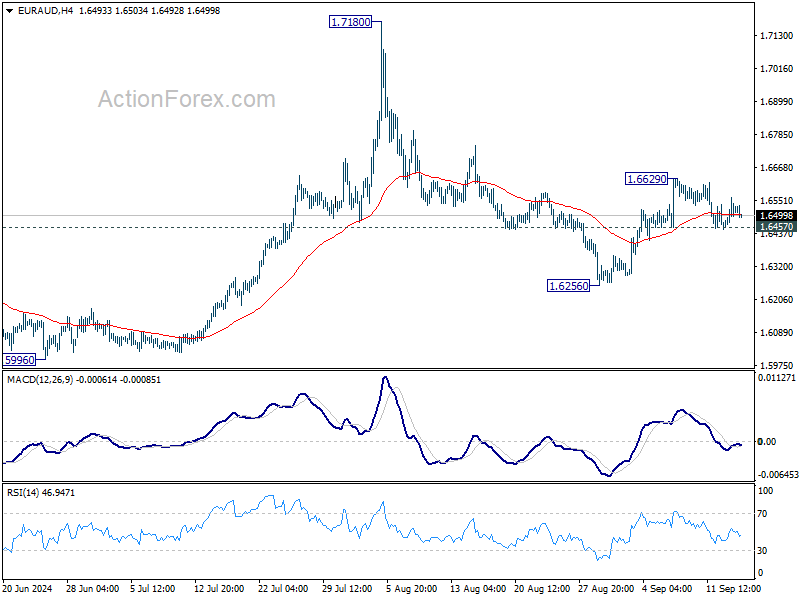
In the bigger picture, outlook is mixed up by the deeper than expected fall from 1.7180. Yet as long as 1.5996 support holds, up trend from 1.4281 (2022 low) is still in favor to resume at a later stage. Firm break of 1.7180 will pave the way to 61.8% projection of 1.4281 to 1.7062 from 1.5996 at 1.7715.
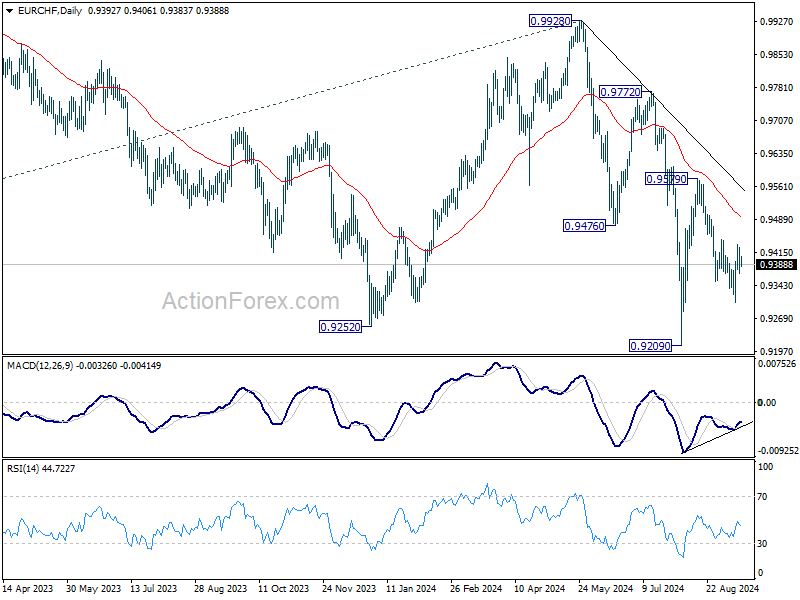
EUR/CHF Daily Outlook
Daily Pivots: (S1) 0.9371; (P) 0.9404; (R1) 0.9437; More....
Intraday bias in EUR/CHF remains neutral for moment, and outlook stays bearish as long as 0.9444 resistance holds. On the downside, below 0.9305 will resume the fall from 0.9579 to retest 0.9209 low. Firm break there will resume larger down trend. However, decisive break of 0.9444 will argue that the fall from 0.9579 has completed as a corrective move. Intraday bias will be turned bias to the upside for 0.9579.
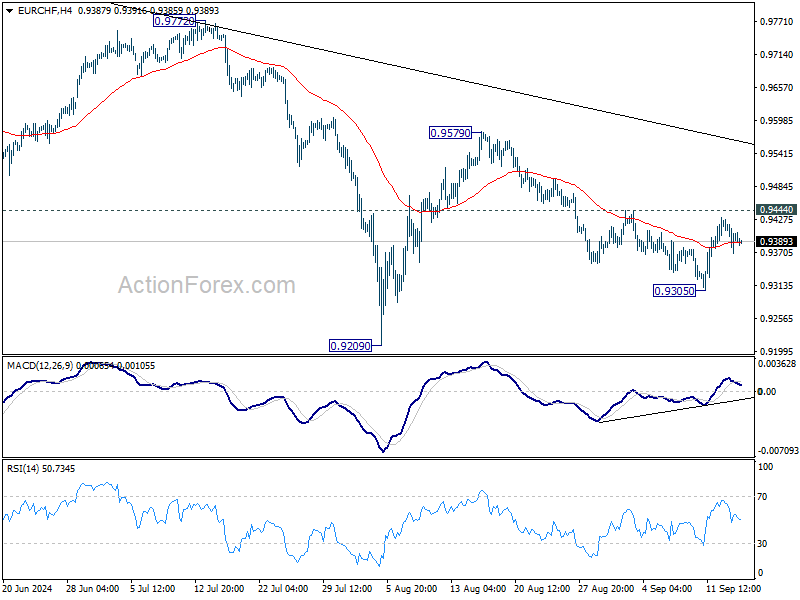
In the bigger picture, medium term corrective pattern from 0.9407 (2022 low) might have completed with three waves to 0.9928. Decisive break of 0.9252 (2023 low) will confirm long term down trend resumption. Next target will be 61.8% projection of 1.1149 to 0.9407 from 0.9928 at 0.8851. For now, outlook will stay bearish as long as 0.9928 resistance holds, even in case of strong rebound.
Big Week for Central Banks
We are heading into a busy week with major central bank decisions. The Federal Reserve (Fed), the Bank of England (BoE) and the Bank of Japan (BoJ) will announce their latest policy verdicts this week. The Brits and the Japanese are expected to remain seated on their hands and the Fed will certainly lower its rates this week. But by how much – is the million-dollar question!
A Fed rate cut is fully priced in, but investors can’t agree on the size of the cut that the Fed should deliver this week. Some – including myself – think that a 25bp cut would be appropriate to start cutting rates as inflation is cooling – but core inflation came in slightly higher than expected last week on a monthly basis. Corporate earnings last quarter were robust, growth in Magnificent 7 earnings slowed but remained very strong and the remaining S&P493 earnings growth turned positive for the first time since 2022. US GDP printed a 3% growth in Q2 and Atlanta Fed’s GDP Now forecasts suggests that the Q3 growth will likely be above 2%. The US labour market cools, but the cooldown doesn’t look alarming (alarming would be a series of NFP read between 50 and 100K and unemployment rate near 4.5%.)
But wagers for a 50bp cut are rising into Wednesday’s decision, as some investors think that the Fed should’ve cut rates already in July and that it may have fallen behind the curve by not doing so. Therefore, to make up for the delay, they should deliver a 50bp cut, otherwise the economic slowdown will accelerate and push the economy into a recession. I believe that if that’s the case, there is something that the Fed knows that we do not know.
Anyway, the second camp gained confidence late Friday and the probability of a 50bp cut outpaced the probability of a 25bp cut. The S&P500 closed the week a touch below its ATH level after recording a 4% rally over the week, Nasdaq 100 gained more than 6% last week, and the Dow Jones index rallied more than 2.5% and closed the week at a spitting distance from a ATH level, as well.
In the FX, the rising bets of a 50bp cut continues to weigh on the US treasury yields and the dollar. The 2-year yield is under pressure below the 3.60% level this morning, while the 10-year yield settles at 3.65% this morning. Gold closed last week at a fresh ATH and is pushing higher this morning in Asia, as the US dollar kicks off the week under a decent selling pressure. Bitcoin retreated during the weekend, even after an another assassination attempt on Trump during the weekend. The EURUSD flirts with the 1.11 mark, as the European Central Bank (ECB) didn’t want to commit to another rate cut at its policy meeting last Thursday. Cable, on the other hand, extends gains above the 1.31 level as the BoE is expected to maintain its rates unchanged when it meets this week as British policymakers made it clear at their last meeting – where they cut rates - that they are not planning to embark on a series of rate cuts. In Japan – on holiday today - the USDJPY fell to the lowest level since December despite the expectation that the BoJ won’t increase its rates this week. The BoJ is expected to wait until December, or January before delivering another hike. If that’s the case, the USDJPY’s destiny will remain in the hands of the Fed. If the Fed delivers a 50bp cut this week, we shall see the USDJPY move sustainably below the 140 level, but if the Fed is satisfied with a 25bp cut, the USDJPY should see support at the 140 level.
In energy, the week starts on a weak note. US crude tested but failed to clear the $70pb offers last Friday, and is under a decent selling pressure this morning due to another set of bad news from China. The latest data suggests that retail sales grew slower than expected in August, but more importantly, the industrial production grew slower-than-expected and home prices fell more rapidly despite the Chinese government’s efforts to stop bleeding. As Japan, China is closed for bank holiday today. But the HSI index is slightly lower this morning, while the CSI 300 sank to the lowest level since February last Friday.
Coming back to oil, crude oil continues to suffer from the Chinese weakness and even the rising bets of a 50bp cut from the Fed weren’t enough to send the price of a barrel of US crude above $70pb. Trend and momentum indicators remain comfortably negative, and the RSI index hints that oil is not in the oversold territory just yet, suggesting that we could see a further weakness in oil prices. Strong resistance is seen at $70/72pb range for US crude, and Brent crude – which closed last week at $72pb - could make another attempt below the $70pb mark.
It’s Central Bank Week
In focus today
There are no major market movers today. The main event to watch this week will be Wednesday's US policy rate decision, where we expect a 25bp cut from the FOMC (see more in Fed Preview - Dovish 25bp, 13 September). We also look out for the final euro area inflation data on Wednesday.
Later in the week, we expect Norges Bank and the Bank of England to keep policy rates unchanged on Thursday, and ditto for the Bank of Japan on Friday.
Economic and market news
What happened over the weekend
Data from China showed industrial output growth and retail sales growth slowed more than expected in August, which strengthens the case for new stimulus - something which has been increasingly discussed by commentators. With exchanges across Asia closed for holiday, however, the market impact has so far been muted.
In geopolitics, the FBI said they prevented an apparent assassination attempt on former President Trump at his golf resort in Florida, apprehending a gunman before he could attack. So far, no impact on prediction markets, which still see a slight lead to Vice-President Harris.
What happened on Friday
Market reassessment of the size of the expected rate cut from the Fed due on Wednesday sent the dollar slightly lower (especially against the yen), equities up, and treasury yields down with the 1Y dropping 9bp on the day. Markets have now priced a 50/50 chance that the Fed will deliver a 50bp cut rather than 25bp on Wednesday, up from a 17% probability priced early Thursday.
Equities: Global equities were higher on Friday, marking five consecutive days of increases. With equities up 3% last week, we are now only inches away from an all-time high in the MSCI world indices. Last week was dominated by cyclical outperformance, though it was not as growth- and tech-driven as earlier in 2024 and in 2023. Friday also marked a comeback for small caps, which had been struggling throughout the week. The VIX was down all five days last week and is now at 16.5, indicating that we should not expect more meaningful tailwinds to equities from further reductions in volatility.
In the US on Friday, the Dow was up by 0.7%, the S&P 500 by 0.5%, the Nasdaq by 0.7%, and the Russell 2000 by 2.5%. Asian equity markets are very mixed this morning, while US and European futures are mostly higher.
FI: We have an interesting week ahead of us with central bank meetings in the US (Wednesday), UK (Thursday), Norway (Thursday) and Japan (Friday). US, UK and Norway are all priced for a string of rate cuts in 2024 and especially in the first part of 2025. We expect the Federal Reserve to cut by 25bp this week, while BoE, Norges Bank and BoJ is expected to be on hold. Hence, there should be no major surprises from the various central banks, but markets will be looking for comments on the rate path etc. Norges Bank is especially interesting given the relatively hawkish statement regarding no rate cuts in 2024 compared to the current pricing - see more in our Norges Bank preview, in which we also look at different trades as well as the outlook for the NGB issuance and the upcoming syndication from Norges Bank, which could take place in Q3. See Reading the Markets Norway, 13 September.
FX: Scandies benefited from improved risk appetite, with EUR/NOK hovering around 11.80 and EUR/SEK just above 11.30. We see scope for a further move lower in EUR/NOK on a tactical horizon. The low-yielding JPY and CHF also outperformed in the G10 space on Friday, with USD/JPY nearing 140. EUR/USD is trading just below 1.11, as expectations of a jumbo rate cut from the Fed on Wednesday increased following several news articles. Focus this week shifts to central banks, with Wednesday's FOMC meeting being the most pivotal.
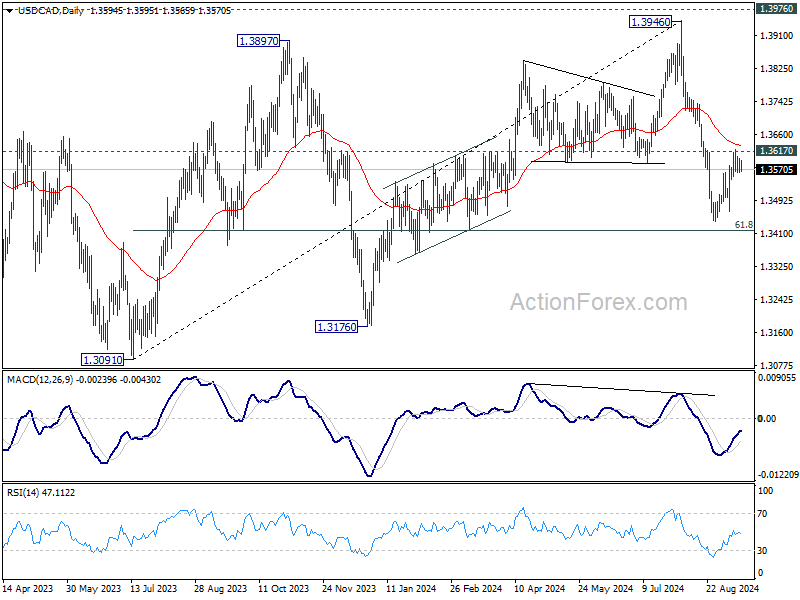
USD/CAD Daily Outlook
Daily Pivots: (S1) 1.3567; (P) 1.3584; (R1) 1.3602; More...
Intraday bias in USD/CAD remains neutral at this point, and another fall remains in favor. On the downside, below 1.3545 minor support will turn bias to the downside for retesting 1.3439 low. Nevertheless, sustained break of 1.3617 will turn bias back to the upside for stronger rebound instead.
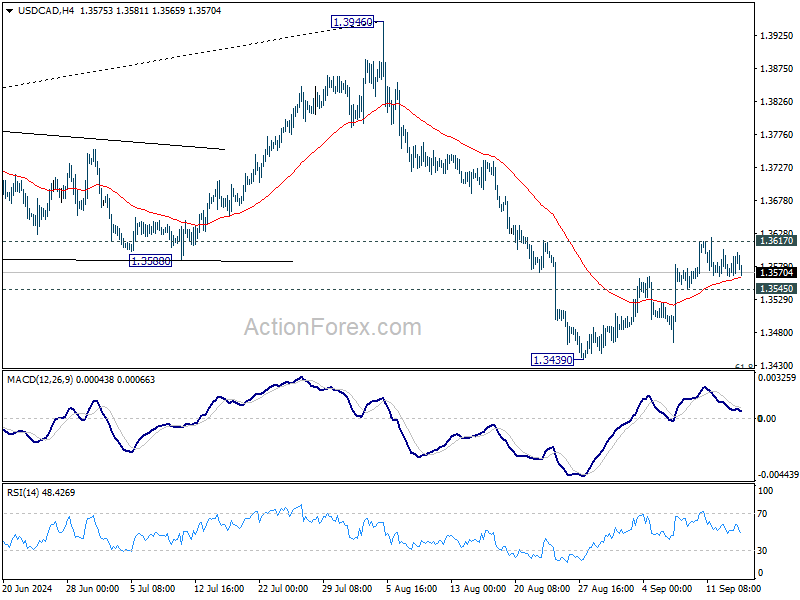
In the bigger picture, corrective pattern from 1.3976 (2022 high) is extending with another falling leg. While deeper decline could be seen, strong support should emerge above 1.2947 resistance turned support to bring rebound. Rise from 1.2005 (2021 low) is still in favor to resume at a later stage.
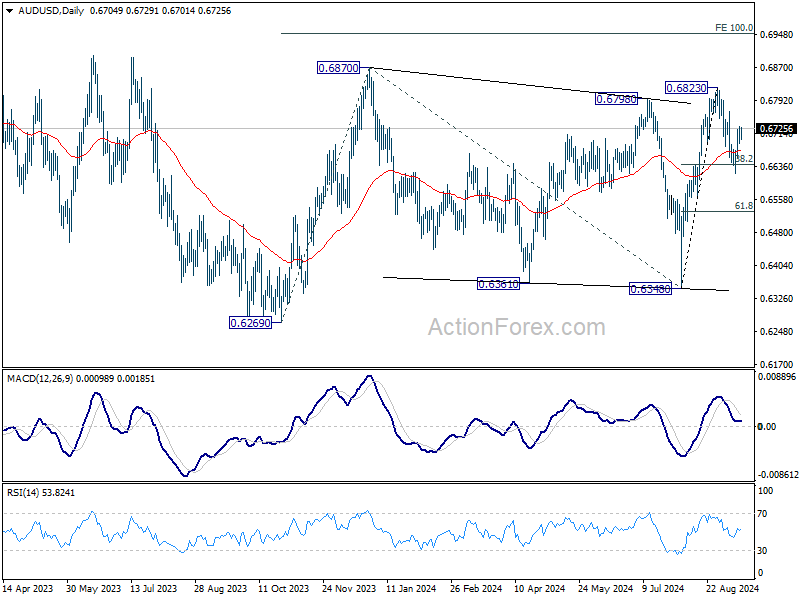
AUD/USD Daily Report
Daily Pivots: (S1) 0.6687; (P) 0.6710; (R1) 0.6728; More...
Intraday bias in AUD/USD stays neutral at this point. On the upside, break of 0.6766 resistance should confirm that corrective pullback from 0.6823 has completed at 0.6621 already. Retest of 0.6823 should be seen next. On the downside, however, sustained break of 38.2% retracement of 0.6348 to 0.6823 will target 61.8% retracement at 0.6529 instead.
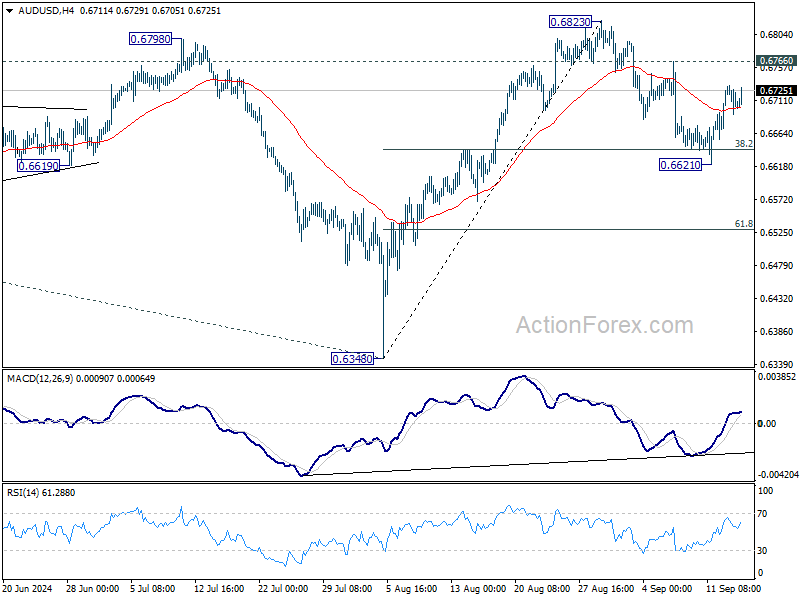
In the bigger picture, overall, price actions from 0.6169 (2022 low) are seen as a medium term corrective pattern, with rise from 0.6269 as the third leg. Firm break of 0.6798/6870 resistance zone will target 0.7156 resistance. In case of another fall, strong support should be seen from 0.6169/6361 to bring rebound.