Sample Category Title
ECB’s Kazaks: Rate cuts not over, could fall to 2.5% by mid-2025
ECB Governing Council member Martins Kazaks indicated that after two rate cuts this year, "this is not the final destination." Borrowing costs remain “pretty restrictive”, and “these rates will continue to go down," he added.
Kazaks noted that the speed of these rate cuts will largely depend on the path of services inflation and the broader outlook for Europe's struggling economy.
“If we look at what financial markets expect — and I don’t have any serious reason not to agree with them — then by the middle of next year, rates are expected at 2.5%,” he added.
USD ahead of the Fed decision: EURUSD and GBPUSD Technical Outlook
Fundamental Analysis
This week, September 16-20, 2024, is key for the USD, with the Federal Reserve meeting in the spotlight, taking place between Tuesday, September 17, and Wednesday, September 18. Currently, according to the CME's FedWatch tool, the probability of a 25-basis-point cut is 41%, while the chance of a more aggressive 50-basis-point cut stands at 59%, reflecting clear market expectations for a dovish move by the Fed. This follows mixed labour and inflation data from August, maintaining a moderate stance on how fast the Fed should ease.
Regarding market impact, futures of the major U.S. stock indices are trading at new all-time highs, with the S&P 500 climbing above 5600 points, trading around 5633.17 today. This reflects expectations of a dovish Fed pivot. A 25-basis-point cut would likely trigger more index buying, albeit with less intensity than a 50-point cut, which could ignite a significant short-term rally. The Nasdaq may also benefit notably, given its bias towards interest-rate-sensitive tech stocks.
For the USD, a 50-point cut would generate stronger bearish pressure, especially against pairs like EURUSD, currently trading at 1.1125, which we will analyze further below. GBPUSD may remain strong this week as the Bank of England is unlikely to ease its benchmark rate at its upcoming meeting on Thursday, September 19.
Technical Analysis
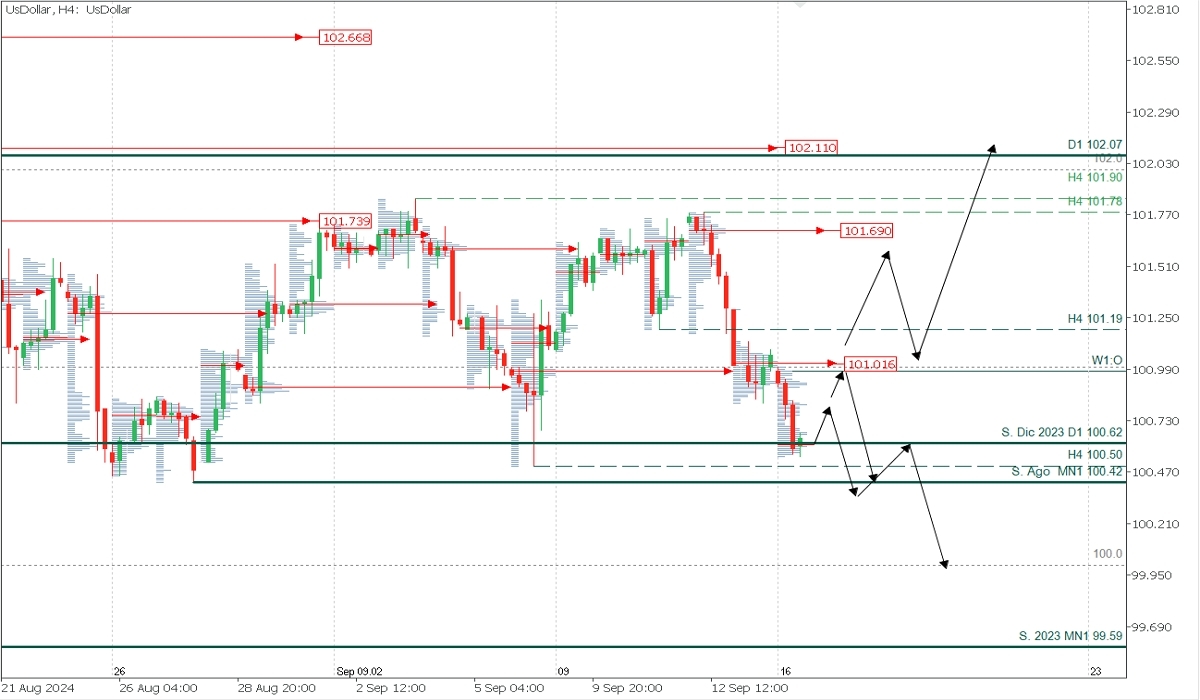
US Dollar Index (DXY)
- Supply Zones (Sell): 101.016 and 101.69
- Demand Zones (Buy): 100.62 and 100.00
The USD is trading at August lows and within the consolidation range of the last two weeks. Monday’s bearish opening left a first concentration of volume around 100.62, a potential demand zone expected to trigger buying toward the nearest supply zone around 101.01. Bearish defences in this area may renew the downward bias, targeting a break of the August support at 100.42, continuing the sell-off towards the round number 100.00, or extending to the 2023 support at 99.59. However, a decisive breakout above the first supply zone around 101.01 could activate a broader correction toward 101.19 or last week’s supply zone between 101.50 and 101.70, where sellers would likely defend the 101.00 level.
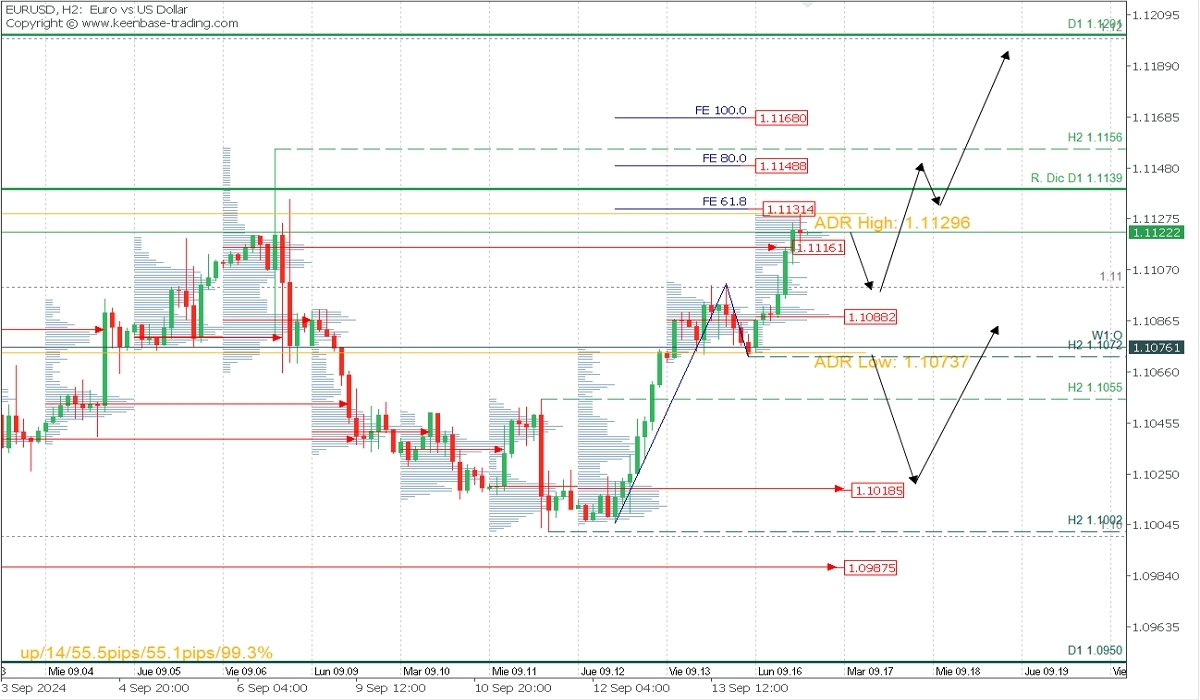
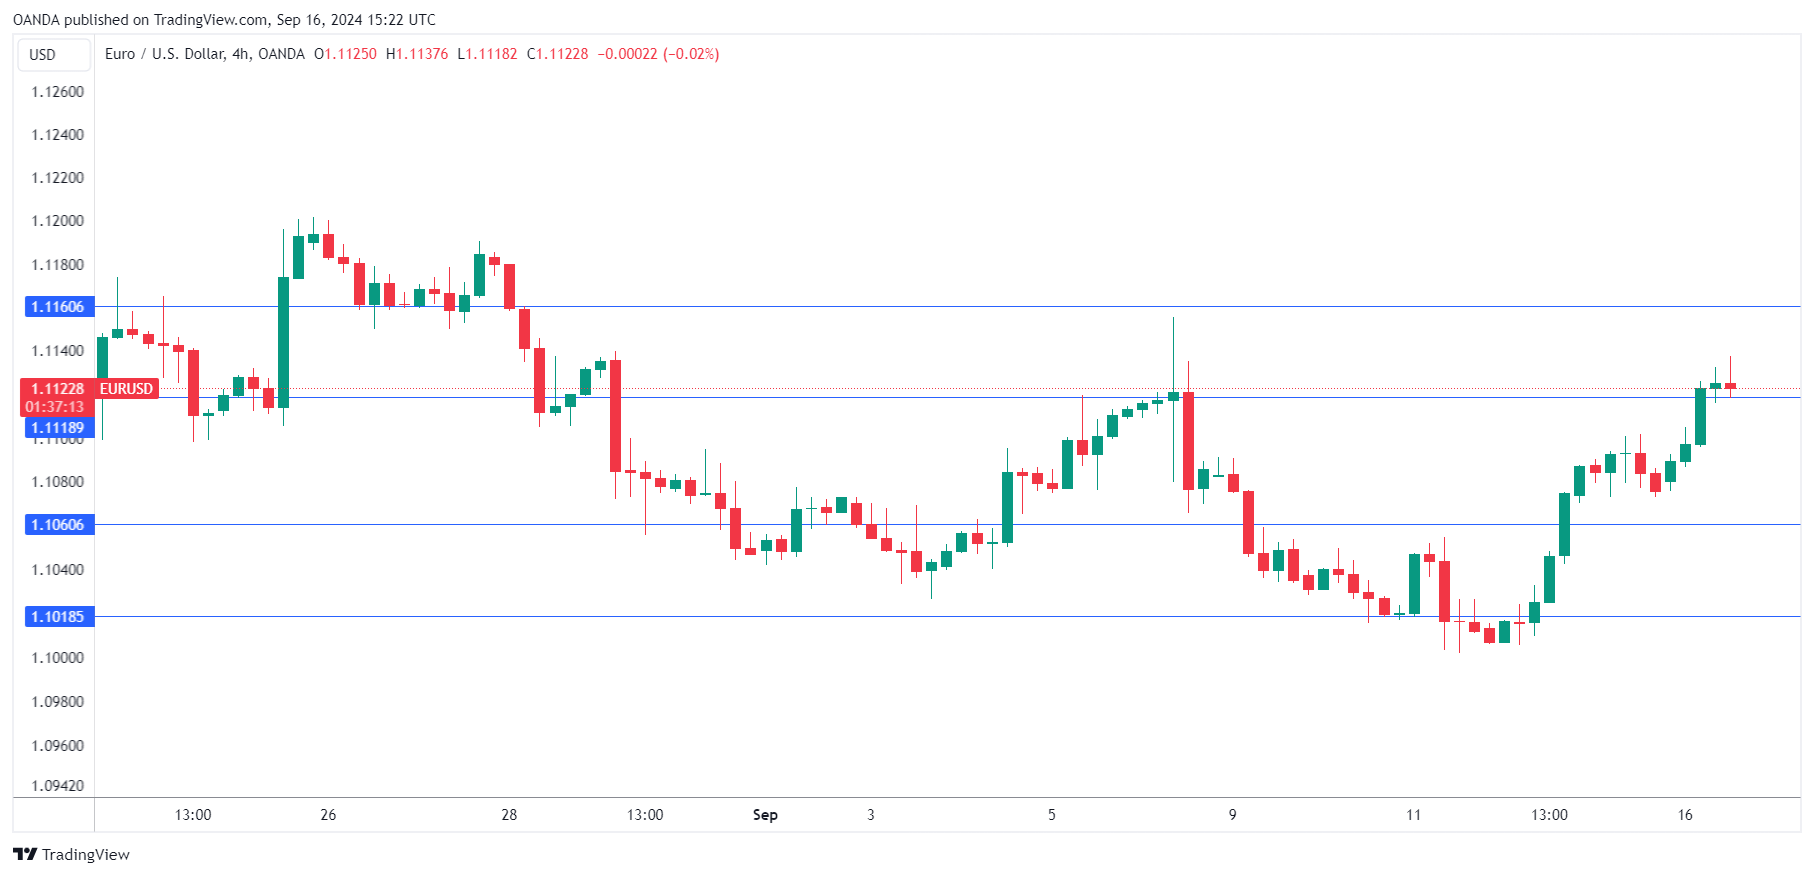
EURUSD
- Supply Zones (Sell): 1.1150, 1.1166, and 1.1185
- Demand Zones (Buy): 1.1088 and 1.1018
The bullish opening reached and surpassed the supply zone around 1.1116, stopping at the current average bullish range at 1.1129. A pullback is expected toward 1.11 or the POC of the first sessions at 1.1088, from where a new rebound is anticipated, as bulls defend this level with potential targets in the next supply zones at 1.1150 and 1.1166, close to the 80% and 100% Fibonacci extensions, which, once reached, validate 1.1072 as the last relevant support. Currently, the last validated support of the ongoing bullish movement is at 1.1002.
Technical Summary:
- Bearish corrective scenario: Sell below 1.111 with TP at 1.11 and 1.1090 on extension.
- Bullish continuation after pullback: Buy above 1.1088 with TP at 1.1150, 1.1168, or 1.12 on extension for the week.
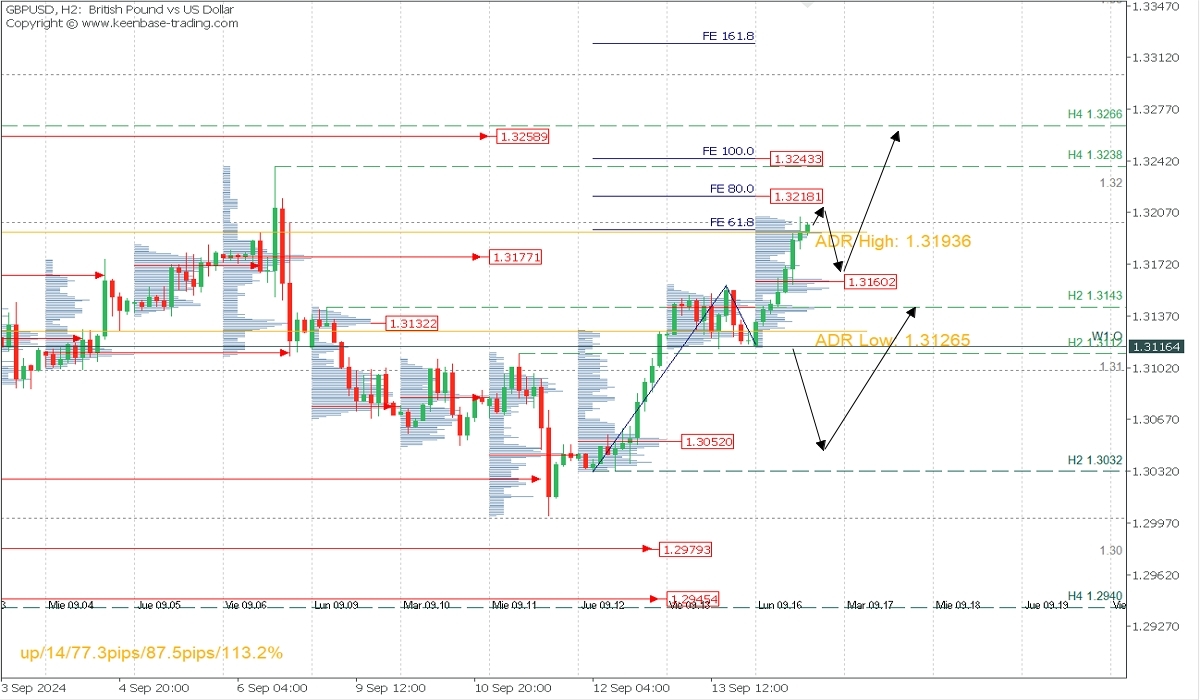
GBPUSD
- Supply Zones (Sell): 1.32, 1.3259
- Demand Zones (Buy): 1.3160 and 1.3052
The bullish opening reflects greater strength from the bulls after decisively breaking through the supply zone around 1.3177. A pullback below 1.3218 is expected with intraday targets at 1.3160, the last demand zone from the first sessions of the day. Weekly bullish continuation could extend to the next demand zones at 1.3258 and round number 1.33. This scenario validates 1.3116 as the last relevant support in the new intraday bullish trend.
Technical Summary:
- Bearish corrective scenario: Sell below 1.3218 with a target of 1.3160.
- Bullish continuation scenario: Buy above 1.3160 with targets at 1.3260 and 1.33 on extension.
*POC definition: POC = Point of Control: The level or zone where the highest volume concentration occurred. If this level was followed by a bearish movement, it is considered a sell zone and forms resistance. Conversely, if it followed a bullish impulse, it is considered a buy zone, usually located near lows, forming support areas.*
News of the Week (September 16— September 20): GBPUSD in Focus
GBPUSD poised for a breakout—traders should stay alert!
The GBPUSD pair, commonly known as “cable” among traders, reflects the exchange rate between the British pound and the US dollar. Economic conditions heavily influence the pair in both the UK and the US. The Pound usually depends on UK interest rate decisions, inflation data, and overall economic growth, with rising inflation often causing a rise in interest rates, which supports the Pound. The US Dollar, on the other hand, is influenced by Federal Reserve policy, inflationary trends, and US economic indicators such as employment and GDP growth. It is one of the important pairs in the Forex market, which is particularly interesting for trading!
Fed Interest Rate Decision, Sep 18, 20:00 (GMT+2)
The Federal Reserve is expected to cut interest rates from 5.50% to 5.25%. If this forecast is confirmed, it would signal a more accommodating monetary policy, likely weakening the US dollar, which could lead to a rise in the GBPUSD pair. However, if the rate cut is larger than expected or more dovish language accompanies the decision, the Dollar could weaken further, potentially pushing GBPUSD even higher. Conversely, if the Fed keeps rates unchanged, the US Dollar may strengthen as investors shift to higher-yielding US assets, causing GBPUSD to drop.
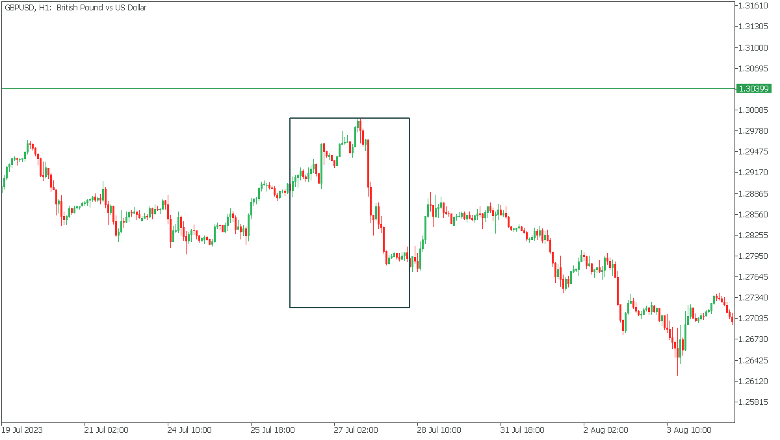
The US Fed last changed rates on July 26, 2023, from 5.25% to 5.50%. This initially led to an increase but a strong drop the next day.
US Federal Open Market Committee (FOMC) Statement, Sep 18, 20:00 (GMT+2)
The FOMC statement, released alongside the interest rate decision, will provide crucial guidance on future US monetary policy. If the statement confirms expectations of continued dovishness, with suggestions of more rate cuts or a cautious economic outlook, this would likely weaken the US Dollar further, leading to a potential rise in the GBPUSD pair. On the flip side, if the FOMC statement surprises with a more hawkish tone, stressing concerns about inflation or signaling fewer cuts in the future, the Dollar could strengthen, potentially causing a fall in GBPUSD.
UK Interest Rate Decision, Sep 19, 13:00 (GMT+2)
The Bank of England is expected to keep the interest rate at 5.00%. If this forecast is confirmed, the market reaction may be restrained, and GBPUSD may rise slightly. It is extremely unlikely that the Bank of England will raise rates in the near future, as inflation is steadily declining.
However, if the Bank of England cuts rates or adopts a dovish tone, the attractiveness of the pound will be greatly reduced, leading to a fall in GBPUSD.
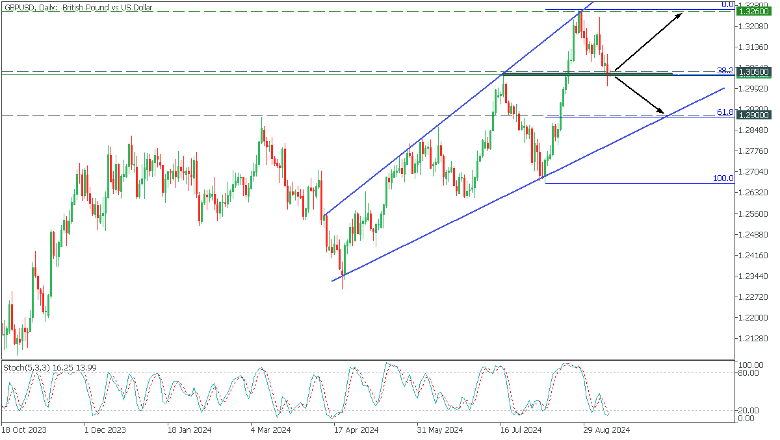
In the Daily timeframe, GBPUSD, in a long-term bullish trend, has formed an expanding wedge pattern. The price bounced from the upper boundary and is consolidating near the 38.2 Fibonacci support. At the same time, the Stochastic indicates oversold.
- If the price falls below the support at 1.3050, the fall will be to the lower trendline at 1.2900, corresponding to 61.8 Fibonacci;
- A rebound from support will bring GBPUSD back to resistance at 1.3260;
EURJPY Wave Analysis
- EURJPY reversed from support zone
- Likely to rise to the resistance level 157.40
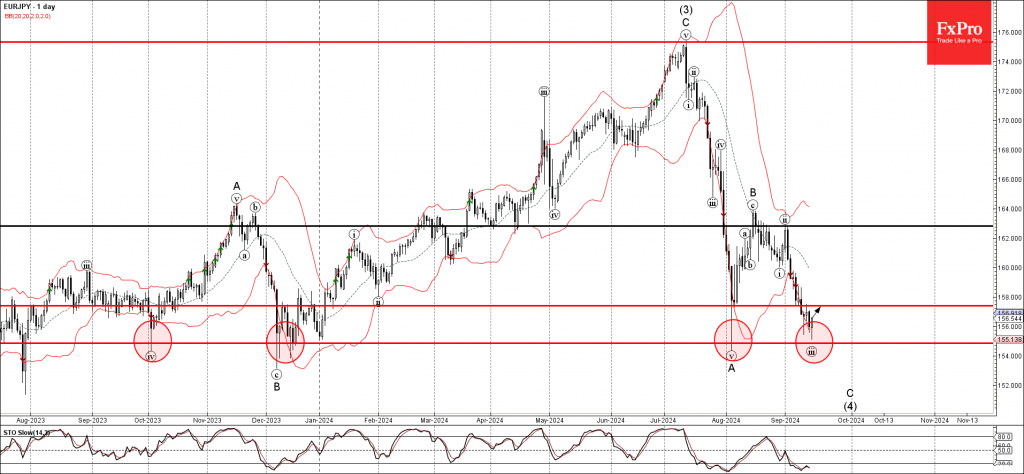
EURJPY currency pair recently reversed up from the powerful support zone located between the long-term support level 154.85 (which has been reversing the price from last year) and the lower daily Bollinger Band.
The upward reversal from this support zone is likely to form the daily Japanese candlesticks reversal pattern Piercing Line.
Given the strength of the nearby support zone and the still oversold daily Stochastic, EURJPY currency pair can be expected to rise further to the next resistance level 157.40.
GBPUSD Wave Analysis
- GBPUSD reversed from support zone
- Likely to rise to the resistance level 1.3255
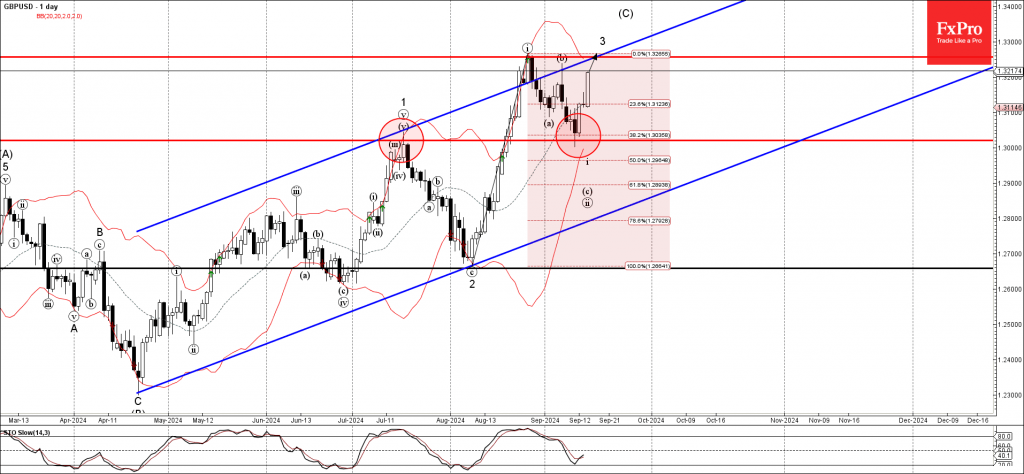
GBPUSD currency pair continues to rise strongly after the earlier upward reversal from the support zone set between the support level 1.3020 (former resistance from July) and the 38.2% Fibonacci correction of the upward impulse from August.
The upward reversal from this support zone created the daily Japanese candlesticks reversal pattern Bullish Engulfing.
Given the strong daily uptrend and the bearish US dollar sentiment, GBPUSD currency pair can be expected to rise further to the next resistance level 1.3255 (former monthly high from August).
Euro Jumps to 10-Day High
The euro has posted strong gains on Monday. EUR/USD is trading at 1.1126 in the North American session at the time of writing, up 0.49% today. The euro is at its highest level since Sept. 6.
It’s a quiet day on the data calendar, with no tier-1 events. In the US, the Empire State Manufacturing index rebounded to 11.5 in September, much higher than the August reading of -4.7 and the market estimate of -3.9. This was a shocker as the manufacturer index had contracted nine straight times before today’s reading.
Tuesday will be busier, with German ZEW economic sentiment index and US retail sales. German ZEW economic sentiment plunged to 19.2 in August, down from 41.8 in July. The market estimate for September stands at 17.1. US retail sales are expected to fall to 2.2% y/y in August, down from 2.7% in July.
Fed faces a tough choice – 25 or 50?
This week’s key event is the Federal Reserve meeting on Wednesday, with a 25 basis-point cut practically guaranteed. Will the Fed opt for an oversize 50-bps cut or play it safe with a 25-bps move? The rate cut odds continue to swing wildly. After last week’s producer price index reading, the odds of a 50-bps point cut soared to 41%, up from just 13% before the release, according to the CME’s FedWatch tool. That has increased to 59% today.
The uncertainty over what the Fed will do could last right up to the wire. The Fed is in a quandary as it needs to balance the risk of inflation moving higher against the recent weakness in the labor market. A modest 25-bps cut may not be sufficient to improve the employment picture, while a 50 bps cut might send a message that the Fed believes the economy is in deep trouble.
EUR/USD Technical
- EUR/USD is testing resistance at 1.118. Above, there is resistance at 1.1160
- There is support at 1.1060 and 1.1018
Soft-Landing, or No Soft-Landing, That Is the Question: Part IV
Part IV: A New Framework to Predict Probability of Monetary Policy Pivots
Summary
- The fourth installment of this series develops a new framework to quantify episodes of monetary policy pivots.
- We also present a probit regression to predict the probability of a policy pivot during the next two quarters.
- In our view, accurately predicting periods of monetary policy pivots is vital, as a rate cut that comes too late or too soon would be harmful to the economy and damage the FOMC’s reputation.
- Our framework estimated that there are 26 episodes of policy pivots in the post-1990 period.
- Using a threshold of 35%, the probit framework accurately predicted episodes of policy pivots in the post-1990 era.
- The latest probability (Q2-2024) of 43% indicates that a rate cut cycle may start soon (within the next two quarters).
- Given the historical accuracy of our framework, we believe the toolkit would provide useful insights for decision makers, as it can be updated in real time to gauge the likely duration of the upcoming easing cycle.
- We believe accurately predicting the near-term path of the fed funds rate is vital for effective policymaking as well as policy communication. The next installment of the series will present a new approach to predict the fed funds rate two quarters out (up to four FOMC meetings ahead).
Why Is Accurately Predicting Monetary Policy Pivots Important?
Part three of the series presented four-quarters-out probabilities of the three growth scenarios of soft-landing, stagflation and recession. This installment develops a framework to employ those probabilities to predict monetary policy decisions. We follow two different paths to gauge the usefulness of our toolkit. The first method predicts monetary policy pivots, and the second approach forecasts the near-term level of the fed funds rate (a topic we’ll cover in the next installment).
We believe accurately predicting the timing of a policy pivot compliments the generation of the future potential path of the fed funds rate. By predicting the timing of a policy pivot, decision makers could anticipate the potential duration of the current stance, at least in theory. The prediction for the fed funds rate would shed light on how many rate cuts (a relevant discussion for the current cycle) are appropriate in the near future.
In our view, accurately predicting periods of monetary policy pivots is vital, as a rate cut that comes too late or too soon (a widely discussed topic in the present cycle) would be harmful to the economy and damage the FOMC’s reputation. Members of the FOMC have repeatedly acknowledged that their goal is to avoid a mistimed rate cut, whether it be too soon or too late. Some analysts suggested the March 2022 rate hike was too late, as the FOMC misjudged higher inflation as "transitory" and waited too long to act. By the same token, significant changes in the FOMC’s SEP (June 2023 vs. June 2024) made some analysts worry that the next policy pivot (which is expected to be a rate cut) may be mistimed as well.
A New Framework To Quantify Episodes of Monetary Policy Pivots
We develop a new framework to quantify episodes of monetary policy pivots and present a probit regression to predict the probability of a policy pivot during the next two quarters. At present, the FOMC regularly meets eight times a year, with four meetings in the first half and four in the second half. Thereby, we set a two-quarters-out forecast horizon to predict the chances of a policy pivot during the next four meetings. Given the volatile nature of the economy during the post-pandemic era, a one-year-out prediction for a policy pivot would suffer lower accuracy, as the rapidly changing nature of potential risks would dictate a faster response from the FOMC, all else equal.
We define a policy pivot as a change in the FOMC’s rate decision compared to the past few meetings. There are two key elements in our definition of a policy pivot. The first is that the FOMC has a different rate decision than the past few meetings. The second condition is that the FOMC keep the stance for the next few meetings, at least. There are three rate decisions that have been utilized by the FOMC, at least in the post-1990 era. The FOMC either (a) raises the target of the fed funds rate, (b) keeps the rate unchanged or (c) reduces the rate (Figure 1).
Historically, once the FOMC adopts a policy stance (a rate hiking stance, for example), it keeps that stance for at least several meetings. In the post-1990 era, the shortest duration of a policy stance was about six months, which occurred in 1995. The FOMC raised the fed funds rate to 6.00% from 5.50% in February 1995, and then kept that rate (a rate pause) until its June meeting. The FOMC reduced the rate by 25 bps in July 1995.
We use these conditions to identify periods of policy pivots. The last policy pivot date was in August 2023, as that was the first month after the fed funds rate peaked at 5.50% in July 2023. After 13 consecutive months, the fed funds rate is still at 5.50%. Essentially, August 2023 marks the end of the rate hike stance that started in March 2022. If the FOMC cuts rates in September 2024, then that would be the next policy pivot, as it would be the start of a rate-cut cycle (a policy normalization stance). Of course, this is assuming the FOMC will adopt a rate-cut stance for the near future.
Episodes of the Monetary Policy Pivot in the Post-1990 Era
Our framework estimated that there are 26 episodes of policy pivots in the post-1990 period (for detail see Table 1). We concentrated on the post-1990 era, where the FOMC’s communications about policy decisions are more transparent and shared with the public in a timely matter. One example of the FOMC’s communications can be seen in the fed funds rate series, as the post-1990 data are smoother, and policy stances (from rate cuts to policy pauses, for example) can be identified with a reasonable confidence. (Figure 1)
By our definition, there are four types of policy pivots: (1) pause-to-cut, which is the start of a rate-cut stance, (2) cut-to-pause, which is the end of a rate-cut stance, (3) pause-to-hike, which is the start of a rate-hike stance and (4) hike-to-pause, which is the end of a rate-hike stance. There are eight episodes of pause-to-cut, six of cut-to-pause, seven of pause-to-hike and five of hike-to-pause. Most policy pivots in the post-1990 era included a pause stance (11 pivots are either cut-to-pause or hike-to-pause), while eight took an easing/rate-cut stance and seven took a tightening/rate-hike stance. Our forecast horizon is only two quarters out, therefore the type of policy pivot would be known to a forecaster. Thus, we only concentrate on predicting the timing of a policy pivot.
A Probit Approach To Predict the Probability of Monetary Policy Pivots
The major benefit of identifying periods of policy pivots is that we can build a regression to generate the probability of a policy pivot in the near future. For example, we identifed 26 episodes of policy pivots in the 1990-2024:Q2 period, and then we created a dummy variable where a value of one represents a pivot occurring and zero is otherwise. Using the dummy variable, a probit regression is developed to predict the two-quarters-out probability of a policy pivot. Part III of the series presented four-quarters-out probabilities of the three growth scenarios of soft-landing, stagflation and recession. We employ those probabilities as predictors of the probit regression.
Figure 2 shows the two-quarter-out probability of a policy pivot, and the bars represent actual periods of policy pivots (based on our framework; see Table 1 for detail about those pivots). Using the average probability of 35% as a threshold (dotted line in Figure 2), the framework accurately predicted all episodes of policy pivots in the post-1990 era.
As seen in Figure 2, the probability of a policy pivot started trending upward in Q2-2021 and breached the threshold in Q3-2021. The framework suggested starting a rate hike cycle sooner than Q1-2022, with a possibility of a rate hike in 2021. Neither the FOMC nor the Blue Chip consensus provide an explicit probability of a policy pivot, but the FOMC’s SEP and the Blue Chip consensus did not predict a rate hike in 2021 (i.e., no policy pivot in 2021). However, both forecasts did predict rate hikes in 2022. In retrospect, our framework would have helped decision makers determine appropriate timing for the rate-hike cycle back in 2021-2022.
The policy pivot probability jumped in Q2-2023 (from 34% to 42%), and then peaked in Q3-2023, which is consistent with the most recent policy pivot of Q3-2023—a hike-to-pause pivot. Q4-2023 and Q1-2024 noted a declining trend (but still above the threshold line) which may have cautioned analysts that a policy pivot to rate cuts were potentially further away. The latest probability (Q2-2024) of 43% indicates that a rate cut cycle may start soon (within the next two quarters), which is consistent with financial markets participants’ expectations for the upcoming September FOMC meeting. Given the historical accuracy of our framework, we believe the toolkit would provide useful insights for decision makers, as it can be updated in real time to gauge the likely duration of the upcoming easing cycle.
A Policy Pivot Is Most Likely, but What About the Pace/Duration of the Easing Cycle?
In summary, the latest probability (Q2-2024) of 43% indicates that a rate cut cycle may start soon (within the next two quarters), which is consistent with both the FOMC and Blue Chip forecasts, as they are also predicting a policy pivot in 2024.
FOMC members provide their near-term (as well as long-run) fed funds rate forecast. The June 2024 SEP suggests one 25 bps rate cut in 2024 and four more cuts throughout 2025. The FOMC employs its fed funds forecast (along with their other forecasts) to signal its near-term policy stance. In the short run, significant changes in the forecast would send undesirable signals and raise questions about the accuracy of the fed funds forecast. Therefore, in our view, accurately predicting the near-term path of the fed funds rate is vital for effective policymaking as well as policy communication. The next installment of the series will present a new approach to predict the fed funds rate two-quarters-out (up to four FOMC meetings ahead).
Table 1
Source: Federal Reserve Board and Wells Fargo Economics
Could BoE Surprise With a Rate Cut on Thursday?
- BoE meeting concludes on Thursday, the day after the Fed
- Economists assign an almost zero chance of a rate cut
- Wednesday’s CPI and the Fed rate cut could lead to a surprise BoE move
- Pound to benefit from an uneventful meeting
BoE will announce its rate decision on Thursday
The Bank of England is joining the chorus of the central bank meetings on Thursday. While the market will be digesting the first Fed rate cut since March 2020, Governor Bailey et al will announce their rate decision, after a meeting that does not feature the publication of quarterly projections and a press conference.
UK data flow is not conducive to another rate cut…
Since the August 1 BoE rate cut, the data flow has been rather positive and has resulted in a significant decrease in the September rate cut expectations. Specifically, PMI surveys continue to point to underlying strength in the economy while the industrial sector continues to recover. Similarly, the labour market remains relatively tight as observed by the satisfactory growth in average earnings. Consumer spending remains under the weather even though housing prices have comfortably returned to experiencing positive yearly changes.
… but August CPI and a more aggressive Fed rate cut could prove decisive
Therefore, economists are overwhelmingly expecting an uneventful gathering. That could potentially change though if:
(1) the Fed actually opts for a more aggressive start to its monetary policy easing cycle than originally anticipated. The market is currently pricing in 63% probability of a 50bps Fed rate cut on Wednesday following last week’s weaker producer and import prices indices, and a WSJ report that a 50bps move is being considered. And,
(2) Wednesday’s August CPI report shows aggressively weakening inflation pressures. The market is looking for an unchanged 2.2% annual growth in headline CPI figure, but the core indicator, which excluded energy and food prices, could accelerate to 3.5%. A significant downside surprise, partly on the back of lower oil prices in August, could put pressure on the BoE to act sooner rather than later. The market is acknowledging that there is a reasonable chance of a rate cut surprise since it is currently pricing a 37% probability for a 25bps move.
Uneventful meeting expected but voting pattern matters
Barring a major surprise, expectations for an unexciting meeting will most likely be confirmed as the BoE’s chief economist is expected to propose rates to be kept stable. The focus will then turn to the November meeting that includes the critical quarterly projections and the usual press conference.
A total of 50bps rate cut is currently priced in with the BoE seen announcing 25bps cuts in both November and December, thus adopting a slower pace compared to the Fed’s 120bps of easing currently anticipated.
The market will also be interested in Thursday's voting pattern. The August decision was reached by the slimmest possible majority, and it would be important to see if the two members, Dhingra and Ramsden, that voted for a rate cut in June, continue to push for further easing.
Pound could benefit from a balanced meeting
Despite the overall negative newsflow for the eurozone and the evident divergence in the economic outlook, the pound has been failing to materially benefit against the euro. Going into the BoE meeting, market sentiment will be clearly affected by the Wednesday Fed meeting.
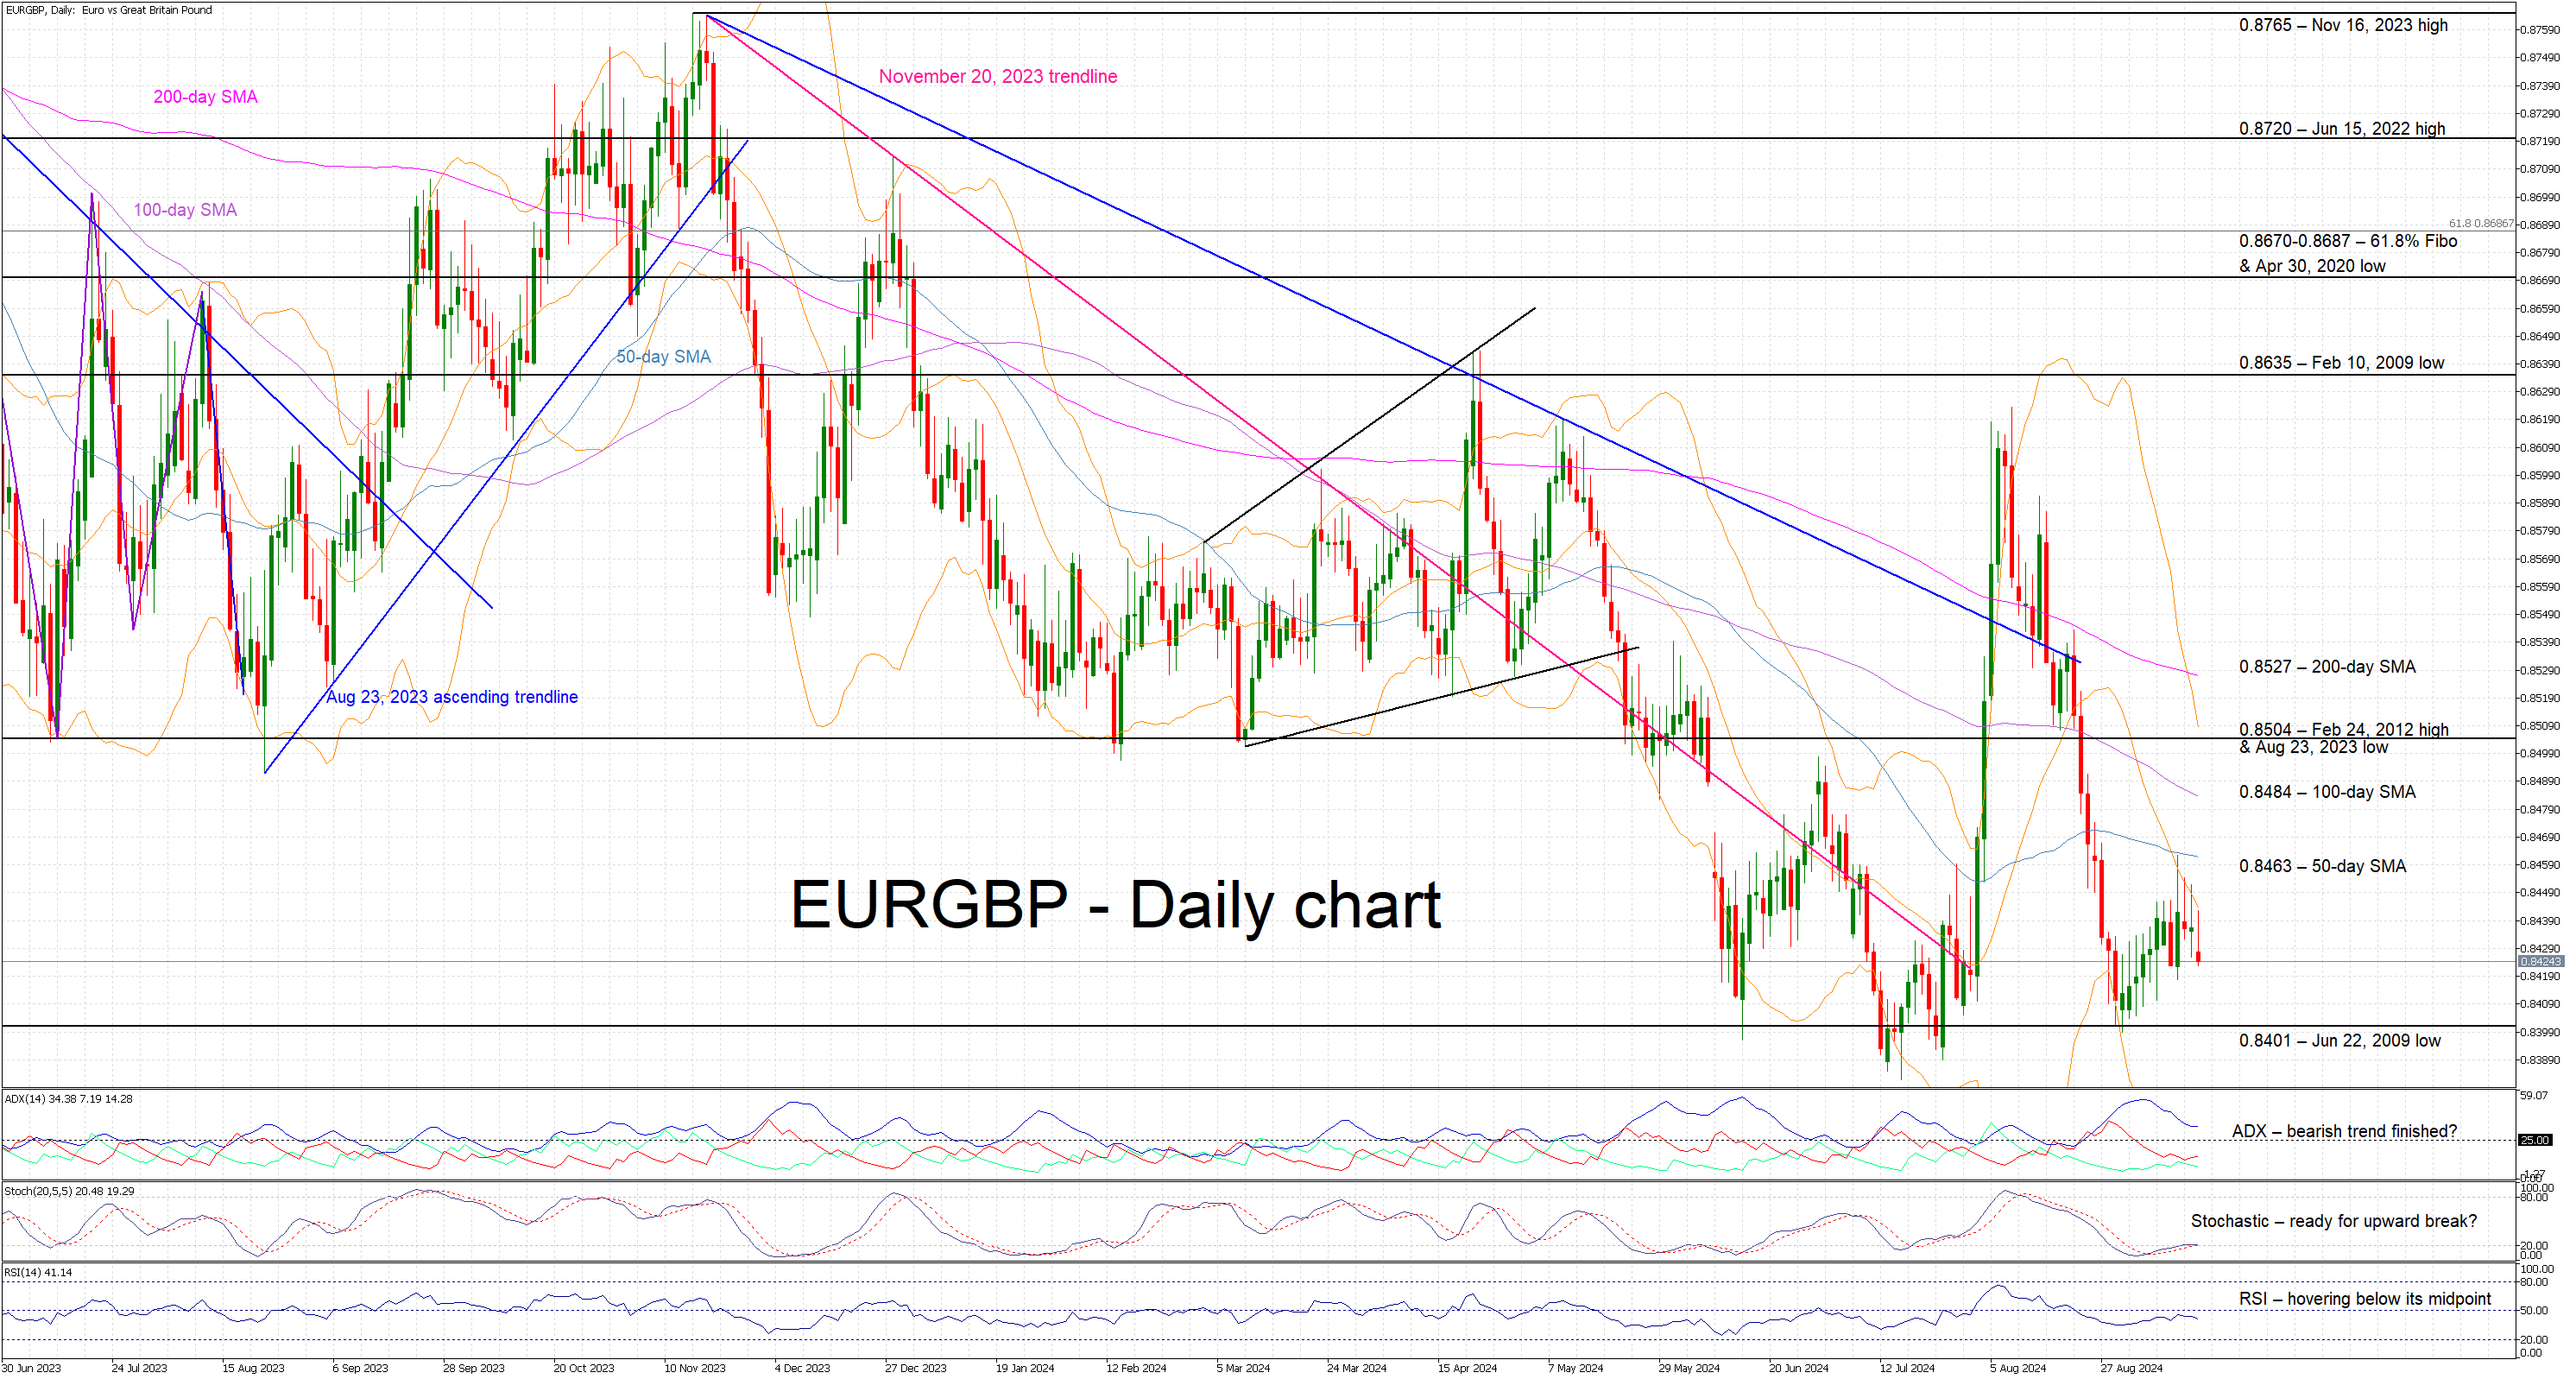
Assuming nothing groundbreaking comes from the other side of the pond, a unanimous BoE decision to keep rate unchanged and an overall balanced tone at the press statement could help euro/pound finally break below the 0.8401 and make a move towards the 0.8339 level.
On the flip side, a 50bps rate cut by the Fed could force the BoE to turn more dovish than widely expected, potentially leading to a small number of doves voting in favour of a BoE rate cut. In this case, euro/pound bulls will probably have the chance to target the 0.8487 level and recoup part of their summer losses.
Bank of England Preview – Proceeding With Caution
- We expect the Bank of England (BoE) to keep the Bank Rate unchanged at 5.00% on 19 September in line with consensus and market pricing.
- Overall, we expect the BoE to stick to a cautious language and deliver a dovish twist to its communication.
- We expect the reaction in EUR/GBP to be rather muted with risks tilted to the topside.
We expect the Bank of England (BoE) to keep the Bank Rate unchanged at 5.00% on 19 September in line with consensus. Markets currently price 5bp worth of cuts for the meeting. We expect the vote split to be 7-2 with the majority voting for an unchanged decision and Ramsden and Dhingra voting for a cut. Note, this meeting will not include updated projections nor a press conference.
Since the last monetary policy decision in August, data has been to the weak side of expectations across both inflation and growth while labour market data has been more of a mixed bag. Growth was slightly weaker than expected in Q2 at 0.6% q/q (BoE forecast 0.7%) and preliminary monthly GDP numbers indicate that growth will undershoot the Q3 forecast. Inflation was slightly weaker than expected in July at 2.2%y/y (BoE forecast: 2.4%) with services proving a large part of the downside surprise although mainly due to volatile components such as hotel prices. Note, that inflation for August is released the day before the meeting and will likely be instrumental for the guidance that we will receive.
Communication from the MPC has been limited since the last meeting with speeches from Bailey at Jackson Hole and the hawkish camp including Mann and Pill. Bailey struck a more cautious tone noting that "We are not yet back to target on a sustained basis", "policy setting will ned to remain restrictive for sufficiently long" and that "the course will therefore be a steady one." Until data sufficiently warrants it, we think the BoE will be on steady course pausing at the September and December meeting this year with service inflation and wage growth still elevated.
On QT, we expect the MPC to announce another GBP 100bn of quantitative tightening for the coming year starting October. Given the maturity profile, the largest part will stem from maturities (GBP 87bn) and to a much lesser extent from outright sales (GBP 13bn).
BoE call. We expect the BoE to deliver the next 25bp cut in November and for this to be the final cut this year This is less than markets expect (55bp by YE 2024). In 2025, we expect cuts at every meeting starting in February and until H2 2025 where we expect a step down to a quarterly pace. This leaves the Bank Rate at 3.25% by YE 2025 in line with market pricing.
FX. We expect the market reaction to be rather muted upon announcement, barring any notable surprise in CPI on Wednesday altering the guidance. On balance, we tilt towards a dovish twist which does suggest some slight EUR/GBP topside following the release of the statement, as has been the case the past meetings (chart 2). That said, we more generally still expect EUR/GBP to continue its recent move lower driven by UK economic outperformance, BoE lagging peers in an easing cycle for the time being and tight credit spreads. The key risk is policy action from the BoE.