Sample Category Title
EUR/CHF Daily Outlook
Daily Pivots: (S1) 0.9197; (P) 0.9208; (R1) 0.9219; More....
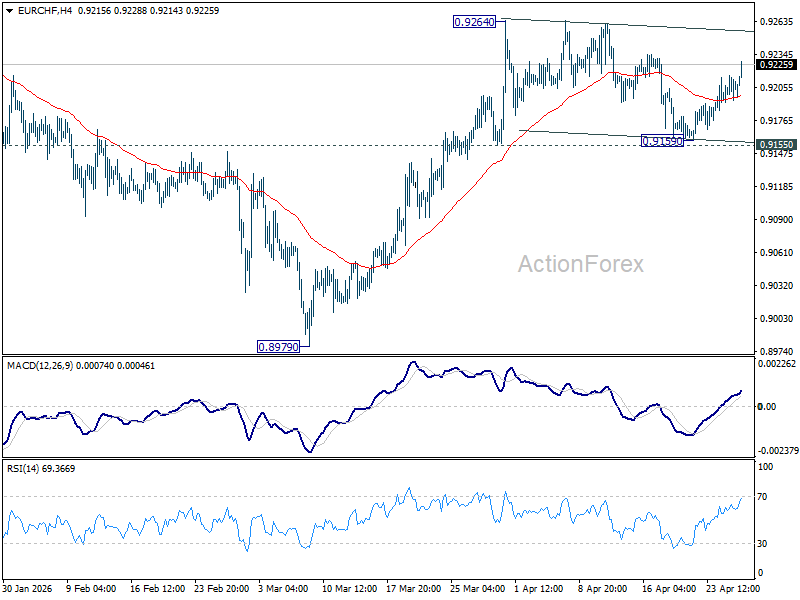
Intraday bias in EUR/CHF stays neutral first and consolidations from 0.9264 could extend. But still, further rise is expected with 0.9155 support intact. On the upside, firm break of 0.9264 will resume the rise from 0.8979 to 0.9394 resistance next. However, break of 0.9155 will turn bias back to the downside for deeper pullback.
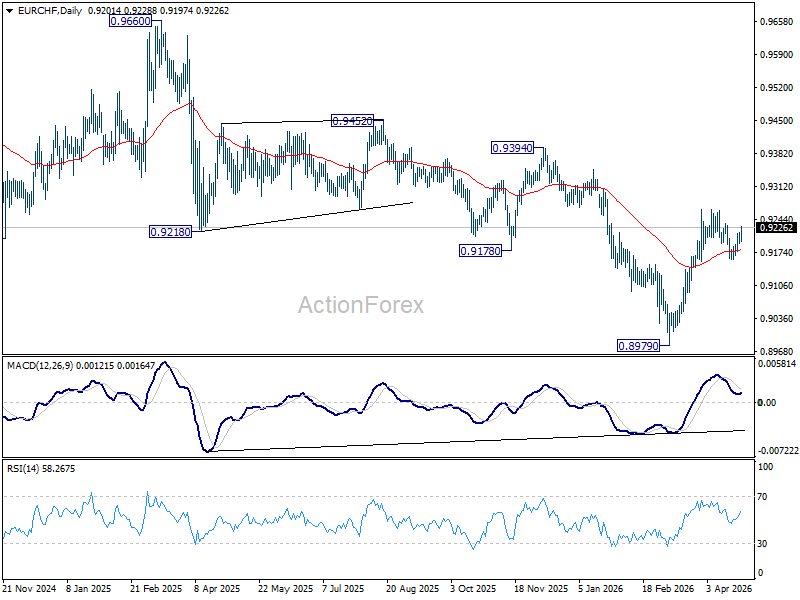
In the bigger picture, considering bullish convergence condition in W MACD, a medium term bottom should be in place at 0.8979. Sustained trading above 55 W EMA (now at 0.9277) will add more credence to this case. Further break of 0.9394 resistance will pave the way to 0.9660 resistance next. However rejection by the 55 W EMA will set up another fall through 0.8979 low at a later stage.
USD/CAD Daily Outlook
Daily Pivots: (S1) 1.3588; (P) 1.3636; (R1) 1.3674; More...
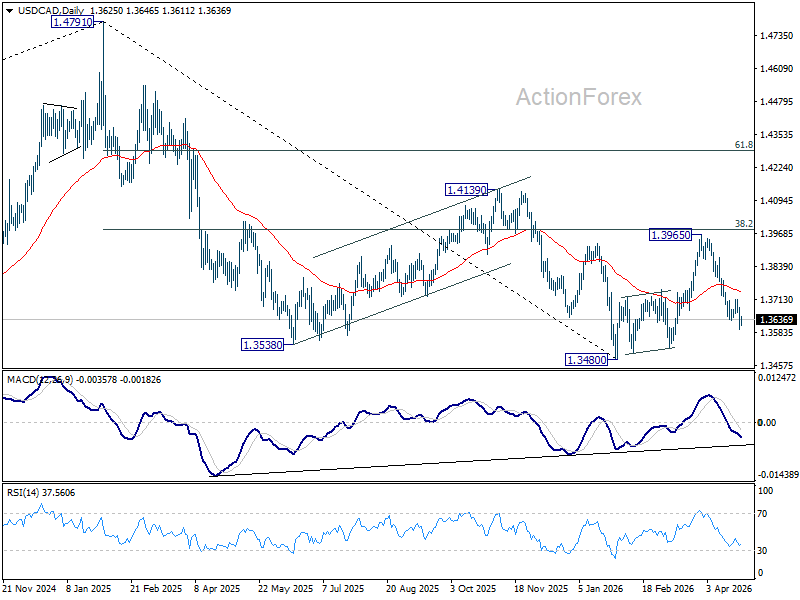
Intraday bias in USD/CAD remains on the downside for the moment. Fall from 1.3965 should target a retest of 1.3480 low. Firm break there will resume larger down trend. For now, risk will stay on the downside as long as 1.3713 resistance holds, in case of recovery
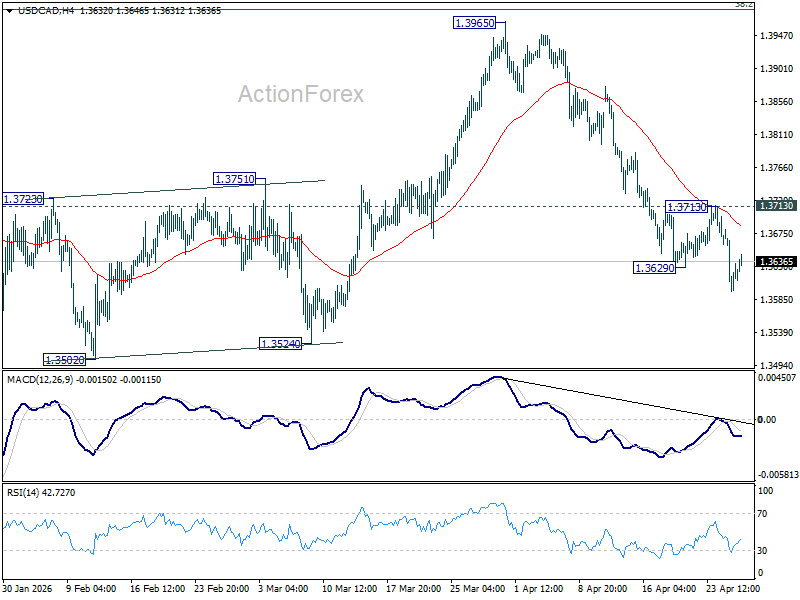
In the bigger picture, price actions from 1.4791 are seen as a corrective pattern to the whole up trend from 1.2005 (2021 low). Deeper fall could be seen, as the pattern extends, to 61.8% retracement of 1.2005 to 1.4791 at 1.3069. However, decisive break of 38.2% retracement of 1.4791 to 1.3480 at 1.3981 will argue that the correction has completed with three waves down to 1.3480 already. Further break of 1.4139 will confirm and bring retest of 1.4791 high.
AUD/USD Daily Report
Daily Pivots: (S1) 0.7145; (P) 0.7172; (R1) 0.7214; More...
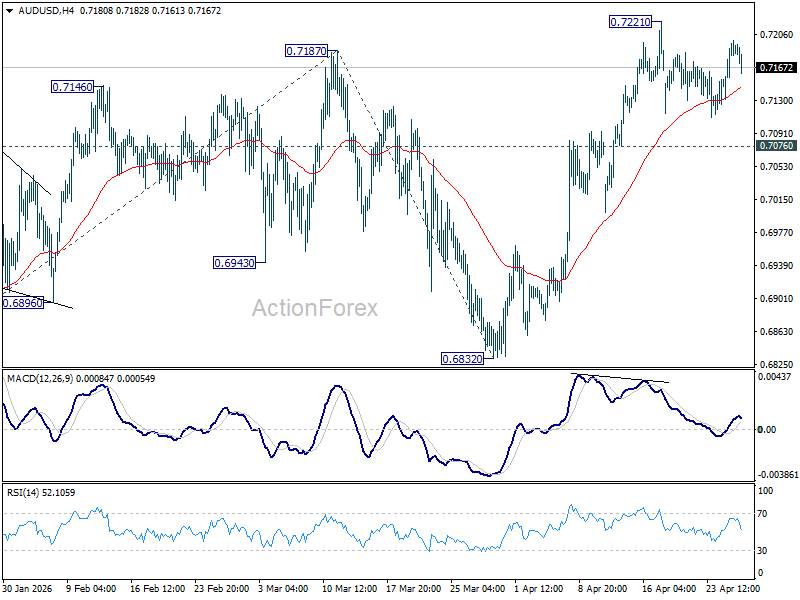
AUD/USD is extending consolidations below 0.7221 and intraday bias remains neutral. On the upside, firm break of 0.7221 will extend larger up trend to 61.8% projection of 0.6420 to 0.7187 from 0.6832 at 0.7306. On the downside, break of 0.7076 minor support will turn bias back to the downside for deeper pullback.
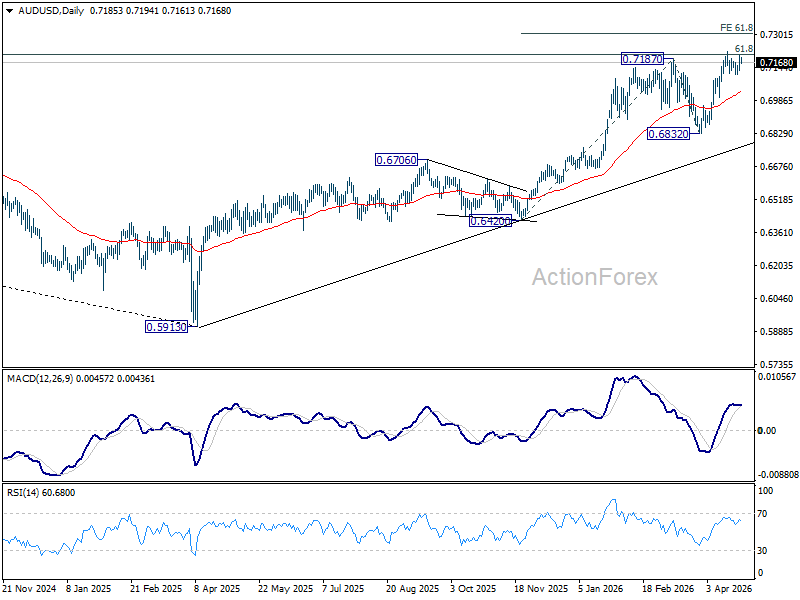
In the bigger picture, rise from 0.5913 (2024 low) is still in progress. Decisive break of 61.8% retracement of 0.8006 to 0.5913 at 0.7206 will solidify the case that it's already reversing the down trend from 0.8006 (2021 high). Further rally should then be seen to retest 0.8006. For now, outlook will remain bullish as long as 0.6832 support holds, in case of pullback.
EUR/USD Daily Outlook
Daily Pivots: (S1) 1.1691; (P) 1.1724; (R1) 1.1755; More….
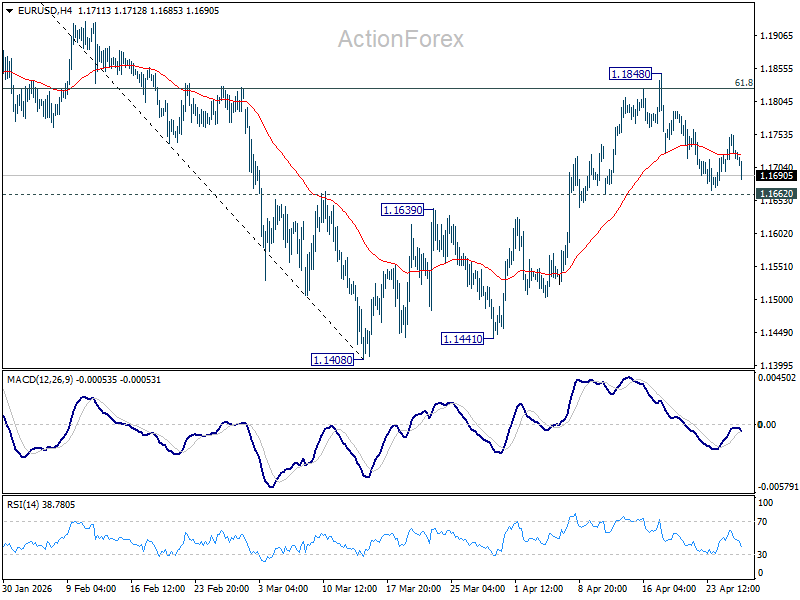
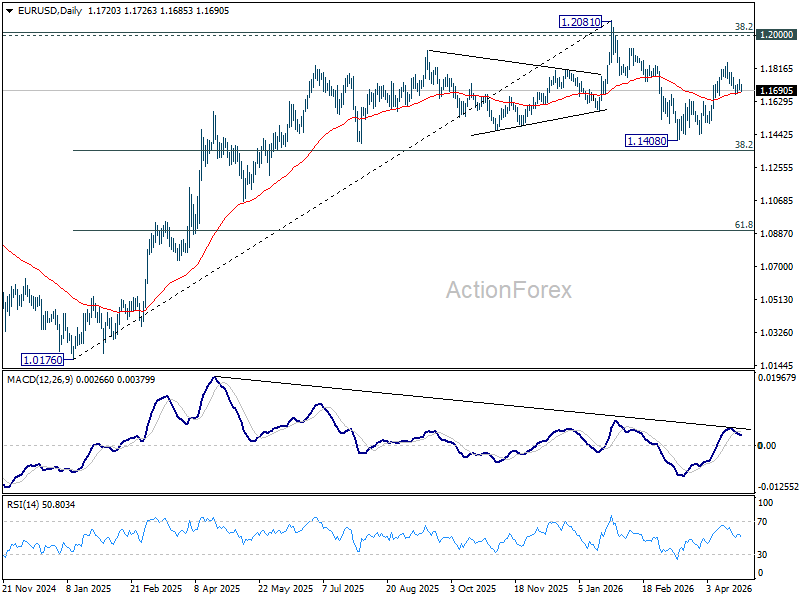
Intraday bias in EUR/USD remains neutral as consolidations continue below 1.1848. Further rally is expected with 1.1662 support intact. On the upside, sustained trading above 61.8% retracement of 1.2081 to 1.1408 at 1.1824 will pave the way to retest 1.2081 high. However, firm break of 1.1662 support will indicate the the rebound from 1.1408 has completed, and bring deeper decline back towards this low instead.
In the bigger picture, the strong support from 38.2% retracement of 1.0176 to 1.2081 at 1.1353 suggests that the pullback from 1.2081 is more likely a corrective move. Strong support was also found in 55 W EMA (now at 1.1530). Focus is back on 1.2 key cluster resistance level. Decisive break there will carry long term bullish implications. Nevertheless, break of 1.1408 support will revive the case of medium term bearish trend reversal.
GBP/USD Daily Outlook
Daily Pivots: (S1) 1.3500; (P) 1.3539; (R1) 1.3572; More...
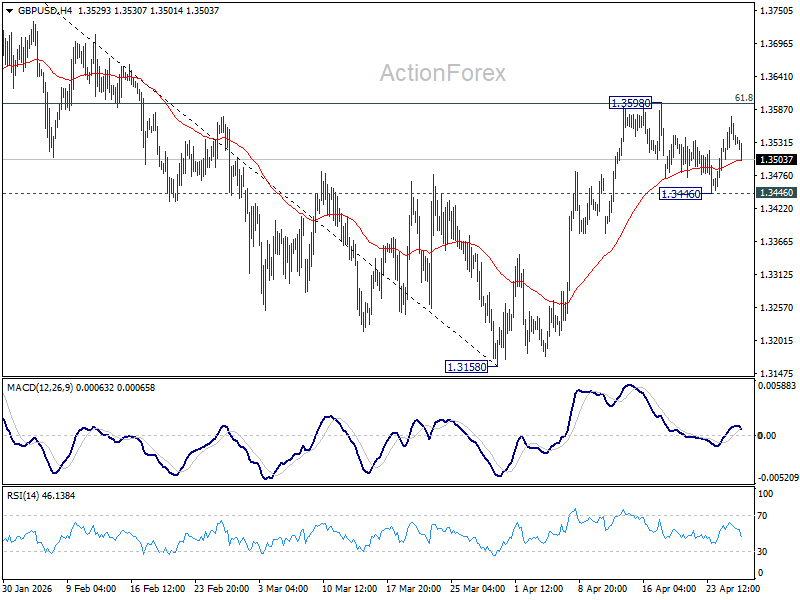
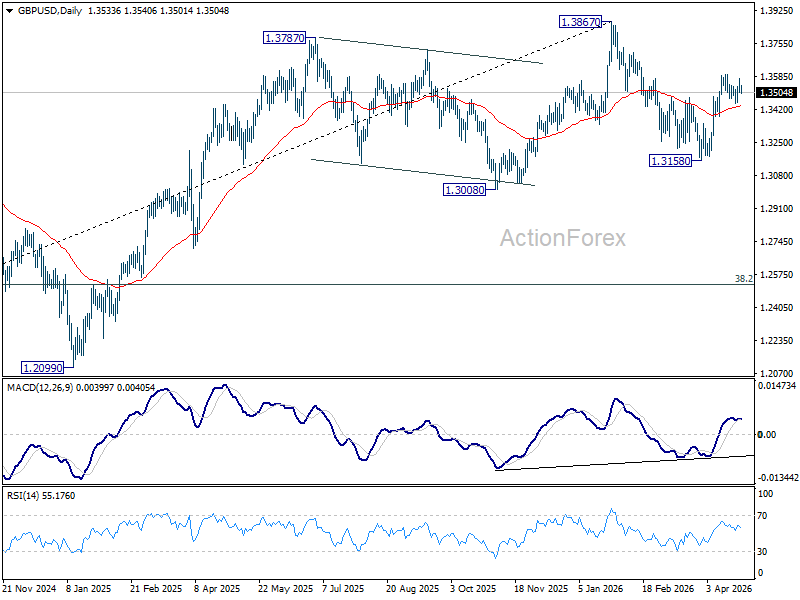
GBP/USD is extending consolidations from 1.3598 and intraday bias remains neutral. Further rise is expected as long as 1.3446 support holds. On the upside, firm break of 61.8% retracement of 1.3867 to 1.3158 at 1.3596 will pave the way to retest 1.3867 high. However, break of 1.3446 will turn bias back to the downside for deeper pullback.
In the bigger picture, current development suggests that price actions from 1.3867 are merely a corrective pattern within the broader up trend from 1.0351 (2022 low). With 1.3008 support intact, medium term bullishness is maintained and break of 1.3867 is back in favor for a later stage, towards 1.4248 key resistance (2021 high).
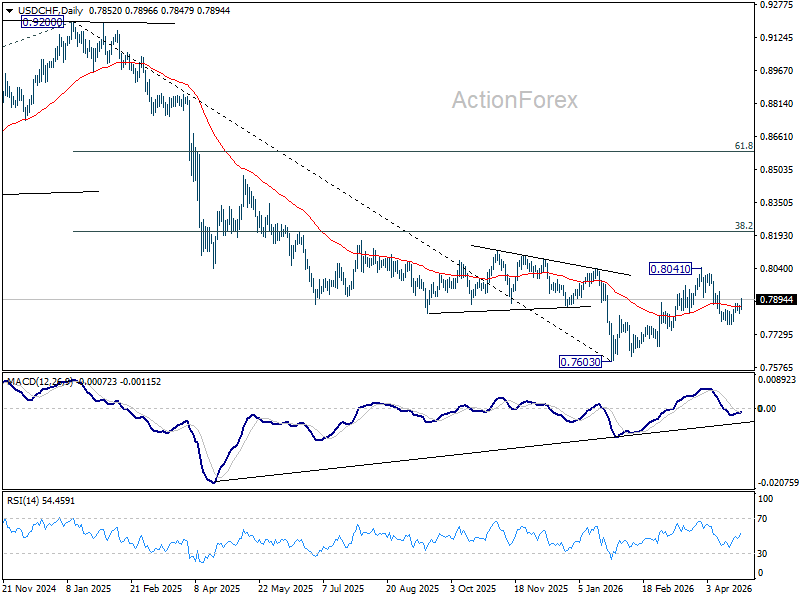
USD/CHF Daily Outlook
Daily Pivots: (S1) 0.7833; (P) 0.7853; (R1) 0.7876; More….
USD/CHF's rebound from 0.7774 accelerates higher today, but stays below 0.7933 resistance. Intraday bias remains neutral first. On the downside, below 0.7830 will turn bias to the downside for 0.7774 support. Sustained break of 61.8% retracement of 0.7603 to 0.8041 at 0.7770 will pave the way to retest 0.7603 low. However, decisive break of 0.7933 will argue that fall from 0.8041 has completed as a corrective move. Further rise should then be seen through 0.8041 to resume the whole rebound from 0.7603.
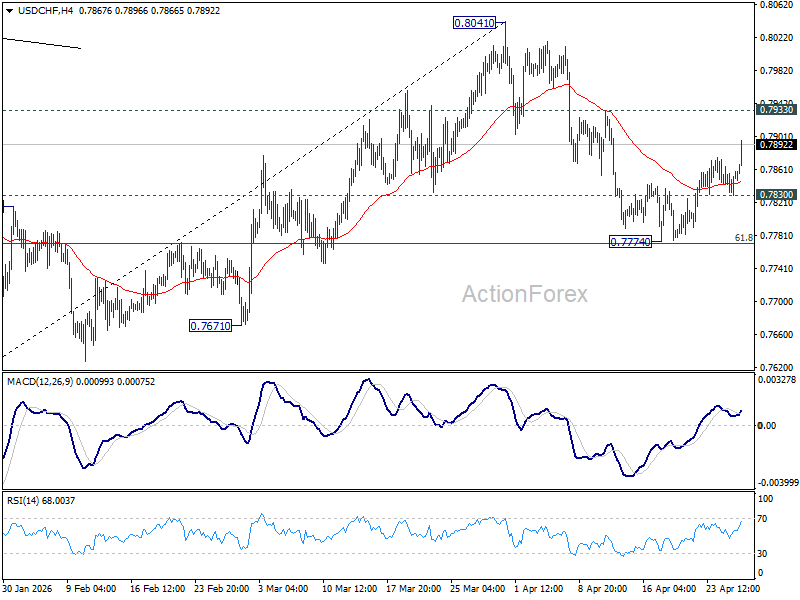
In the bigger picture, rebound from 0.7603 medium term bottom is seen as correcting the fall from 0.9200 only. Rejection by 55 W EMA (now at 0.8053) will affirm this bearish case, and setup down trend resumption to 100% projection of 1.0146 (2022 high) to 0.8332 from 0.9200 at 0.7382 at a later stage. Though, sustained break of 55 W EMA will suggest that it's probably correcting the larger scale down trend from 1.0146 (2022 high).
Hawkish Hold Sets the Stage for BoJ Action in June
Markets
This week is packed with multiple high profile market topics including policy meetings of the major central banks, earnings from multiple tech majors and a several key data series including, especially in current context, keenly waited EMU inflation data and a Q1 US growth estimate amongst others. However, these days any prepositioning to these ‘top events’ remains highly conditional and is even some kind of paralyzed by the developments regarding the US-Iran conflict. At an earlier phase in the conflict, proposals on a ceasefire and/or headlines on (potential) new negotiations mostly triggered some constructive moves in the oil, bond and equity markets. However, this market reaction function has changed to ‘first see, then believe’ attitude. In this respect, a proposal by Iran to open the Strait of Hormuz in return for the US lifting its blockade on Iran and at the same time delaying talks on Iran’s nuclear program, didn’t yield much market enthusiasm anymore, on the contrary. The stalemate in the negotiations now causes a gradual but protracted further rise in the oil price, with Brent closing at $108.25 p/b reaching the highest level in about three weeks as markets understand that any ‘normalization’ in supply from the Persian Gulf will take (a very) long time. This creates a strong floor for yields, including measures on inflation expectations. Bund yields yesterday added between 2.5 bps (2-y) and 4.1 bps (30-y). Headlines on governments (potentially) giving some additional fiscal leeway (cf. Germany infra) doesn’t help to mitigate upside pressure at the long end of the curve. US yields in a similar way added between 1.9 bps (2-y) and 3.9 bps (30-y). (US) equities didn’t go anywhere (S&P 500 +0.12%). For now, the stalemate/paralysis regarding the conflict also doesn’t help the dollar that much even as sometimes there remains a mild intraday link with oil prices. The DXY index closed the session little changed at 98.5. EUR/USD still closed north of 1.17 (20).
The BOJ this morning left its policy rate unchanged (cf infra). With no concrete progress on the US-Iran talks (US maintains ‘red lines’ on Iran nuclear program), oil extends its ascent (Brent $110 p/b), challenging CB’s (including the ECB’s) wait-and-see approach. Yields remain upwardly oriented this morning. Dollar gains, if any, for now remain limited again (EUR/USD 1.171). US eco data include weekly ADP labour market data and consumer confidence (Conference Board) with the latter providing an update on US consumers’ reaction function to higher (energy) prices. In Europe, the (March) ECB inflation expectations survey deserves more than average attention. Quite a ‘symbolic’ release as the ECB has to clarify its reaction function at Thursday’s policy meeting. The National Bank of Hungary is expected to keep its policy rate unchanged (6.25%) in its first meeting post the April elections/political landslide.
News & Views
The Bank of Japan kept the policy rate unchanged at 0.75% this morning. Internal division grew with Nakagawa, usually a consensus figure, joining Takata and Tamura in calling for a rate hike. They cited upward inflation risks while price stability is more or less achieved and financial conditions are still accommodative. A majority of six, however, saw value in waiting given the downside risks to economic growth posed by the Middle East conflict. GDP forecasts for the current fiscal year was cut in half to 0.5%. 2027 saw a minor adjustment to 0.7% and the first reading for 2028 reads 0.9%. Inflation projections on the other hand were forcefully lifted to reflect the energy price shock and its risks. The BoJ’s preferred CPI gauge (ex. food) was raised to 2.8% and 2.3% from 1.9% and 2% for 2026 and 2027. 2028 is seen at 2%. It sees price stability hit between the second half of fiscal 2026 and fiscal 2027 to remain at around that level thereafter. Today’s hawkish hold sets the stage for BoJ action in June with odds rising to 70%. The 2-yr yield rises this morning to 1.38%, coming close to the 1.4% multidecade high seen earlier this month. The yen strengthens slightly, pushing USD/JPY down to 159.12.
Germany’s finance ministry is keeping the door open to suspend the constitutional debt brake, it spokeswoman said yesterday. While rejected by Chancellor Merz and his party, the Socialist-led finance department said the government is constantly monitoring the impact of the Iran war on the economy and examining necessary measures. A suspension is currently not in the works, the spokeswoman said, but acting with foresight and vigilance is required. Germany lifted the brake back in 2020-2022 and did so again in 2025 to allow for massive defense spending. The former was temporary and based on the emergency clause (requiring a simple majority), which is also how it would potentially work anno 2026. The 2025 decision was a permanent constitutional reform (requiring a two-thirds majority).
Big Tech Priced at Perfection into Earnings
The week started on a cautious note as no major progress was made on Middle East peace negotiations. Tensions remain elevated, keeping oil prices under upward pressure. Germany’s Chancellor Friedrich Merz, angered by the prolonged tensions, said that “the US is being humiliated by Iranian leaders.” Crude near $100 per barrel is unnerving even allies, while trade tensions with the US are pushing countries to forge partnerships outside the US.
Meanwhile, this—arguably unnecessary—geopolitical and trade mess is pushing global prices higher and derailing most major central banks from their initial plans to end monetary tightening. Instead, they may be forced to consider tightening again to tackle rising inflation, even as growth prospects worsen.
In Japan, policymakers halved their FY2026 growth forecast from 1% to 0.5%, while revising inflation expectations higher. They kept rates unchanged instead of hiking. The USDJPY is lower this morning, testing the 159 level. Shorting the yen at these levels is not particularly attractive given the limited upside toward 160, but going long yen could become interesting if the US dollar eases—potentially on the back of renewed peace hopes.
Across the Pacific, the Federal Reserve (Fed) starts its two-day policy meeting today and is also expected to keep rates unchanged. In fact, the Fed is no longer expected to cut rates until December, even though Kevin Warsh supports the idea of cuts — a move that would greatly please the White House.
Inflation expectations have risen uncomfortably over the past two months, driven by a notable jump in energy prices. At this stage, no one — including central bankers — can predict what comes next if Middle East tensions continue to disrupt energy flows. What we do know is that the longer the Strait of Hormuz remains under strain, the stronger the impact on markets will be. Oil prices are currently trading roughly 50% above pre-conflict levels, and that is changing the way investors perceive risk.
Two months ago, appetite for Big Tech was weakening in favour of non-tech and non-US markets. That shift was largely driven by massive AI spending plans from Big Tech, combined with uncertainty around the timing of returns on those investments. Investors also grew concerned that additional spending was eroding free cash flow and forcing companies to take on leverage to finance AI buildouts. Oracle’s CDS levels were thrown to every sauce as a reflection of those concerns: too much investment, too much leverage, uncertain returns.
But things have changed since then.
Today, the investment pledges from Big Tech have not changed, but the way investors perceive the risks has. Big Tech has proven resilient during the Middle East crisis and has increasingly been treated as a “safe harbour”. At the same time, Anthropic has helped support weakening sentiment around OpenAI and broader concerns about circular AI deals. These circular structures are now increasingly forming around Anthropic, with major tech companies investing in the firm, which in return commits to purchasing chips and computing power from them.
However, stepping back, even though the Anthropic news gave a sugar rush to AI investors in Q1, the underlying story has not changed. AI is extremely promising, but also highly capital intensive. Big Tech must continue investing to meet demand, but much of that demand is still circulating within the AI ecosystem rather than being driven by external end users. OpenAI and Anthropic sit at the centre of these flows and are under pressure to DELIVER.
Even though Anthropic’s revenue potential has been boosted by its latest model — which is considered too powerful to be widely released and could support higher-value contracts, including government deals — the gap between revenue generation and costs remains large.
How large? Even with recent estimates, Anthropic’s annualised revenue run-rate is believed to be around $20–30bn, while OpenAI is broadly estimated at $25bn+, depending on sources (both are private companies with no official figures). However, both are backed by far larger capital commitments: OpenAI through hundreds of billions of dollars in compute-related partnerships and expected funding capacity, and Anthropic through tens of billions in recent strategic investments from major cloud providers such as Amazon and Google.
Against that backdrop, profitability is still a long way off. Reports suggest both companies are still losing money once the full cost of running large-scale models is included, particularly GPU and cloud computing expenses. As a result, margins remain under pressure, as the cost of scaling AI is rising almost as quickly as demand.
In that sense, the AI structure is building like a house of cards on expectations of success from Anthropic and OpenAI. If anything were to go wrong with these two, AI would not disappear, but markets would face a significant repricing.
The upcoming Big Tech earnings will therefore be closely watched. Last quarter, most Big Tech companies beat earnings and revenue expectations, but that did not prevent investors from rotating out of the sector. In particular, markets reacted negatively to further increases in capital expenditure at a time when revenue growth was not accelerating in line.
Let’s see whether Anthropic can provide relief. Chipmakers and AI enablers continue to post strong results — unsurprisingly, as spending flows through the AI value chain — but it remains unclear whether this is translating into meaningful end-user revenue growth outside the ecosystem. Investors will therefore remain laser-focused on cloud division growth. Any disappointment could bring back a key concern: are these investments becoming obsolete before they start generating returns?
To me, the risks remain tilted to the upside given the speed of AI adoption and the potential in agentic AI and robotics. But valuations are once again elevated.
The Nasdaq 100’s P/E ratio eased following the latest earnings season, but investors were quick to take advantage of the cheaper valuations. As a result, Big Tech is once again priced to perfection into earnings, leaving little margin for disappointment. Strong results could continue to mask underlying economic weakness (trade, political & geopolitical mess) for a while, but any disappointment could derail tech appetite at a time when non-tech names are unable to pick up the slack.
BoJ Holds Policy Rate Steady at 0.75%, But With a Hawkish Vote Split
In focus today
- In the euro area, the ECB's consumer expectations survey is released where focus will be on the 1-year and 3-year CPI expectations. The ECB's quarterly bank lending survey is also released which will give insights into financing conditions and the outlook.
- In the US, Conference Board will release its April consumer confidence survey. Earlier, University of Michigan's April survey pointed towards weakening sentiment and higher inflation expectations. ADP will also release its weekly private sector employment growth estimate.
- In Hungary, the central bank of Hungary (MNB) is expected to keep its policy rate unchanged at 6.25% when it announces its decision this afternoon.
- Overnight, Australia's Q1 inflation data is expected to show underlying trimmed-mean inflation steady at +0.9% Q/Q.
Economic and market news
What happened overnight
As widely expected, the Bank of Japan is on hold this morning keeping the overnight call rate at 0.75%. The decision was taken with a 6-3 vote, a closer call than both at the March and January meetings when only Takata Hajime voted for a hike, supporting our expectation for a June hike. The new outlook report suggests that the energy crunch affects inflation more than activity with a 0.5pp revision to GDP growth in the fiscal year (FY) 2026 and only 0.1pp in FY2027 while inflation excluding fresh food and energy has been revised 0.4pp/0.5pp higher respectively. The board members' forecasts also indicate that they are more worried about faster inflation than the risk on activity. The market has reacted with a stronger JPY and JGB yields edging higher. Next up is the press conference where investors will look for further guidance towards a summer hike, currently priced in at about a 54% likelihood by markets.
What happened yesterday
In the Middle East, mediators are working to bridge gaps between the US and Iran despite the cancellation of face-to-face talks by President Trump over the weekend. Iran's latest proposal calls for phased negotiations, prioritising an end to the war and lifting the US blockade before addressing nuclear issues, a proposal that Trump has criticised. Iranian Foreign Minister Abbas Araqchi has visited Pakistan, Oman, and most recently Russia in pursuit of support. Oil prices rose slightly in Monday's trade to USD 109/bbl as markets seem anxious about the risk of renewed escalation of the conflict and/or failure to start talks on a deal to re-open the Strait of Hormuz.
In the euro area, the ECB released its quarterly Survey on the Access to Finance of Enterprises (SAFE) for Q1. Firms expect selling prices to rise by 3.5% (up from 2.9%) and input costs, including energy, to increase by 5.8% (up from 3.6%), while wage expectations moderated slightly to 2.8% (down from 3.1%). The survey partially reflects the impact of the war in Iran, with later responses indicating increased price pressures. The European Commission's business survey on seller price expectations, due on Wednesday, will provide further insights into inflation dynamics.
In tech, OpenAI has ended its exclusive partnership with Microsoft, paving the way for deals with Amazon and Google. While Microsoft will remain OpenAI's primary cloud partner and retain a licence to its intellectual property through 2032, the removal of exclusivity has raised concerns about its long-term competitive edge. Meanwhile, Chinese regulators have ordered Meta to unwind its USD 2 billion acquisition of AI startup Manus, citing national security risks and efforts to safeguard domestic AI talent and technology. The move underscores China's increasingly stringent approach to foreign investments in sensitive sectors like AI and adds to the geopolitical tensions ahead of the upcoming Trump-Xi summit.
Equities: Equities moved higher again yesterday, and again led by the US and tech, in what was a bit of waiting game before a storm of central bank meetings this week, earnings reports and macro data as we move further in. Cyclicals outperformed again, though not the deep cyclicals. As we have highlighted before, growth tech and the broader growth segment are carrying markets at the moment. At the other end of the spectrum, consumer staples were the worst-performing sector yesterday.
Consumer-related sectors are still struggling with the second-round effects from tariffs, and now also with the more immediate direct impact from higher oil prices, which effectively acts as a tax on the consumer. This also means that the equity rally remains highly selective. We expect that to continue for now, as the geopolitical, macro and earnings factors are all pointing in the same direction.
The rally is not only more sector-divergent; it is also becoming more regionally divided. Yesterday, the US outperformed, with cyclicals rising, while Europe underperformed and defensives did better.
This morning, Asia is mixed, once again driven by country and sector exposure, with tech higher. Japan is lagging after this morning's Bank of Japan meeting where the 6-3 vote split and a slightly more hawkish tone have pushed the yen stronger.
European futures are higher, while the picture is more mixed in the US.
FI and FX: The Bank of Japan kept its key rate unchanged at 0.75% as expected amid a 6-3 vote. The vote was a closer call than forecasted, resulting in JGB yields edging higher and a strengthening of the JPY close to 159. While the White House is weighing Iran's latest proposal, oil prices continue to climb with the June Brent future just shy of USD110/bbl. EUR/USD trades relatively steady near 1.17. Today's data calendar is light with no tier-1 releases scheduled, but we will still get the latest on consumer sentiment from both sides of the Atlantic in the form of ECB's and US Conference Board's surveys.
USD/JPY Daily Outlook
Daily Pivots: (S1) 159.12; (P) 159.39; (R1) 159.68; More...
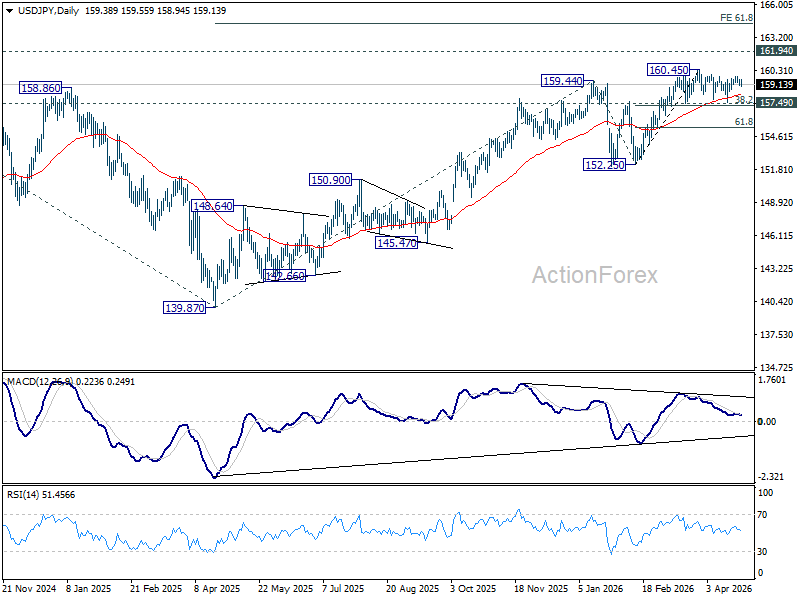
USD/JPY weakens slightly today but overall outlook is unchanged. Consolidations from 160.45 is still extending and intraday bias remains neutral. Further rise is expected with 157.49 cluster support (38.2% retracement of 152.25 to 160.45 at 157.31) intact. On the upside break of 160.45 will target a retest on 161.94 high. However, firm break of 157.31/49 will bring deeper fall back to 61.8% retracement at 155.38 next.
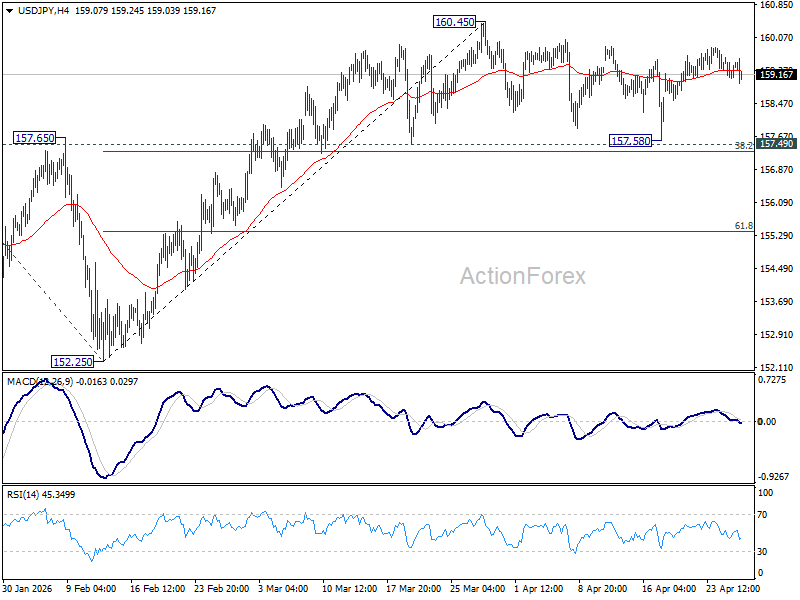
In the bigger picture, outlook is unchanged that corrective pattern from 161.94 (2024 high) should have completed with three waves at 139.87. Larger up trend from 102.58 (2021 low) could be ready to resume through 161.94. This will remain the favored case as long as 55 W EMA (now at 153.81) holds. Firm break of 161.94 will pave the way to 61.8% projection of 102.58 to 161.94 from 139.87 at 176.75.