
Sample Category Title
GBP/USD Mid-Day Outlook
Daily Pivots: (S1) 1.3477; (P) 1.3508; (R1) 1.3563; More...
Intraday bias in GBP/USD remains neutral first, and further rise is expected as long as 1.3446 support holds. On the upside, firm break of 61.8% retracement of 1.3867 to 1.3158 at 1.3596 will pave the way to retest 1.3867 high. However, break of 1.3446 will turn bias back to the downside for deeper pullback.
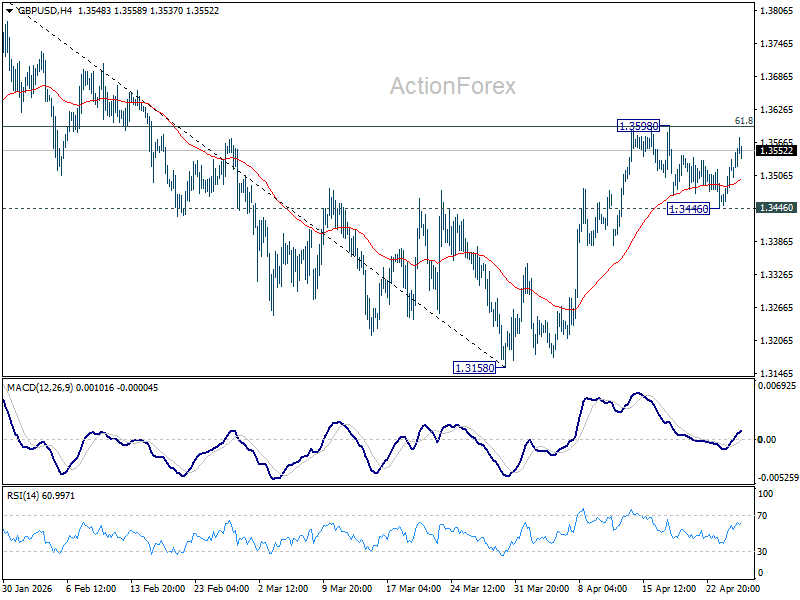
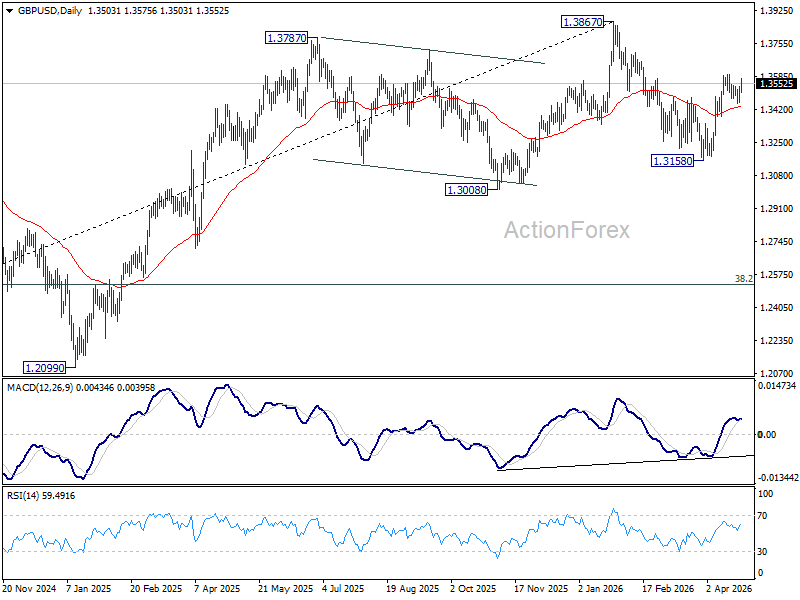
In the bigger picture, current development suggests that price actions from 1.3867 are merely a corrective pattern within the broader up trend from 1.0351 (2022 low). With 1.3008 support intact, medium term bullishness is maintained and break of 1.3867 is back in favor for a later stage, towards 1.4248 key resistance (2021 high).
USD/CHF Mid-Day Outlook
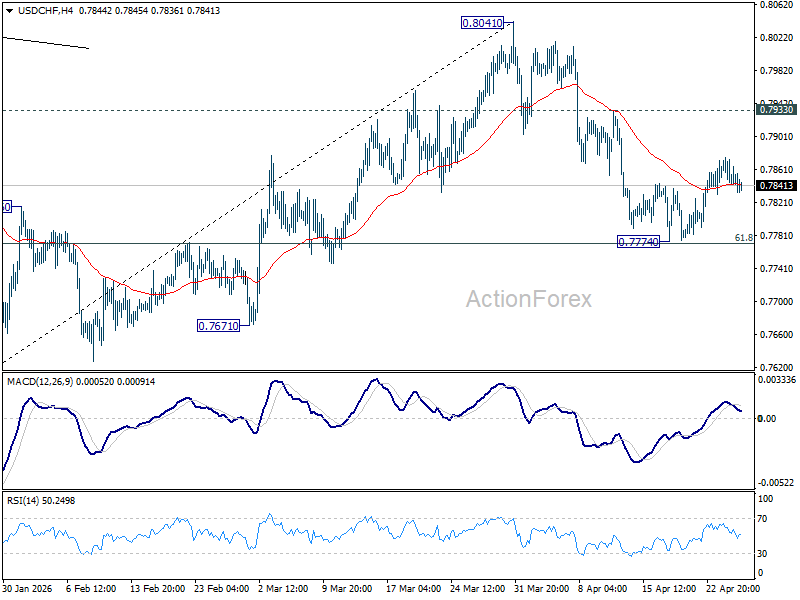
Daily Pivots: (S1) 0.7837; (P) 0.7858; (R1) 0.7870; More….
Intraday bias in USD/CHF stays neutral and outlook is unchanged. Further decline is expected as long as 0.7933 resistance holds. On the downside, sustained break of 61.8% retracement of 0.7603 to 0.8041 at 0.7770 will pave the way to retest 0.7603 low. However, break of 0.7933 resistance will bring stronger rise back to retest 0.8041 high.
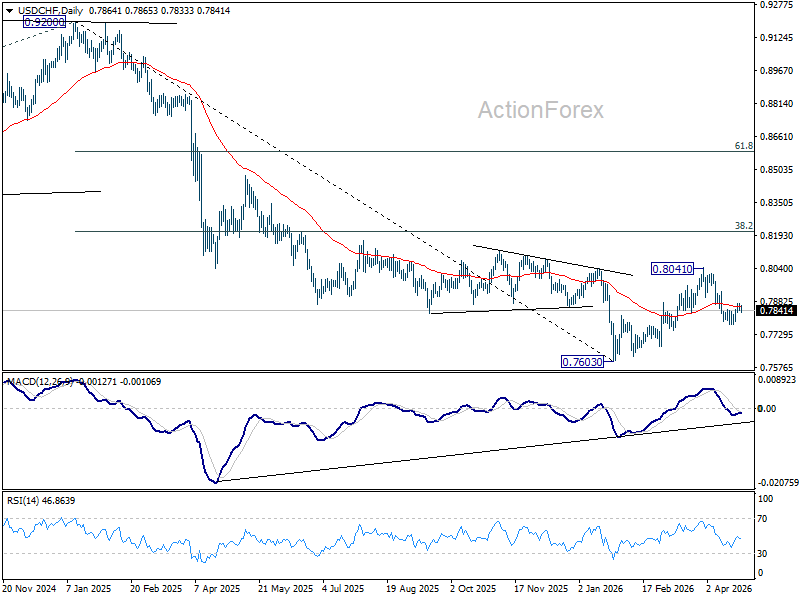
In the bigger picture, rebound from 0.7603 medium term bottom is seen as correcting the fall from 0.9200 only. Rejection by 55 W EMA (now at 0.8053) will affirm this bearish case, and setup down trend resumption to 100% projection of 1.0146 (2022 high) to 0.8332 from 0.9200 at 0.7382 at a later stage. Though, sustained break of 55 W EMA will suggest that it's probably correcting the larger scale down trend from 1.0146 (2022 high).
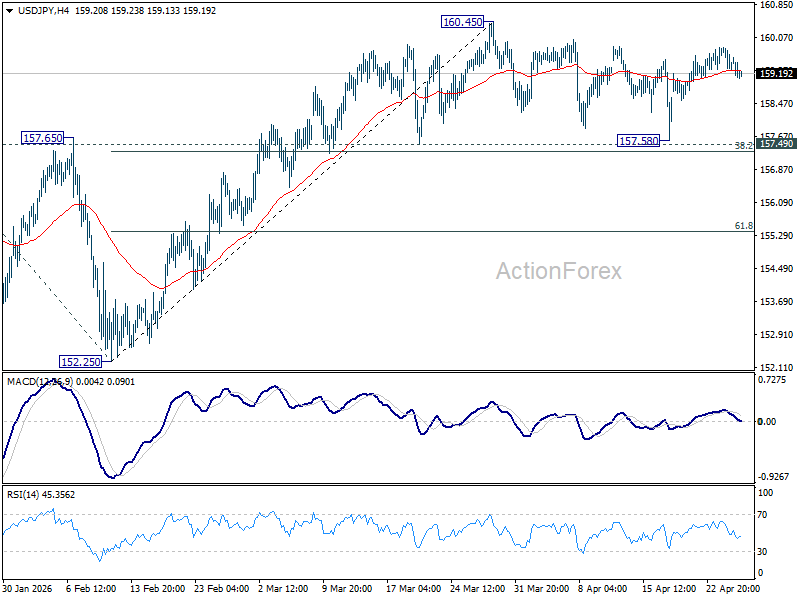
USD/JPY Mid-Day Outlook
Daily Pivots: (S1) 159.13; (P) 159.49; (R1) 159.73; More...
USD/JPY dips mildly today but remains bounded in established range below 160.45. Intraday bias remains neutral at this point. Further rise is expected with 157.49 cluster support (38.2% retracement of 152.25 to 160.45 at 157.31) intact. On the upside break of 160.45 will target a retest on 161.94 high. However, firm break of 157.31/49 will bring deeper fall back to 61.8% retracement at 155.38 next.
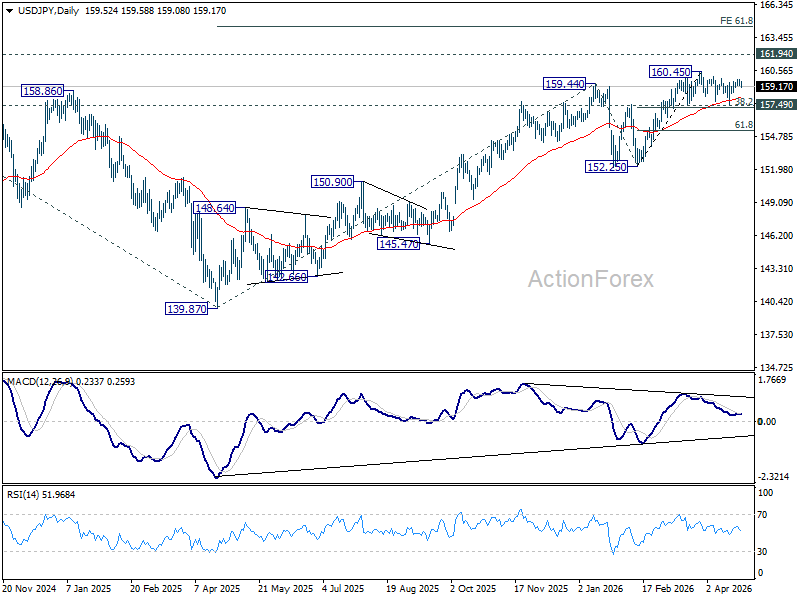
In the bigger picture, outlook is unchanged that corrective pattern from 161.94 (2024 high) should have completed with three waves at 139.87. Larger up trend from 102.58 (2021 low) could be ready to resume through 161.94. This will remain the favored case as long as 55 W EMA (now at 153.81) holds. Firm break of 161.94 will pave the way to 61.8% projection of 102.58 to 161.94 from 139.87 at 176.75.
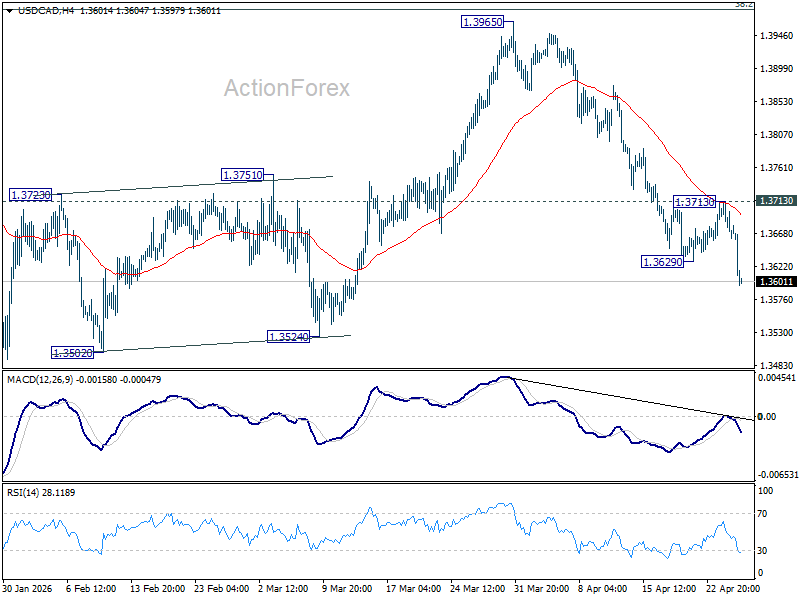
USD/CAD Mid-Day Outlook
Daily Pivots: (S1) 1.3651; (P) 1.3683; (R1) 1.3705; More...
USD/CAD's fall from 1.3965 resumed by breaking through 1.3629 temporary low. Intraday bias is back on the downside for retesting 1.3480 low. Firm break there will resume larger down trend. For now, risk will stay on the downside as long as 1.3713 resistance holds, in case of recovery
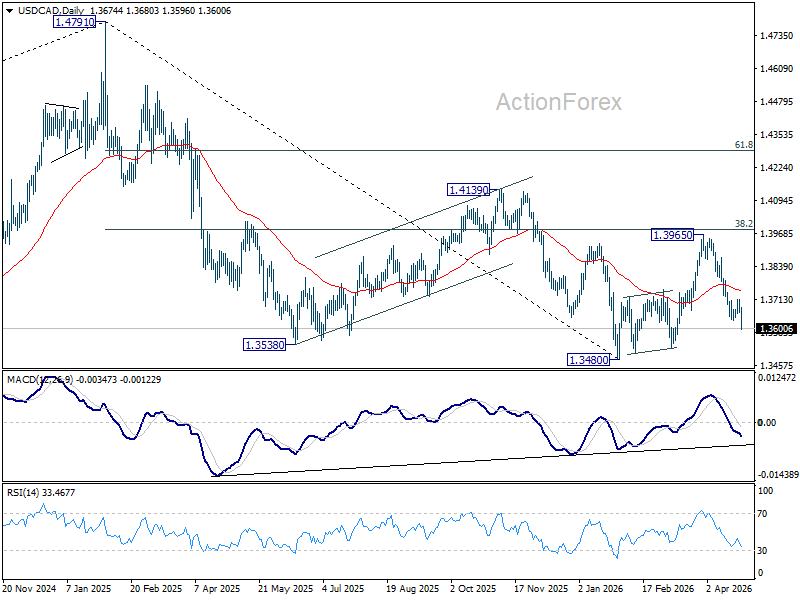
In the bigger picture, price actions from 1.4791 are seen as a corrective pattern to the whole up trend from 1.2005 (2021 low). Deeper fall could be seen, as the pattern extends, to 61.8% retracement of 1.2005 to 1.4791 at 1.3069. However, decisive break of 38.2% retracement of 1.4791 to 1.3480 at 1.3981 will argue that the correction has completed with three waves down to 1.3480 already. Further break of 1.4139 will confirm and bring retest of 1.4791 high.
Dollar Slides as Traders Position for Dovish Fed Ahead of Powell’s Final Meeting
Dollar is coming under renewed pressure as traders move to lighten long positions ahead of the FOMC meeting this week. The move reflects reluctance among traders to hold long USD exposure into an event that is seen as carrying downside risks for the currency.
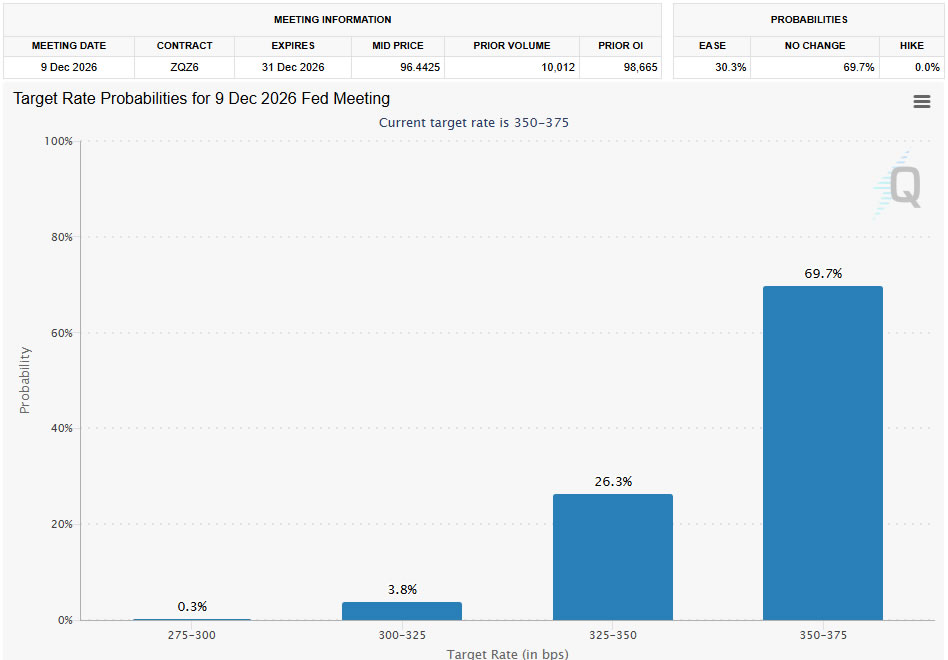
The outcome of the meeting is largely a foregone conclusion, with rates expected to remain unchanged at 3.50%–3.75%. Rather than expecting a policy surprise, markets are focused on the risk of a less-hawkish message that could also be interpreted as a dovish tile. .
The inflation backdrop is central to this shift. Headline CPI rose from 3.0% to 3.3% in March, but the increase was driven almost entirely by a 10.9% surge in energy costs. Core CPI, by contrast, eased from 2.8% to 2.6%, reinforcing the argument that underlying inflation pressures are still relatively contained.
This distinction allows the Fed to treat the recent inflation spike as transitory. With oil prices stabilizing at elevated levels rather than accelerating further, the urgency for a hawkish shift has diminished.
Labor market signals add to the case for caution. The sharp contrast between strong hiring in January/March and deep contraction in February highlights ongoing volatility, while the broader picture suggests a low hiring, low firing environment. This suggests a fragile equilibrium, where the Fed may prefer to avoid aggressive policy moves that could disrupt stability.
Market pricing reflects this outlook clearly. Fed funds futures are assigning virtually no probability to a rate hike this year, while indicating around a 30% chance of a cut by the end of the year.
Meanwhile, the updated projections will also be key. Inflation forecasts are likely to be revised higher in the short term, while growth projections may be trimmed. The net result could be a dot plot that still points to one rate cut this year—hardly a hawkish signal.
The leadership transition adds another dimension to the story. As Powell prepares to hand over to Kevin Warsh on May 15, markets expect him to avoid setting a new policy direction at this stage. A balanced tone, intended to leave flexibility for the incoming chair, could instead be interpreted as confirmation that the Fed is moving away from a hawkish stance.
In FX markets, the reaction is already clear—Dollar is the weakest performer of the day so far, while Kiwi and Aussie lead gains, followed by Euro, reflecting a broader shift toward risk-sensitive currencies.
In Europe, at the time of writing, FTSE is down -0.27%. DAX is up 0.49%. CAC is up 0.14%. UK 10-year yield is down -0.176 at 4.985. Germany 10-year yield is up 0.024 at 3.022. Earlier in Asia, Nikkei rose 1.38%. Hong Kong HSI fell -0.20%. China Shanghai SSE rose 0.16%. Singapore Strait Times fell -0.61%. Japan 10-year JGB yield rose 0.0387 to 2.479.
ECB Survey Signals Inflation Reacceleration Risk as Firms Lift Price and Cost Expectations
Eurozone firms are raising prices again. The ECB’s SAFE survey shows a sharp jump in selling price and cost expectations following the Middle East energy shock, while wages remain contained—signaling a renewed inflation pulse with limited second-round effects. Read More.
German Consumer Confidence Sinks to Two-Year Low as Inflation and War Fears Hit Sentiment
German consumer sentiment is deteriorating sharply, with the GfK index falling to its lowest level since 2023. Inflation is crushing income expectations while geopolitical tensions linked to Iran are darkening the economic outlook, raising fresh concerns over consumption and growth. Read More.
Oil Stalls as ‘Frozen Conflict’ Replaces Escalation Fears in US–Iran Standoff
Oil trades in a tight range as US–Iran tensions enter a “frozen conflict” phase. With Brent testing key near term channel resistance and traders reluctant to chase headlines, the next directional move will depend on a break above $110 or rejection lower. Read More.
AUD/JPY Eyes Breakout Toward 120 as BoJ Decision and Australia CPI Set Up High-Stakes Week
AUD/JPY is approaching a breakout point as BoJ policy and Australia CPI set the tone for the week. With yen weakness risks rising and inflation expected to accelerate, the pair could push toward 120 if key catalysts align. Read More.
USD/CAD Mid-Day Outlook
Daily Pivots: (S1) 1.3651; (P) 1.3683; (R1) 1.3705; More...
USD/CAD's fall from 1.3965 resumed by breaking through 1.3629 temporary low. Intraday bias is back on the downside for retesting 1.3480 low. Firm break there will resume larger down trend. For now, risk will stay on the downside as long as 1.3713 resistance holds, in case of recovery
In the bigger picture, price actions from 1.4791 are seen as a corrective pattern to the whole up trend from 1.2005 (2021 low). Deeper fall could be seen, as the pattern extends, to 61.8% retracement of 1.2005 to 1.4791 at 1.3069. However, decisive break of 38.2% retracement of 1.4791 to 1.3480 at 1.3981 will argue that the correction has completed with three waves down to 1.3480 already. Further break of 1.4139 will confirm and bring retest of 1.4791 high.
ECB Survey Signals Inflation Reacceleration Risk as Firms Lift Price and Cost Expectations
The ECB’s latest Survey on the Access to Finance of Enterprises (SAFE) points to a renewed build-up in price pressures, driven largely by the fallout from the Middle East conflict. Firms reported a marked increase in expectations for both selling prices and input costs over the next 12 months, highlighting a shift in the near-term inflation outlook.
Selling price expectations rose from 2.9% to 3.5%, while input costs—including energy—jumped more sharply from 3.6% to 5.8%. The increase reflects the direct impact of higher energy prices following the escalation in the Middle East, with firms passing through rising costs into pricing decisions. Notably, daily survey responses showed a clear shift after late February, with firms surveyed after the onset of the conflict reporting significantly higher expectations.
In contrast, wage dynamics appear more contained. Wage growth expectations edged down from 3.1% to 2.8%, suggesting that the current inflation impulse is being driven more by external cost shocks than domestic labor pressures.
Inflation expectations mirror this divergence between short-term pressure and longer-term stability. One-year ahead inflation expectations increased from 2.6% to 3.0%, accompanied by a wider dispersion in outlooks, reflecting heightened uncertainty. However, expectations for three- and five-year horizons held steady at 3.0%, indicating that longer-term inflation expectations remain anchored despite the recent shock.
That said, underlying risks are shifting. The share of firms expecting upside risks to five-year inflation rose from 56% to 65%, and the distribution of long-term expectations has widened.
| Indicator | Previous | Latest | Change |
|---|---|---|---|
| Selling Price Expectations (12m) | 2.9% | 3.5% | ↑ +0.6pp |
| Input Cost Expectations (12m) | 3.6% | 5.8% | ↑ +2.2pp |
| Wage Growth Expectations (12m) | 3.1% | 2.8% | ↓ -0.3pp |
| 1-Year Inflation Expectations | 2.6% | 3.0% | ↑ +0.4pp |
| 3-Year Inflation Expectations | 3.0% | 3.0% | → Unchanged |
| 5-Year Inflation Expectations | 3.0% | 3.0% | → Unchanged |
| Upside Risk to 5Y Inflation (% of firms) | 56% | 65% | ↑ +9pp |
Fed Preview: In a Waiting Mode
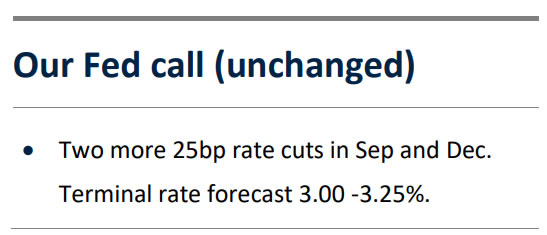
- We expect the Fed to maintain its policy rates unchanged at the April meeting, in line with broad consensus and market pricing. We forecast the Fed resuming rate cuts in September, earlier than markets price in, but do not expect firm forward guidance at this stage.
- Senator Tillis' decision to support Kevin Warsh's nomination as the new Fed Chair means, that the April meeting will be Powell's final one as the Chair. Powell could announce whether he intends to continue in the Fed Board of Governors until the end of his term (Jan 2028), or step down.
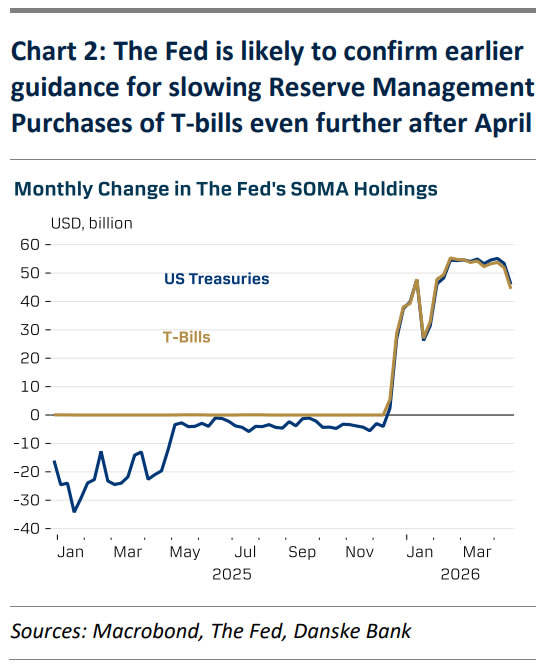
- The Fed is likely to reaffirm its earlier guidance for slowing down Reserve Management Purchases (RMPs) of T-bills after April. We expect market reactions to be limited, but see risks skewed towards lower UST yields and weaker USD if Powell maintains the door open for cuts this year.
With markets pricing essentially no risk for a policy rate change this week and with no new economic projections, Wednesday's main focus will be on Powell. And not just for policy reasons, but also as the meeting will most likely end up being Powell's last one as the Fed chair. He has not yet confirmed whether he intends to step down also from the Fed Board of Governors but could provide the guidance in the press conference. Powell's term as a Governor runs until January 2028.
Senator Thom Tillis confirmed he is ready to advance Kevin Warsh's nomination as the new Chair after Department of Justice announced it is ending the investigation against the Fed. On the Fed Board Warsh replaces Stephen Miran (the most dovish governor). But if Powell steps down, Trump could renominate Miran right back.
The Fed remains in a comfortable position to wait-and-see how the energy supply outlook evolves and how will the economy react. The latest available CPI data from March suggested that underlying core inflation pressures had remained well in check, and markets' longer-term inflation expectations have remained very steady.
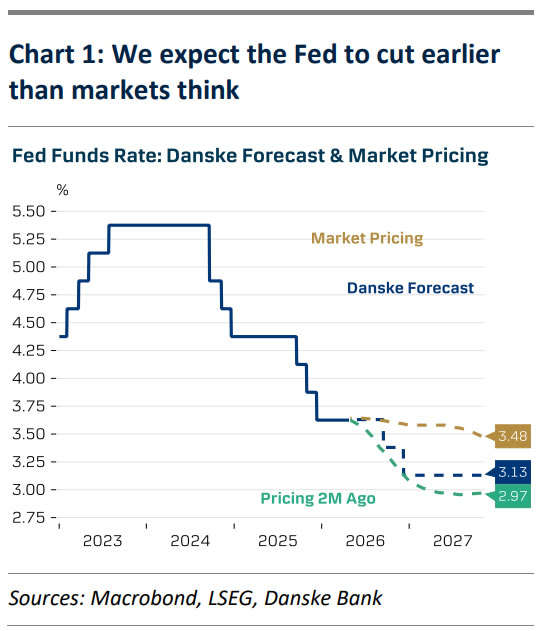
Economic growth remains resilient but slowing. Atlanta Fed's Nowcast for Q1 GDP growth has declined to just 1.2% Q/Q AR from 3.0% two months ago. Part of the slowdown is linked to a rebound in imports amid lower tariffs, but estimates for private consumption have also declined. We think that lack of labour supply growth and tighter financial conditions will continue to weigh on growth towards H2, and pave way for resuming rate cuts in September and December (chart 1).
This week will not yet be the time for providing firm forward guidance. But as market prices in only cumulative 10bp of cuts by December, even cautious hints of resuming easing could trigger a move lower in UST yields and broad USD. We expect the Fed to reaffirm its earlier guidance for slowing down the pace of Reserve Management Purchases of T-bills after April. The purchases have already started declining after the April Tax Date, and are likely to stabilize below USD10bn per month, down from a recent pace of more than USD50bn per month (chart 2).
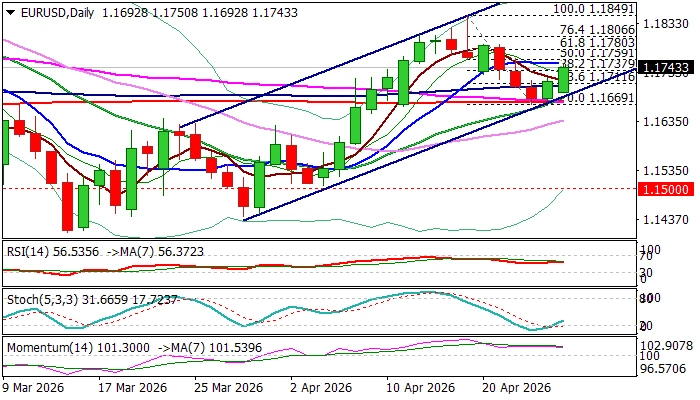
EUR/USD: Recovery Accelerates and Cracks Daily Cloud Top, 20/200 DMA Bull-Cross Underpins
The Euro firmed further on Monday, generating initial signal of formation of reversal pattern on daily chart.
Recovery from a higher base at 1.1660 zone extends into second straight day and cracks significant barrier at 1.1745 (top of thick daily Ichimoku cloud) with sustained break here to boost positive signal and open way for further recovery.
Recent pullback from 1.1849 (Apr 17 peak) was contained by strong supports at 1.1681/75 (Fibo 38.2% retracement of 1.1410/1.1849 rally / 200DMA), where a double bottom and bullish engulfing (Friday) has been formed.
Rising 20DMA crossed above 200DMA, to additionally support recovery, as technical picture on daily chart is predominantly bullish.
Break of cloud top and nearby 50% retracement / daily Tenkan-sen (1.1759) to expose targets at 1.1790 and 1.1806, guarding key barrier at 1.1849.
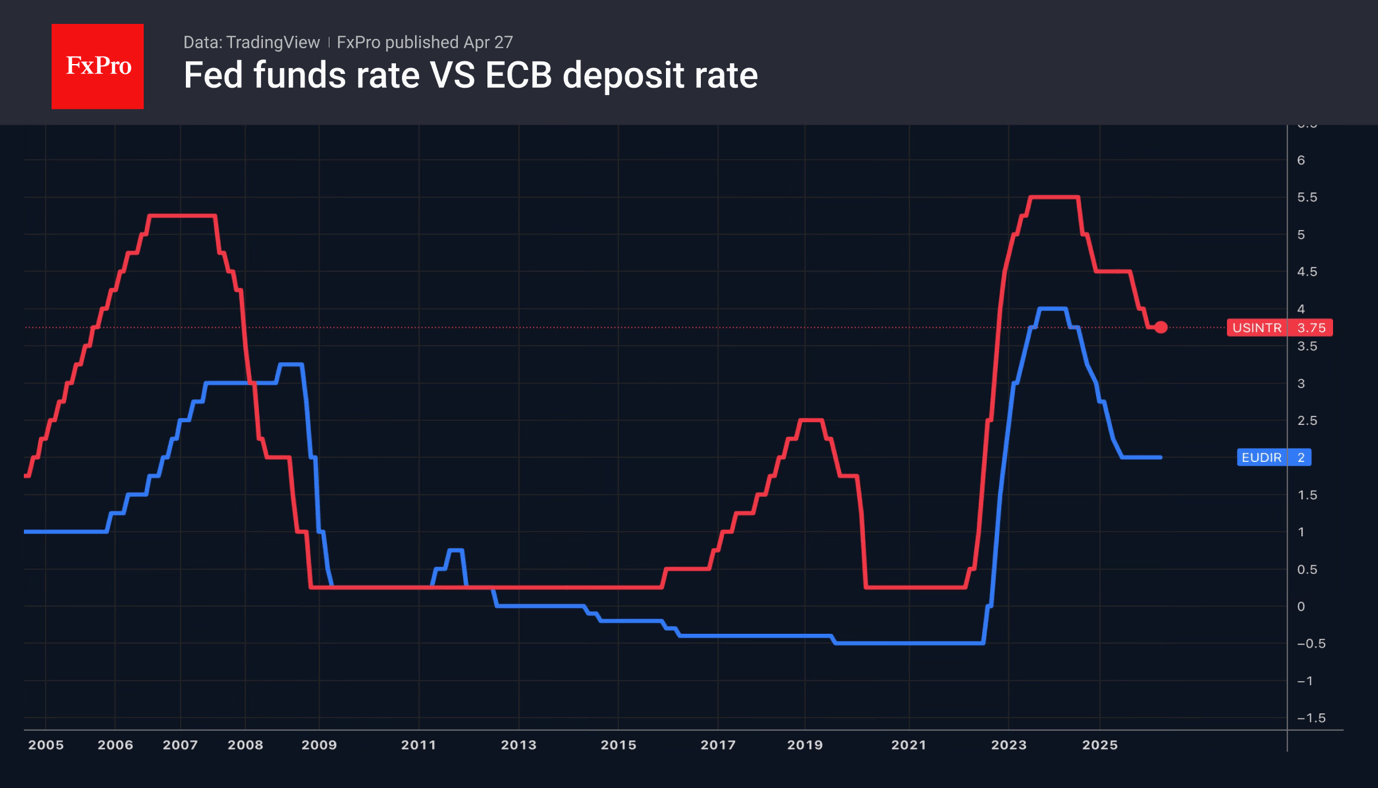
The notion is supported by the monetary policy outlook for the coming months, as economists expect the ECB to start tightening its policy as early as June and anticipate 50bps rate hike by October, while the Fed is widely expected to stay on hold in the next meeting (the last policy decision under Powell’s leadership), while new head of the US central bank is expected to be more compliant with President Trump’s demands for lower interest rates.
Broken 100DMA (1.1706) reverted to solid support which should keep the downside protected in case of failure at cloud top, though overall bias is expected to stay with bulls while the price stays above 200DMA (which protects the downside since Apr 9).
Res: 1.1759; 1.1790; 1.1806; 1.1849.
Sup: 1.1730; 1.1706; 1.1675; 1.1636.
Central Banks Taking the Initiative
- Expectations of signals regarding an ECB rate hike are supporting EURUSD.
- Miscommunication by the Bank of Japan will lead to a rise in USDJPY.
The US dollar initially rose at the start of the week, following oil prices, but quickly turned lower, losing a quarter of a per cent against a basket of major currencies since the start of the day. This week, markets are awaiting Congress’s confirmation of Kevin Warsh as Fed Chair, an acceleration in European inflation and hawkish rhetoric from the ECB. With additional support from risk appetite, as evidenced by the rally in key indices, this will be sufficient to drive euro growth.
The US Department of Justice is closing its criminal investigation into Powell, and Senator Tom Tillis is ready to back Warsh’s nomination for the post of Fed Chair. With 13 of 24 Republican votes, the central bank will have a new leader by mid-May. For his part, Warsh is firmly convinced that inflation will slow in the long term, although he has also stated that he would not cut rates at Donald Trump’s request.
With a firmer basis for the appointment of the new Fed chair, markets are beginning to price in a more dovish monetary policy stance. Bloomberg experts forecast that the Fed will cut rates twice in the next 12 months – in October 2026 and March 2027. However, the new chair could accelerate this process, which is why we are seeing increased pressure on the US dollar.
Experts surveyed by Bloomberg expect the ECB to make significant decisions as early as June. And specifically, the focus is on policy tightening. Markets could receive an early signal on rate hikes as soon as this week, helping investors prepare. Expectations of hawkish rhetoric from Christine Lagarde and divergence in monetary policy are firmly supporting the EURUSD pair. Even more so as European inflation is forecast to accelerate to 3% in April, the highest level since 2022.
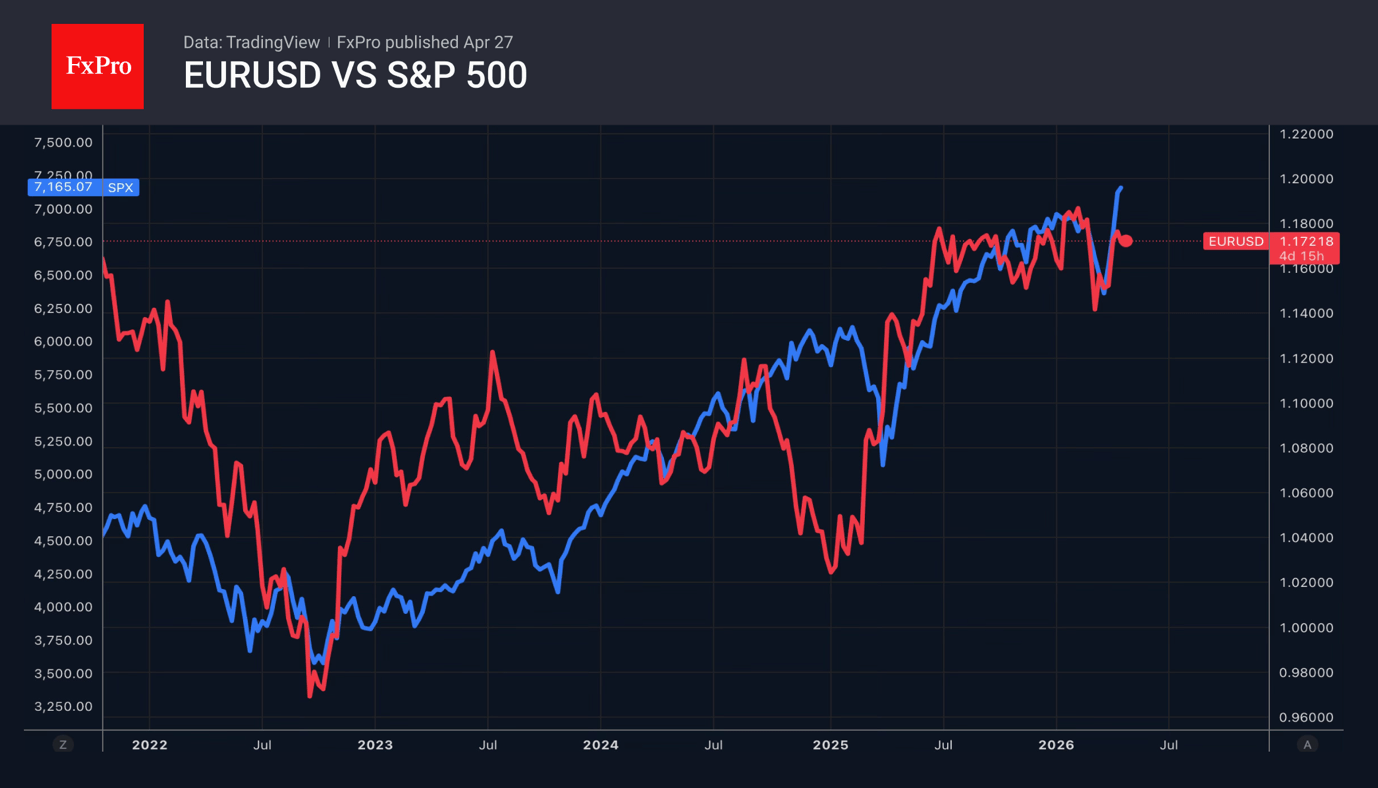
The US dollar, as a safe-haven asset, is under pressure from the ongoing rally in US stock indices, which are once again capitalising on artificial intelligence. The S&P 500 and EURUSD are finding support as investors gradually grow accustomed to the geopolitical conflict in the Middle East and believe a continuation of the ceasefire is more likely than escalation.
Signals of rate hikes are likely to come not only from the ECB but also from the Bank of Japan. Bloomberg experts also favour the resumption of the BoJ’s monetary tightening cycle in June. However, if Kazuo Ueda makes any missteps in his communications, USDJPY risks resuming its upward trend.
Gold Declines Amid Geopolitics, with Optimism Limited
Gold fell below 4,700 USD per troy ounce on Monday, extending last week's losses. Pressure on the precious metal has intensified following the breakdown of attempts to resume negotiations between the US and Iran, as well as the continued closure of the Strait of Hormuz, supporting inflationary risks.
Donald Trump cancelled the US delegation's trip to Islamabad for negotiations, while Tehran stated that it would not participate in dialogue under pressure or while under blockade.
Meanwhile, oil prices are rising. The Middle East conflict has now entered its ninth week. According to the IEA, it has triggered the largest supply shock in the energy market in recent history.
High inflationary risks are increasing expectations that central banks will keep interest rates elevated for longer, or even tighten policy further, putting pressure on gold as a non-yielding asset.
The Federal Reserve, for its part, remains cautious. The market still anticipates a gradual rate cut, but not in the near term.
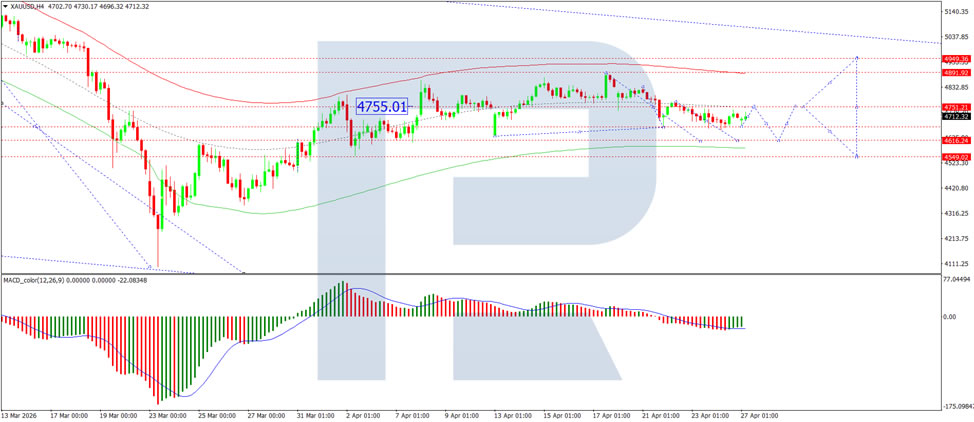
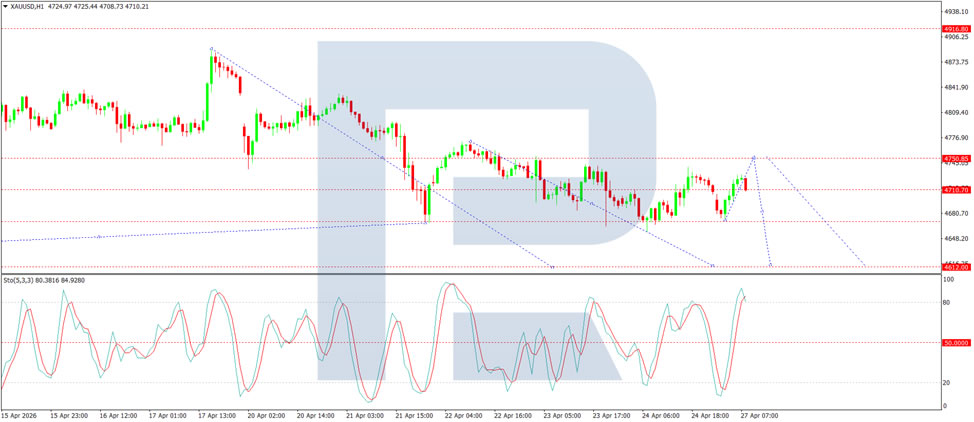
Technical Analysis
On the H4 XAU/USD chart, gold is trading within a consolidation range around the 4,690 USD level. An upside breakout could push prices towards 4,751 USD, while a downside break could lead to a move lower towards 4,616 USD. The MACD indicator confirms the current downside momentum, with its signal line below the centre line and pointing firmly downwards.
On the H1 chart, gold has broken below the 4,710 USD level and continues to move lower towards 4,680 USD. A corrective rebound towards 4,750 USD (testing from below) is likely, followed by a possible decline to 4,610 USD. The Stochastic oscillator supports this scenario, with its signal line below 80 and pointing firmly downwards towards 20.
Conclusion
Gold continues to decline as geopolitical tensions show no signs of easing. The breakdown of US-Iran negotiations, combined with the ongoing blockade of the Strait of Hormuz, has pushed oil prices higher and heightened inflationary risks. With the conflict now in its ninth week and the IEA describing it as the largest supply shock in energy markets, central banks are expected to maintain or even tighten policy rates for longer. This environment remains unfavourable for non-yielding gold. The Fed's cautious stance offers little immediate relief. Technical indicators point firmly lower, with further downside towards 4,616–4,610 USD likely in the near term.