

Sample Category Title
China CPI unchanged at 1.2%, PPI Climbs to Highest Since 2022
China's consumer inflation remained steady in May even as producer price pressures continued to build. CPI held unchanged at 1.2% yoy, falling slightly short of expectations for a 1.3% yoy increase, while core CPI edged down from 1.2% yoy to 1.1% yoy. The data suggest that despite rising costs at the factory gate, underlying consumer demand remains relatively restrained.
A major factor holding down consumer inflation was food prices, which fell -1.7% yoy. Pork prices, a key component of China's food basket, plunged -16.1% yoy, offsetting broader inflationary pressures elsewhere in the economy. The softer core CPI reading also indicates that businesses are still facing challenges passing higher costs on to consumers, despite stronger economic activity and improving trade performance in recent months.
In contrast, producer prices accelerated sharply from 2.8% yoy to 3.9% yoy, matching expectations and reaching their highest level since July 2022. The National Bureau of Statistics attributed the increase to higher commodity prices and stronger demand in selected industries.
The energy shock linked to disruptions in global oil markets has played a major role in lifting China's factory-gate inflation, helping PPI return to positive territory in March for the first time since September 2022.
| Indicator | April | May | Forecast |
|---|---|---|---|
| CPI Y/Y | 1.2% | 1.2% | 1.3% |
| Core CPI Y/Y | 1.2% | 1.1% | |
| PPI Y/Y | 2.8% | 3.9% | 3.9% |
| PPI M/M | 1.7% | 0.5% |
Japan Producer Inflation Jumps to 6.3% as Energy Shock Drives Costs Higher
Japan's producer prices accelerated sharply in May, with PPI rising from 5.3% yoy to 6.3% yoy, well above expectations of 5.5% yoy and marking the fastest annual increase since March 2023. On a monthly basis, wholesale prices rose 0.9%, following a revised 2.8% gain in April. The data highlight how the Middle East energy shock is increasingly feeding into upstream inflation pressures across the Japanese economy.
The latest increase was driven primarily by higher prices for nonferrous metals, chemicals and petroleum products as the effective closure of the Strait of Hormuz pushed up crude oil and naphtha costs. The surge in import prices was even more striking. Japan's yen-based import price index jumped 25.5% yoy in May, accelerating from 21.0% yoy in April and recording its strongest increase since November 2022.
At the same time, strong overseas demand for AI-related semiconductors continued to provide an important offset. Export prices climbed 20.6% yoy in May, supported by robust shipments of technology products. While the surge in export earnings helps cushion the deterioration in Japan's terms of trade, the broader picture remains one of mounting inflation pressure.
| Indicator | April | May | Forecast |
|---|---|---|---|
| PPI Y/Y | 5.3% | 6.3% | 5.5% |
| PPI M/M | 2.8%* | 0.9% | N/A |
Hotter US Inflation Numbers Could Further Bolster Fed Hike Bets
- Middle East tensions keep inflation risks elevated.
- Fed hike fully priced in by year end amid strong NFP report.
- US CPI data on Wednesday (12:30 GMT) to enter the spotlight.
- Further acceleration in inflation could drive the dollar higher.
Middle East Tensions and NFP Data Bolster Fed Hike Bets
With tensions in the Middle East escalating once again over the weekend, hopes vanished that the Strait of Hormuz will reopen at some point soon, giving room to heightened inflation concerns as oil prices opened this week with a positive gap. Although it pulled back following headlines that Iran ended its military operations against Israel, the pullback was far from reflecting hope about permanent ceasefire soon. After all, Iranian officials warned that they would resume hostilities if attacks against Lebanon continue.
On Sunday, Iran fired missiles at Israeli military targets in retaliation for Israel’s attacks on Lebanon. Israel responded by attacking Iran, defying US President Trump’s call for restrain. The new hostilities came on top of a robust US jobs report on Friday, keeping inflation fears elevated and allowing investors to bring forward their Fed rate hike bets.
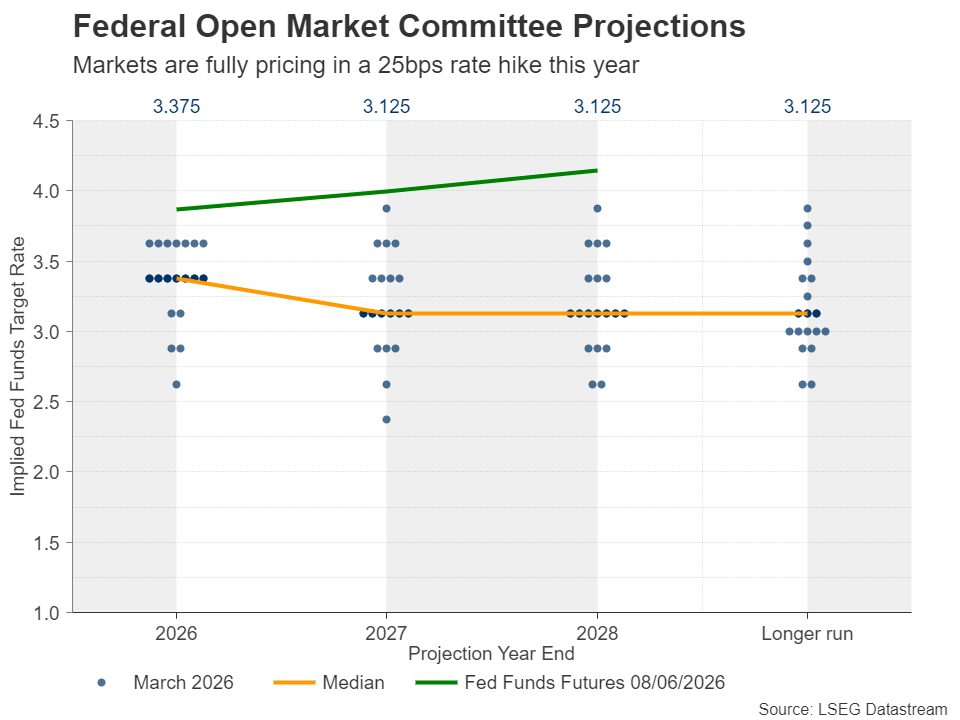
According to Fed funds futures, a quarter-point rate hike is now fully priced in for this year, the probability of it being delivered in September resting close to 50%. With the upcoming meeting being the first of the new Chair, Kevin Warsh, it is unlikely that the Fed will press the hike button before September. After all, Warsh was appointed by US President Trump, on the premise that he holds a less hawkish view than his predecessor Jerome Powell.
US CPI and PPI Data Could Reveal Further Acceleration
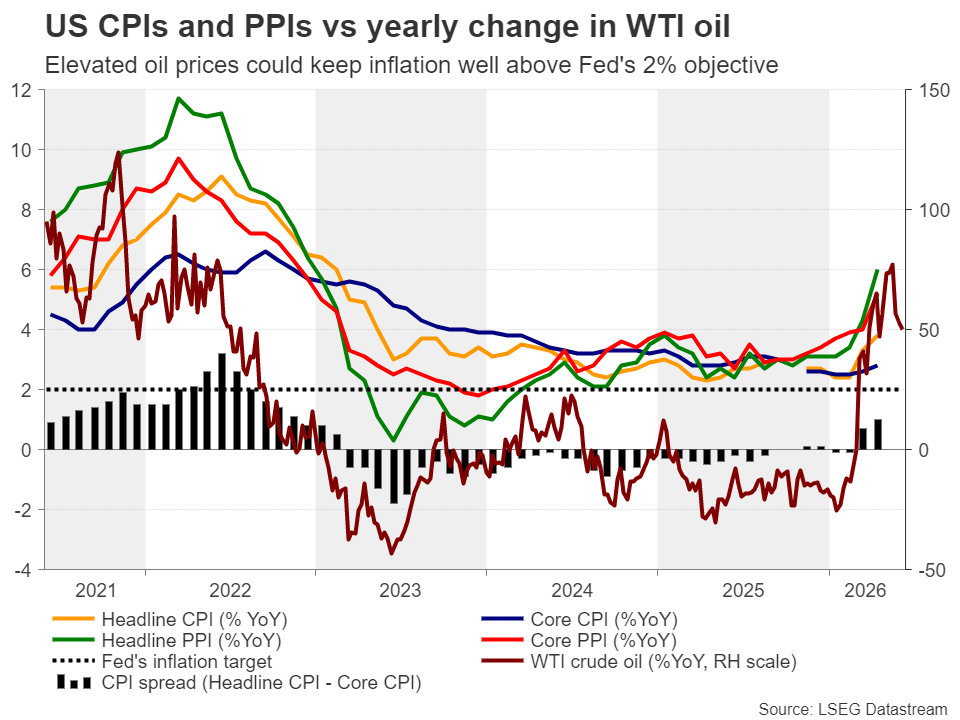
On Wednesday, the spotlight is likely to turn to the US CPI data for May, while on Thursday, the PPI figures will be released. In April, the headline CPI rate accelerated to 3.8% y/y from 3.3% amid the surge in oil prices due to the Middle East tensions, and although the rise in the core rate was smaller, the headline PPI rate surged to 6%. This means that products that were produced in April were set to arrive on store shelves at higher prices over the following months.
What’s more, although the year-on-year rate of change of WTI crude oil declined lately, it is hovering at April levels, which leaves little room for a material slowdown in inflation. All this poses upside risks to this week’s data. Indeed, the forecasts point to further acceleration, with the headline CPI rate expected to climb to 4.2% y/y from 3.8%, and the core to tick up to 2.9% y/y from 2.8%.
Another month of hotter-than-expected prints could drive the probability of a September hike higher, thereby pushing Treasury yields higher and adding more fuel to the dollar’s engines. At the same time, gold could extend its slide as the opportunity cost for holding the precious metal increases.
Euro/Dollar Rebounds, but Outlook Remains Bearish
From a technical standpoint, euro/dollar tumbled on Friday following the better-than-expected NFP report, breaking below the 1.1585 barrier and hitting support near the 1.1505 zone. Although the pair is now recovering, the short-term outlook remains negative.
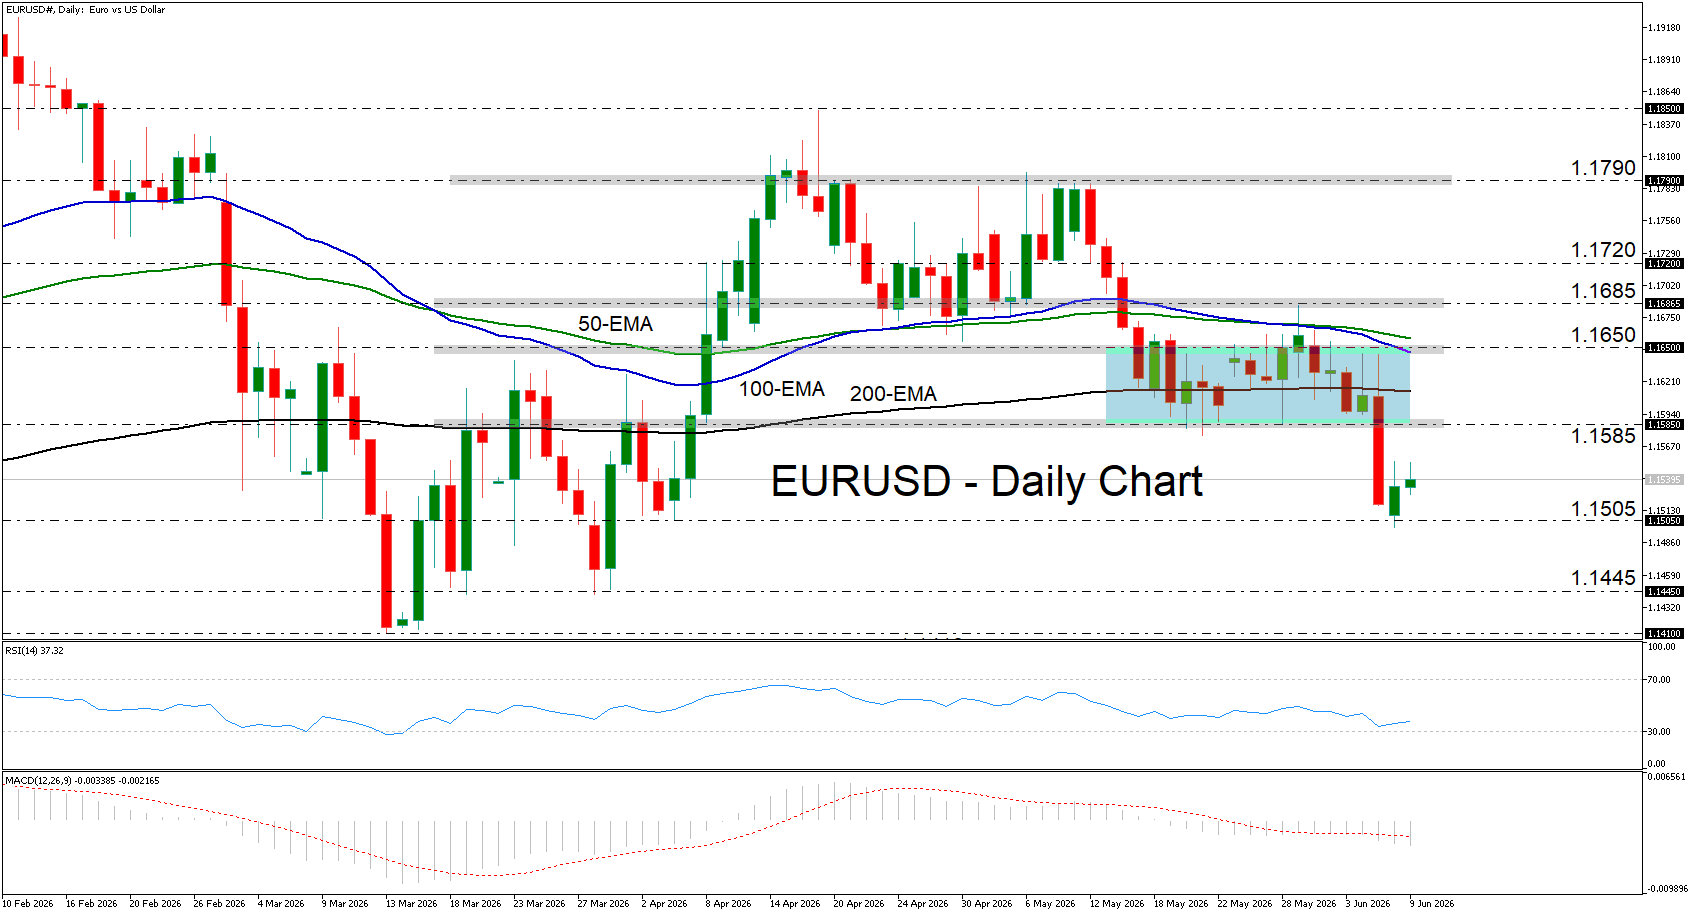
Even if the rebound stretches a bit more, the bears could re-charge from near the 1.1585 zone and shoot for another text near 1.1505. A break lower could set the stage for declines towards the 1.1445 area, marked by the lows of March 30 and 31. On the upside, a clear close above 1.1585 could signal the pair’s return within a sideways range, while a decisive move above 1.1650 may shift the outlook to bullish.
Gold Loses Ground with a Major Inflation Test Just Ahead
Key Highlights
- Gold started a fresh decline below the $4,400 support.
- A major bearish trend line is forming with resistance at $4,480 on the 4-hour chart.
- WTI Crude Oil extended losses and traded below $92.
- EUR/USD started a minor recovery wave above 1.1520.
Gold Price Technical Analysis
Gold failed to surpass $4,600 and started a fresh decline against the US Dollar. The price dipped below $4,550 and $4,500 to enter a bearish zone.
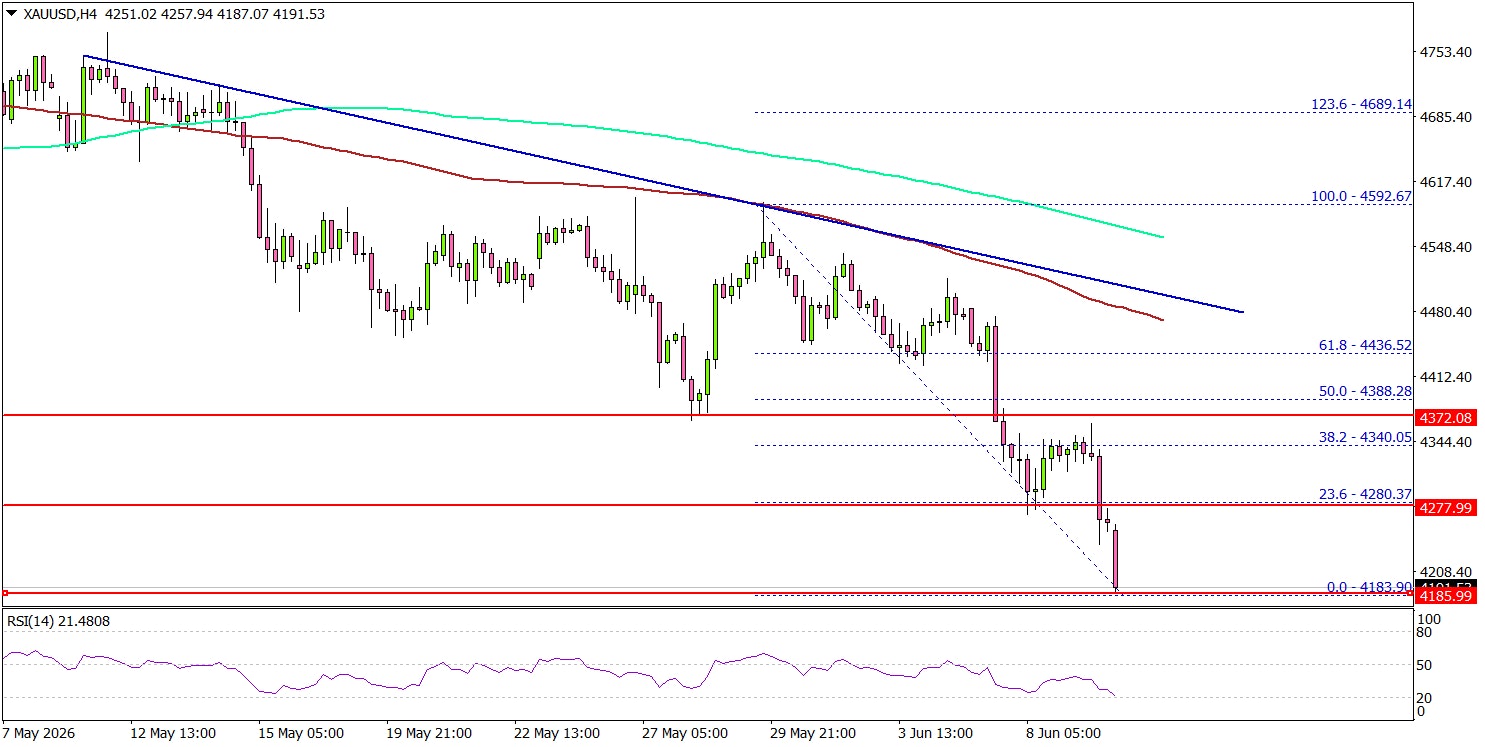
The 4-hour chart of XAU/USD indicates that the price even declined below $4,400, the 100 Simple Moving Average (red, 4 hours), and the 200 Simple Moving Average (green, 4 hours). A low was formed at $4,183, and the price is now showing many bearish signs.
On the upside, immediate resistance is $4,250. The next major resistance sits near $4,280 and the 23.6% Fib retracement level of the downward move from the $4,592 swing high to the $4,183 low.
The main resistance could be near $4,285 or the 50% Fib retracement level. A close above $4,285 could send the price toward $4,500. There is also a major bearish trend line forming with resistance at $4,480. A clear move above $4,480 could open the doors for more upside. In the stated case, the bulls could aim for a move toward $4,550 or even $4,600.
If there is another decline, Gold might find bids near the $4,150 level. The first major support sits at $4,065. The next support could be $4,000, below which the price might slide to $3,800. The main support sits at $3,550. Any more losses might call for a test of $3,300 or even $3,200 in the coming days.
Looking at WTI Crude Oil, the price started a fresh decline and there are chances of more losses below the $90 zone.
Economic Releases to Watch Today
- US Consumer Price Index for May 2026 (MoM) – Forecast +0.5%, versus +0.6% previous.
- US Consumer Price Index for May 2026 (YoY) – Forecast +4.2%, versus +3.8% previous.
- US Consumer Price Index Ex Food & Energy for May 2026 (YoY) – Forecast +2.9%, versus +2.8% previous.
USDJPY Steadies Above 160 on Looming Intervention
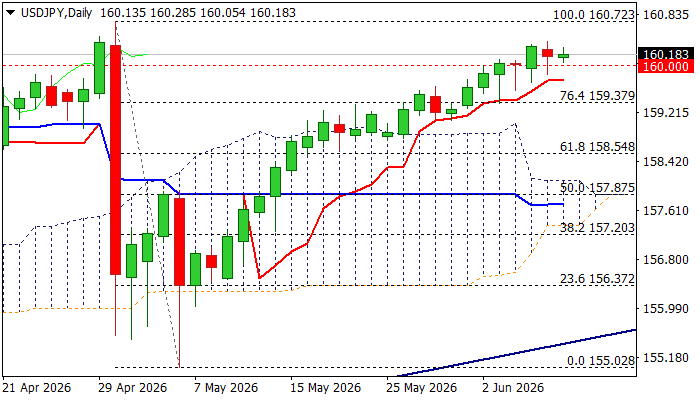
USDJPY remains firm and holds above 160 level for the third consecutive day, despite repeated warnings from Japan’s officials about intervention.
Growing speculations about Fed rate hike this year continue to underpin the dollar that keeps the pair elevated and on track to retest 2026 high (160.72), where intervention in late Apri started.
Traders focus on US CPI release (Wednesday) as inflation is expected to rise further in May (4.2% f/c vs 3.8% Apr) that may further pressure the US central bank, although Fed is widely expected to stay on hold in next week’s policy meeting under new Chairman Warsh.
Technical picture on daily chart is bullish but overbought, suggesting that bulls may pause, with 160 marking initial support and daily Tenkan-sen (159.74) expected to contain and keep bulls intact.
However, daily Ichimoku cloud is narrowing and will twist on Friday, which may attract deeper pullback.
Res: 160.45; 160.72; 161.00; 161.95
Sup: 160.00; 159.74; 159.30; 159.00
Platinum Wave Analysis
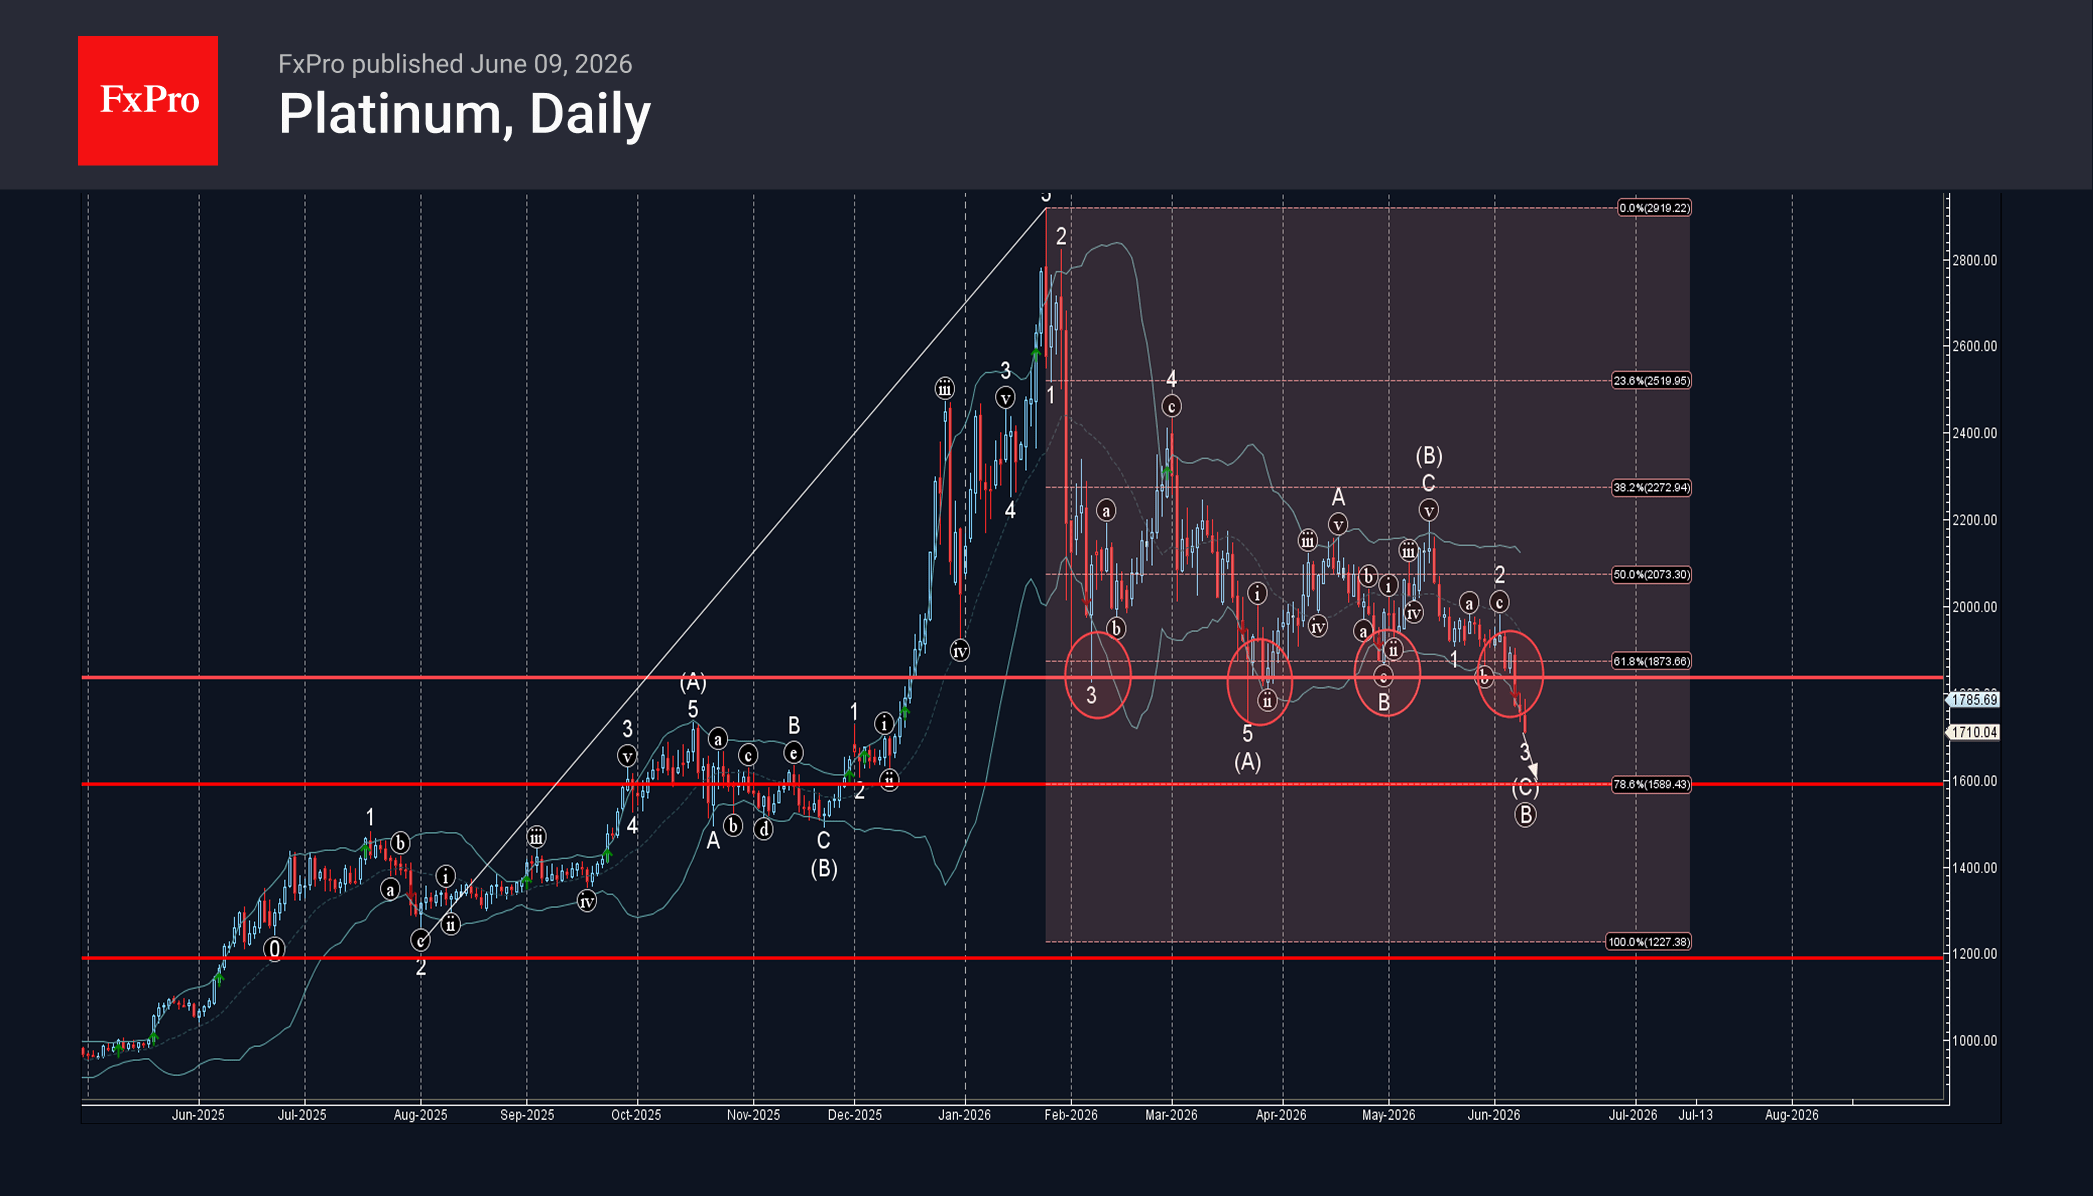
Platinum: ⬇️ Sell
– Platinum broke key support level 1835.00
– Likely to fall to support level 1660.00
Platinum recently broke the support zone between the key support level 1835.00 (which has been reversing the price from the start of February) and the 61.8% Fibonacci correction of the upward impulse from last August.
The breakout of this support zone accelerated the impulse wave 3 of the medium-term impulse wave (C) from May.
Platinum can be expected to fall to the next support level 1660.00 – target price for the completion of the active impulse wave (C).
EURAUD Wave Analysis
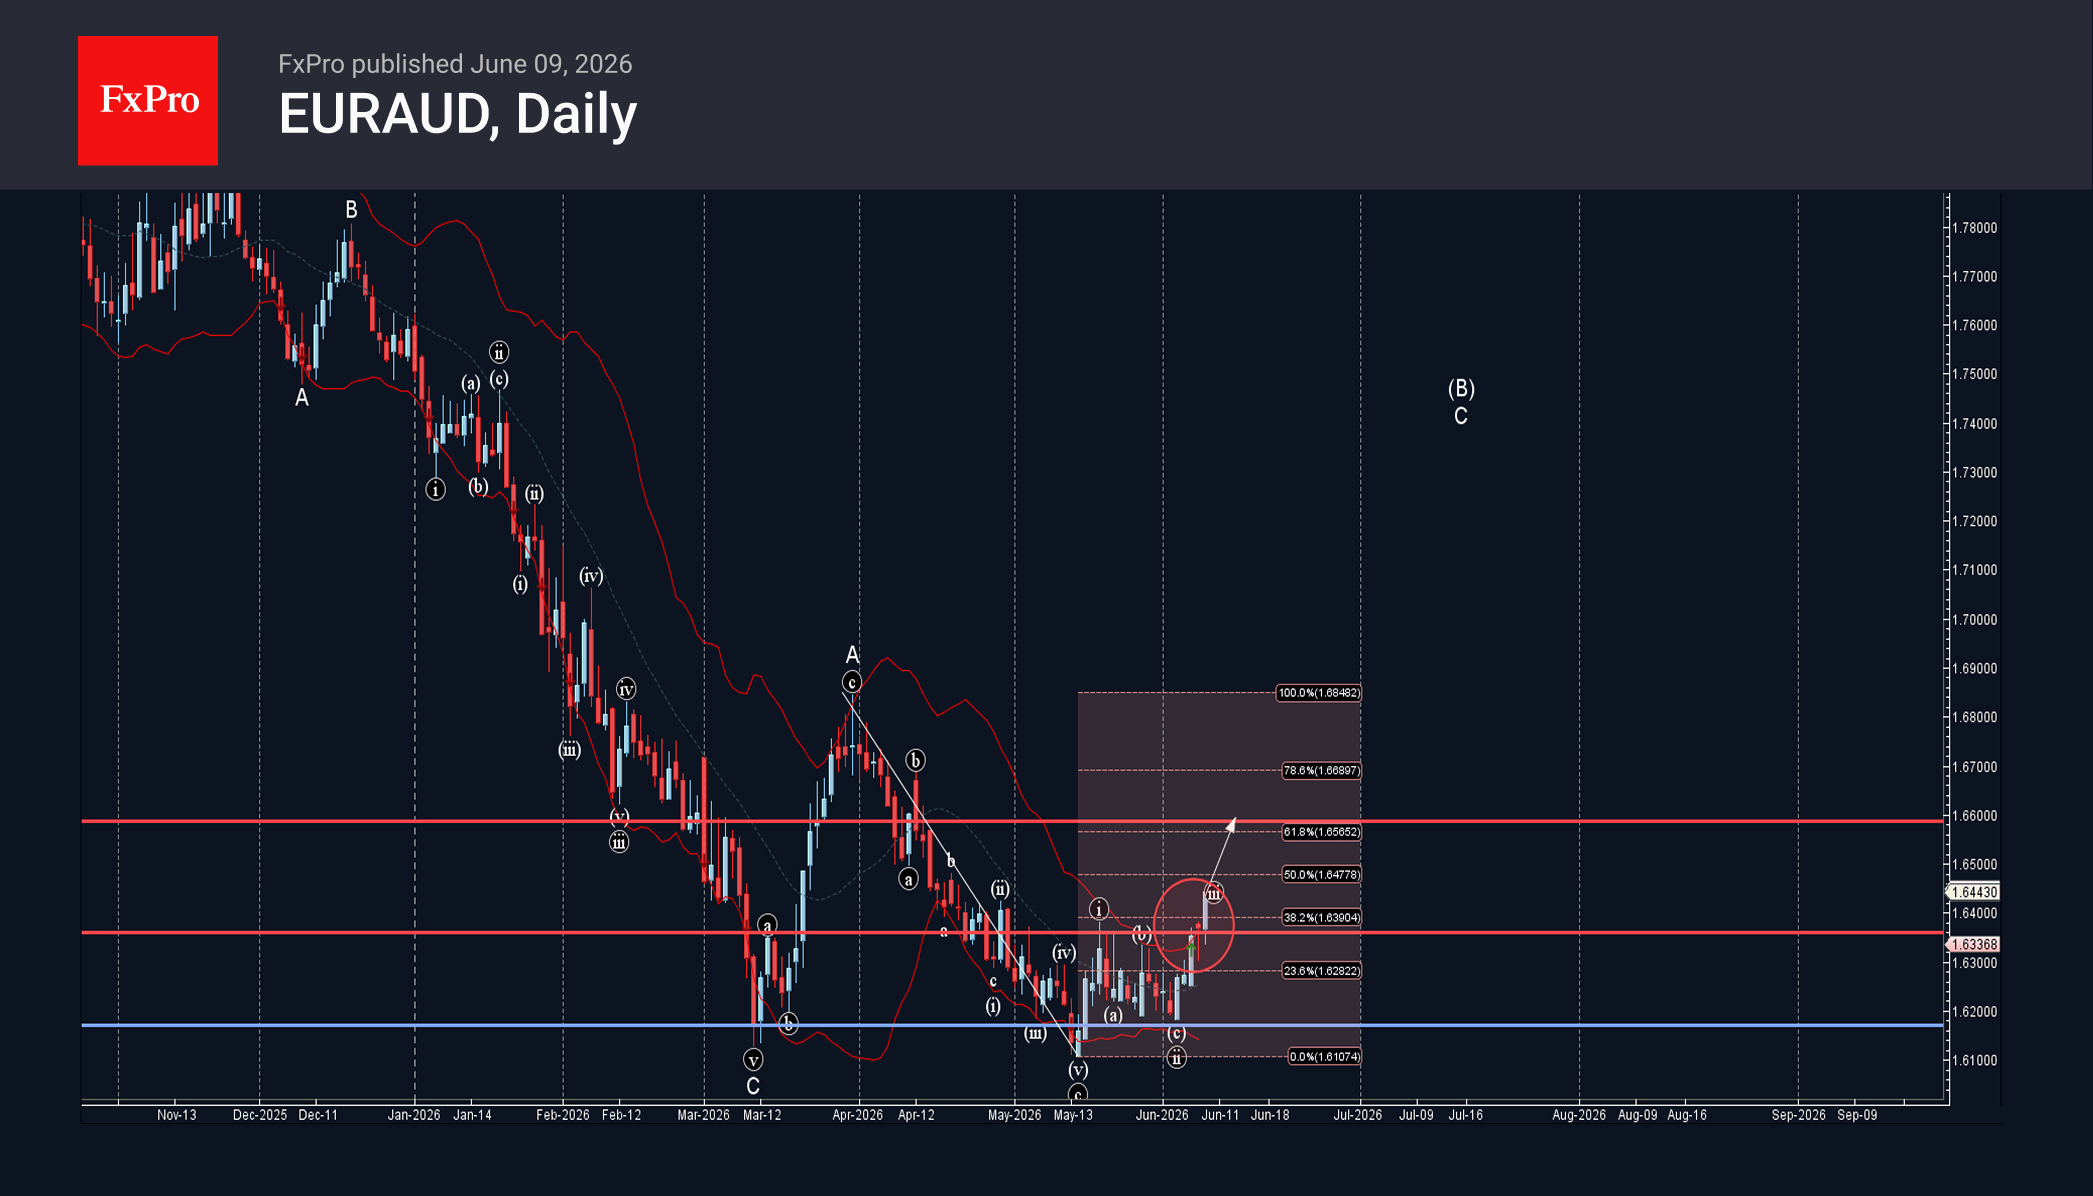
EURAUD: ⬆️ Buy
– EURAUD broke resistance zone
– Likely to rise to resistance level 1.6600
EURAUD currency pair recently broke the resistance zone between the resistance level 1.6360 (which has been reversing the price from the start of May) and the 38.2% Fibonacci correction of the downward impulse from May.
The breakout of this resistance zone accelerated the C-wave of the active ABC correction (B) from March.
Given the strongly bearish Australian dollar sentiment seen today, EURAUD currency pair can be expected to rise to the next resistance level 1.6600.
Eco Data 6/10/26
| GMT | Ccy | Events | Act | Cons | Prev | Rev |
|---|---|---|---|---|---|---|
| 23:50 | JPY | PPI Y/Y May | 6.30% | 5.50% | 4.90% | 5.30% |
| 01:30 | CNY | CPI Y/Y May | 1.20% | 1.30% | 1.20% | |
| 01:30 | CNY | PPI Y/Y May | 3.90% | 3.90% | 2.80% | |
| 12:30 | USD | CPI M/M May | 0.50% | 0.50% | 0.60% | |
| 12:30 | USD | CPI Y/Y May | 4.20% | 4.20% | 3.80% | |
| 12:30 | USD | CPI Core M/M May | 0.20% | 0.30% | 0.40% | |
| 12:30 | USD | CPI Core Y/Y May | 2.90% | 2.90% | 2.80% | |
| 13:45 | CAD | BoC Interest Rate Decision | 2.25% | 2.25% | 2.25% | |
| 14:30 | CAD | BoC Press Conference | ||||
| 14:30 | USD | Crude Oil Inventories (Jun 5) | -7.2M | -3.0M | -8.0M |
| 23:50 | JPY |
| PPI Y/Y May | |
| Actual | 6.30% |
| Consensus | 5.50% |
| Previous | 4.90% |
| Revised | 5.30% |
| 01:30 | CNY |
| CPI Y/Y May | |
| Actual | 1.20% |
| Consensus | 1.30% |
| Previous | 1.20% |
| 01:30 | CNY |
| PPI Y/Y May | |
| Actual | 3.90% |
| Consensus | 3.90% |
| Previous | 2.80% |
| 12:30 | USD |
| CPI M/M May | |
| Actual | 0.50% |
| Consensus | 0.50% |
| Previous | 0.60% |
| 12:30 | USD |
| CPI Y/Y May | |
| Actual | 4.20% |
| Consensus | 4.20% |
| Previous | 3.80% |
| 12:30 | USD |
| CPI Core M/M May | |
| Actual | 0.20% |
| Consensus | 0.30% |
| Previous | 0.40% |
| 12:30 | USD |
| CPI Core Y/Y May | |
| Actual | 2.90% |
| Consensus | 2.90% |
| Previous | 2.80% |
| 13:45 | CAD |
| BoC Interest Rate Decision | |
| Actual | 2.25% |
| Consensus | 2.25% |
| Previous | 2.25% |
| 14:30 | CAD |
| BoC Press Conference | |
| Actual | |
| Consensus | |
| Previous | |
| 14:30 | USD |
| Crude Oil Inventories (Jun 5) | |
| Actual | -7.2M |
| Consensus | -3.0M |
| Previous | -8.0M |
Sunset Market Commentary
Markets
Markets today experienced some kind of an ‘interim session’ with few high profile data and no ‘new news’ on the conflict in the Middle East. US President Trump repeated that they are in the ‘final throes of what will be a very, very good deal’ and that this might become concrete in the next days. However, markets for now understandably take a wait-and-see modus, with technical trading dominating today’s price action. Both ADP private payrolls (avg weekly change over the 4 weeks to 23 May at 29k) and US trade balance data (trade deficit at $55.9 bln; with a modest rise for both imports and exports) didn’t bring any market moving news. US NFIB small business confidence eroded further (95.3 from 95.9, the weakest level since September 2024). US yields are easing 2-3 bps across the curve. Oil returning near recent lows (Brent at $92) might be a small supportive factor for US bonds. However, tomorrow’s US May CPI data (expected at 0.5% M/M and 4.2% headline and 0.3% M/ and 2.9% for core) probably might be the more important factor to guide the short-term momentum on US interest rate markets. In similar technical trading, German yields show a similar pattern (2-y -3 bps; 30-y -0.5 bps). A 25 bps rate hike at Thursday’s ECB meeting is fully discounted. In the current environment, one can expect the ECB to remain cautious on giving any guidance on (the pace of) further steps. Even so, markets will be keen to hear any hints/assessment on the bank’s reaction function regarding back to back hikes if necessary. Equity markets today entered calmer waters with the EuroStoxx 50 regaining 1%. US indices, including the Nasdaq also again opened in green. Even so, the likes of the Nasdaq (+1%) and the S&P 500 (today +0,8%) still have some way to go to erase recent ‘losses/correction’. In this respect, we also keep a close eye at the reaction of equity markets in case of elevated/higher than expected US inflation data. On FX, the dollar continues to make a step backward after testing/nearing some first resistance levels. For the DXY TW index the 100.21/64 area (yesterday’s top/YTD top) for now looks one step too far/high. EUR/USD also shows resilience return to the 1.1575 area after yesterday’s test of the 1.15 area. However, also here we stay cautious ahead of tomorrow’s US CPI data. USD/JPY is still paralyzed near 160. Given day’s relative global USD softness, this isn’t a convincing sign for the yen.
News & Views
Sub-par Hungarian inflation paved the way for a near-term (potentially June) rate cut by the central bank. Headline prices stagnated on a monthly basis in May, allowing the annual figure to decelerate from 2.1 to 1.8%. That’s defying expectations for a quickening to 2.2% and below the lower bound of the Hungarian central bank’s 3% +/-1 ppt tolerance band. Core inflation fell by -0.02% m/m and to 1.94% y/y. Among the categories mentioned by the Hungarian central statistical office, food prices dropped by 0.3% m/m. Electricity, gas and other fuel prices also fell, by 0.8%. That offset service prices rising by 0.2% and clothing and footwear by 0.8%. Hungarian money markets had been pricing in rate cuts by the central bank for some time now amid a series of below-consensus CPI prints. Hungarian swap yields nevertheless slip around 10 bps across the curve. The forint implicitly approves such a central bank move by staying resilient over the last couple of weeks. EUR/HUF is currently trading around 355.3, among the HUF-strongest levels in more than four years.
The Japanese newspaper Nikkei reported that the Bank of Japan at its June meeting will discuss halting its quarterly reductions to its bond-buying program from fiscal 2027 (starting in April) onward. Sources told media outlet something similar, though added that the decision would be a split one between those that want to focus on soothing investor nerves and others that find it necessary to continue the taper process to reduce the BoJ’s large balance sheet. The BoJ has been reducing its bond holdings since 2024 under governor Ueda and is trimming the monthly buying pace by JPY 200bn each quarter. The current buying pace of JPY 2.1tn already allows for a natural run-off (some JPY 50tn per year) because of the sheer amount of bonds maturing from the bloated portfolio. The sources say this offers the BoJ a window for a taper pause, adding that the central bank could keep the current buying pace open-ended. Apart from the balance sheet debate, it’s all but certain that the BoJ will hike its policy rate to 1% next week. Markets price in another move by year-end.
US: Small Business Optimism Eases in May as Price Pressures Trek Higher
The NFIB's Small Business Optimism Index fell 0.6 points to 95.3 in May, disappointing market expectations for a modest uptick to 96.1. The Uncertainty Index rose 3 points to 91, remaining well above its historical average of 68.
Six out of the ten index subcomponents deteriorated on the month, three improved and one remained unchanged. Large pullbacks were recorded among the labor market components, followed by more muted declines in expectations for higher real sales (-2 points to 1%) and the belief that current inventory levels are too low (-2 points to -4%). Earnings trends improved (+4 points to -15%), as did plans to increase inventories (+3 points to 1%).
The net share of businesses planning to increase employment fell a steep 4 points to 9%, while the share of firms with unfilled job openings fell 5 points to 29%, with each indicator now at its lowest level since the start of the pandemic. Quality of labor concerns fell 5 points to 13% – the lowest level since 2016 – but concerns about the cost of labor moved up (+5 points to 14%). Inflation remained the top concern as it continued to edge higher (+2 points to 18% – a notable increase from 12% in February).
The net share of firms currently increasing employee compensation rose 1 point to 31%, while the net share planning to do so over the next three months was unchanged for the third month in a row at 18%. The share of businesses 'raising' average selling prices continued to push higher (+6 points to 36%), as did the share of those 'planning’ to raise average selling prices in the months ahead (+7 points to 34%).
Key Implications
Small business confidence edged lower in May and has now effectively erased nearly all of its gains since late-2024. A renewed buildup in price pressures appears to be a key factor behind the recent (albeit moderate) deterioration in sentiment. The standout in today’s report was the notable upturn in the share of firms both raising and planning to raise average selling prices. At the same time, concerns about inflation remained top of mind as they continued to edge higher – marking a clear departure from their February level before the start of the Middle East conflict.
Labor market indicators were another soft spot in today’s report. While the May payrolls report showed that hiring across the broader U.S. economy remains healthy, signals from the NFIB survey point to a potential slowdown in small business hiring over the near-term. Hiring plans and unfilled job openings both fell sharply, with each now sitting near levels last seen in 2016. At the same time, firms appear increasingly concerned about labor costs rather than labor quality, with the former overtaking the latter for the first time since 2013. Taken together, the report reinforces the view that small and medium-sized firms are likely to make smaller contributions to job growth in the months ahead.