
Sample Category Title
Crude Oil Trades Above $95 Ahead of Weekend Risk – WTI Technical Analysis
- WTI Oil hangs around $95 right ahead of a high risk weekend
- Contentious geopolitics are still influencing Oil prices with Strait of Hormuz blockades still having their effect
- Exploring an in-depth Technical Analysis of the commodity
The weekend is here, and energy markets are holding their breath.
WTI Crude is hovering uncomfortably around the $95 mark as the geopolitical standoff between Washington and Tehran remains incredibly tense.
While Iran has already sent a delegation to Islamabad, they are actively playing hardball and have yet to officially confirm that they will actually sit down and exchange terms with the US representatives.
Despite this diplomatic stalemate, the US is still sending two of its top diplomats to Pakistan with Steve Witkoff and Jared Kushner.
Market participants will be watching the wire like hawks, desperately wanting to see concrete progress toward a finalized peace deal this weekend to avoid a massive gap on Monday's open.
Odds for a Peace deal went down quite aggressively since last Friday, and that doesn't bode well for general Market sentiment.
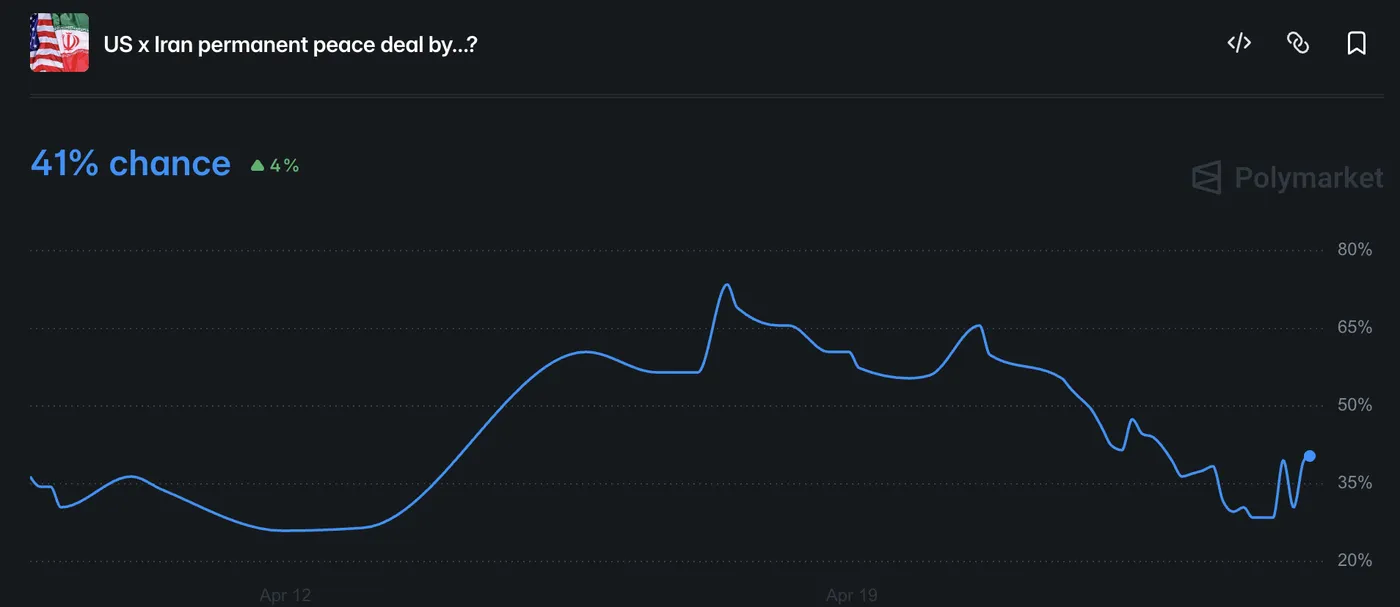
Odds for a Peace Deal by May 31 – Source: Polymarket. April 24, 2026
In the meantime, the Trump administration is still applying pressure on Iran to force a deal. The US Navy is maintaining a heavy maritime blockade on the Strait of Hormuz to completely prevent Iran from exploiting its geographic monopoly over the region.
The blockade is in full force and the US military has blocked 34 tankers coming from Iranian ports, severely tightening the economic chokehold on Tehran.
While global oil traffic is slowly redirecting toward North America—which is currently driving a still increasing $11 per barrel difference between WTI and Brent—global supply is still taking a severe hit.
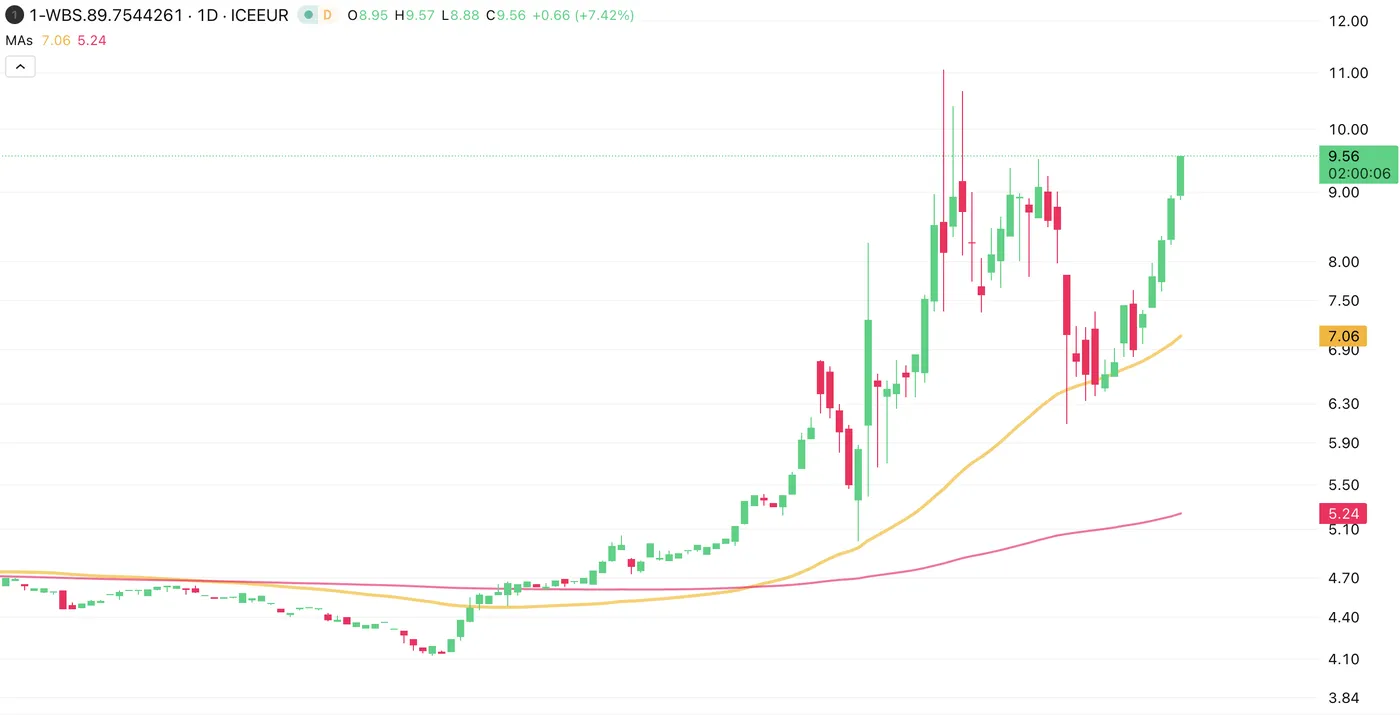
WTI-Brent Spread – April 24, 2026. Source: TradingView
With alternative pipelines still in the slow process of reopening, the International Energy Agency notes that the market is currently facing a still huge 13 million barrels per day drought compared to normal global flows.
While slightly better economic fundamentals originally helped cool the extreme war premium, it turns out that the overarching narrative remains heavily blurry.
Traders are still wondering exactly where to look, which is directly translating into a highly choppy and seesawing price action.
As the situation has little odds to get more clear ahead of the weekend, let's dive into a multi-timeframe analysis of WTI (US) Oil to determine levels of interest and put the odds in the trader's favor to capitalize on the issue.
US Oil Multi-Timeframe Analysis
WTI Daily Chart
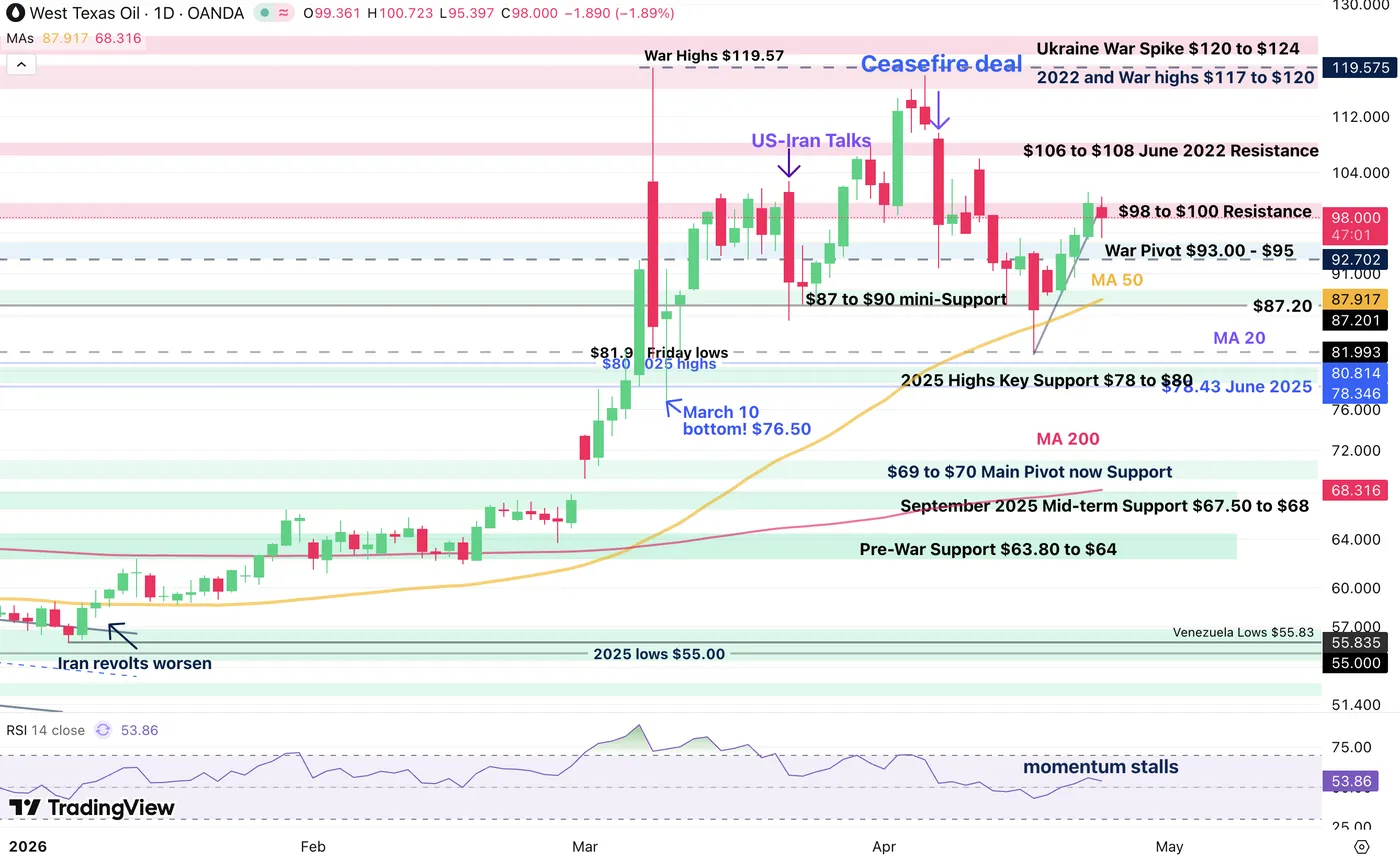
WTI Oil Daily Chart – April 24, 2026. Source: TradingView
After correcting to $83 lows just last Friday, sellers just couldn't maintain the high pressure fundamentals and this led to a 3-day bounce right back below the $100 level.
As long as prices don't exceed that threshold, Markets should remain contained, but keep a close eye on that level as breaching it could lead to a large spike in volatility.
Let's take a closer look.
WTI 4H Chart and Technical Levels
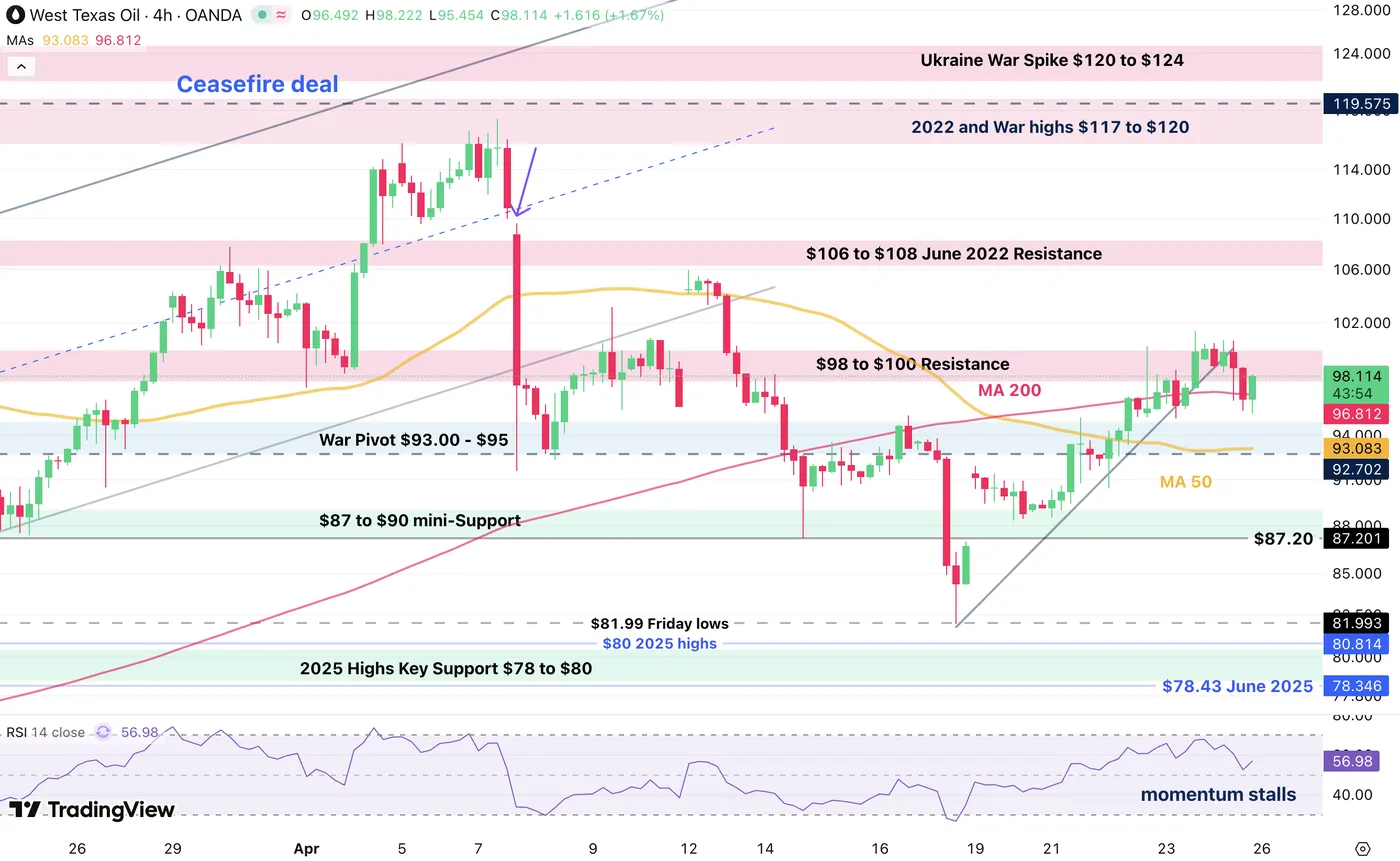
WTI Oil 4H Chart – April 24, 2026. Source: TradingView
While sellers reappeared at the $98 to $100 resistance, they could not extend the pressure below the 4H 200-period MA ($96.82).
The moving average is a key indicator to keep your eyes on to gauge intraday momentum in the commodity.
WTI Technical Levels:
Resistance Levels
- $98 to $100 Resistance (freshly rejected)
- $104 next-mini resistance
- $106 to $108 June 2022 Resistance
- 2022 and Monday highs $117 to $120 (larger channel top)
- Ukraine War Spike $120 to $124
Support Levels
- 4H 200-period MA $96.82
- War Support $93.00 - $95
- $87 to $90 mini-Support (recent bounce)
- $82.80 to $84 micro-Support
- 2025 Highs Key Support $78 to $80
- $69 to $70 Final War Support
1H Chart and action levels
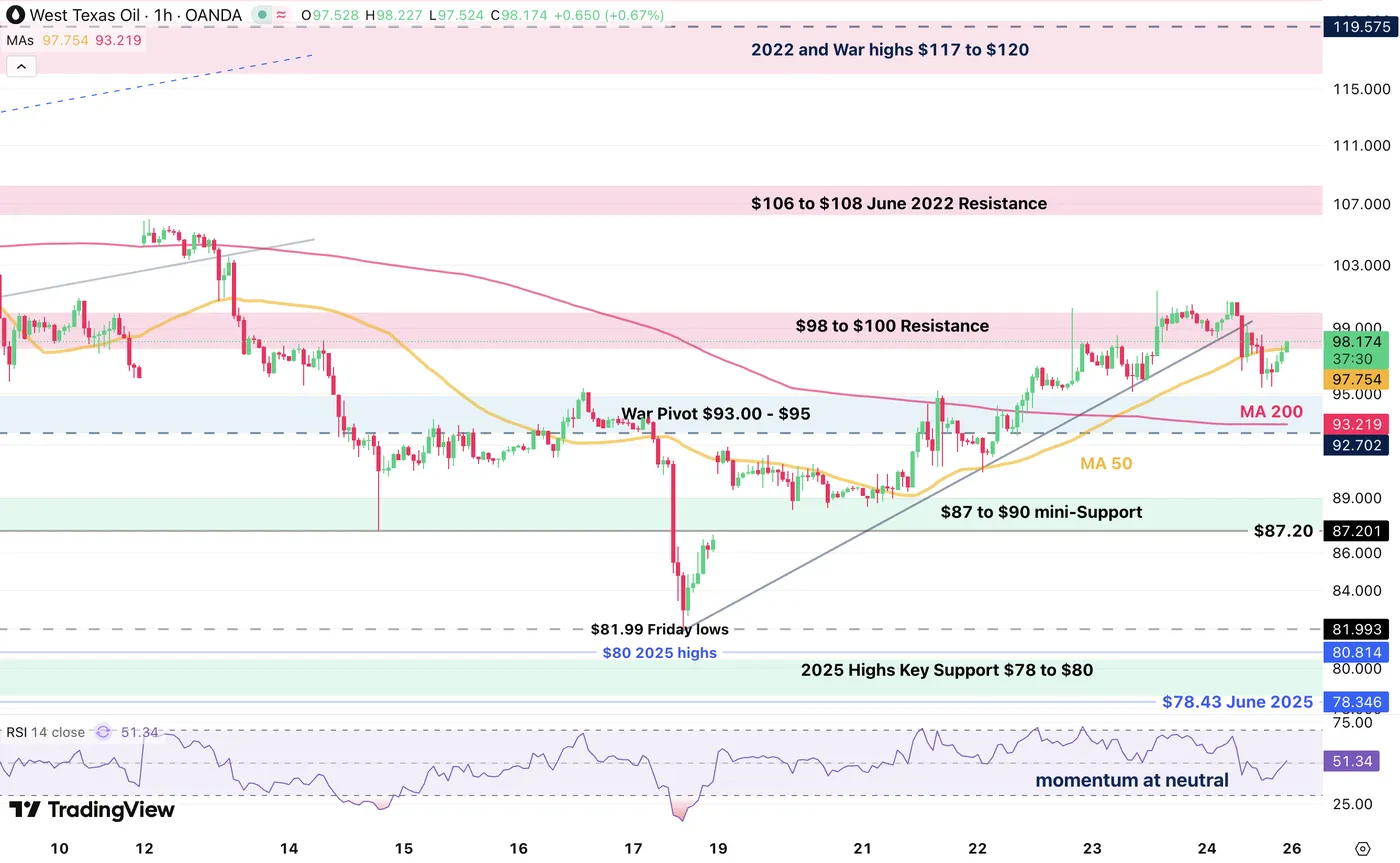
WTI Oil 1H Chart – April 24, 2026. Source: TradingView
While pre-weekend action brought bullish pressure to the upside, having broken the weekly upward trendline hints at a more balanced action ahead.
Breaking $100 should see follow through all the way to $104, and the next step is at $106.
On the other hand, rejecting below $97 marks higher chances of a $93 retest.
Expect high-volatility gaps on Monday's session – Trading these could require savvy stop-orders. With heavy binary risk, make sure to keep your size under control.
Safe Trades and an enjoyable weekend!
The Weekly Bottom Line: Well Behaved Core Inflation Strengthens BoC Hold Case
Canadian Highlights
- March CPI came in a touch softer than expected, with headline inflation jumping to 2.4% on higher gasoline prices but shorter-term core measures are still, on average, running below 2%.
- The first quarter BoC Business Outlook Survey signaled improving pre-war sentiment, but noted rising input costs and some upward drift in inflation expectations since the onset of the conflict.
- With war-related uncertainty elevated and inflation expectations a key area of focus, the BoC is likely to remain on hold next week while reiterating its commitment to keeping expectations well anchored.
U.S. Highlights
- Iran signaled a reopening of the Strait of Hormuz amid a fragile ceasefire, easing oil prices and lifting markets, though evidence of a full normalization in shipping remained limited.
- Retail sales rose sharply in March, boosted by higher gasoline prices but also supported by solid underlying volumes, pointing to continued consumer resilience.
- Business surveys showed activity stabilizing even as war-related supply disruptions pushed price pressures higher, complicating the policy outlook.
Canada – Well Behaved Core Inflation Strengthens BoC Hold Case
The fluid Middle East situation continued to drive Canadian financial markets. Oil prices remain volatile, with WTI up this week amid limited progress on diplomatic efforts between Iran and the U.S. Canadian bond yields also edged higher (as of writing), with Middle East tensions keeping inflation risks in focus. Since the onset of the war, the 10-year bond yield is up about 35 bps.
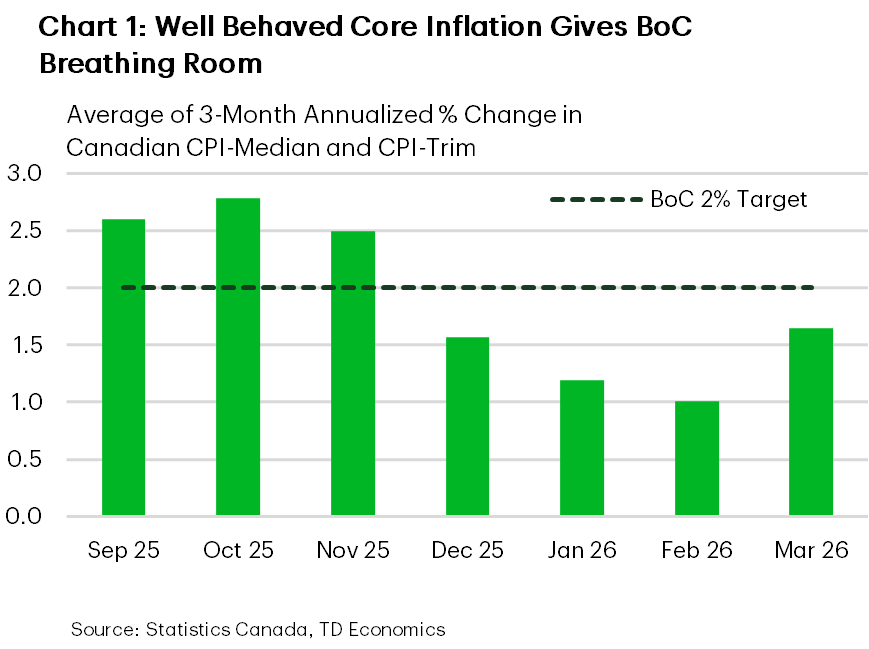
This week’s data offered a largely pre-war read on momentum and an early look at inflation spillovers. Retail sales rose in February and Statistics Canada’s flash estimate points to another gain in March. For the Bank of Canada, though, March CPI was the focal point. Headline inflation rose 0.6 ppts to 2.4%, driven by the recent jump in gasoline prices, but the details were modestly softer than expected. For instance, shorter-term core metrics firmed on the month, but remained below 2%, on average (Chart 1). Gasoline prices have been more contained through April, while the federal government has temporarily removed the excise tax on fuels. Still, year-over-year inflation should get a mechanical lift from base effects tied to the April 2025 carbon-tax cut.
The Bank of Canada’s Q1 Business Outlook Survey (BoS) was conducted largely before the war, with only a smaller share of responses collected afterward. Pre-war results showed sentiment improving as firms are adjusting to U.S.–Canada trade frictions. In the background, the CUSMA review is now underway. U.S. and Canadian officials flagged several irritants this week - including U.S. tariffs on Canadian aluminum/steel/autos/lumber and provincial restrictions on U.S. alcohol sales - that will shape negotiations. Multiple parties also suggested the original July 1 deadline is unlikely to be met.
Firms surveyed post-war in the BoS reported only modest impacts on activity measures so far, but flagged rising input costs. The ability of firms to pass through higher costs was mixed, constrained by lackluster demand and increased competition.
Next week brings the release of the federal government’s Spring Economic Update. Last November’s budget pegged the FY 2026/27 deficit at a lofty 2.0% of GDP. This shortfall would also be at the higher end compared to provincial expectations this budget season. However, this year’s outlook for nominal GDP (which drives government revenues) will likely be revised up relative to last November. The update may also be light on substantial net new measures, as several had already been announced, like the grocery rebate top-up.
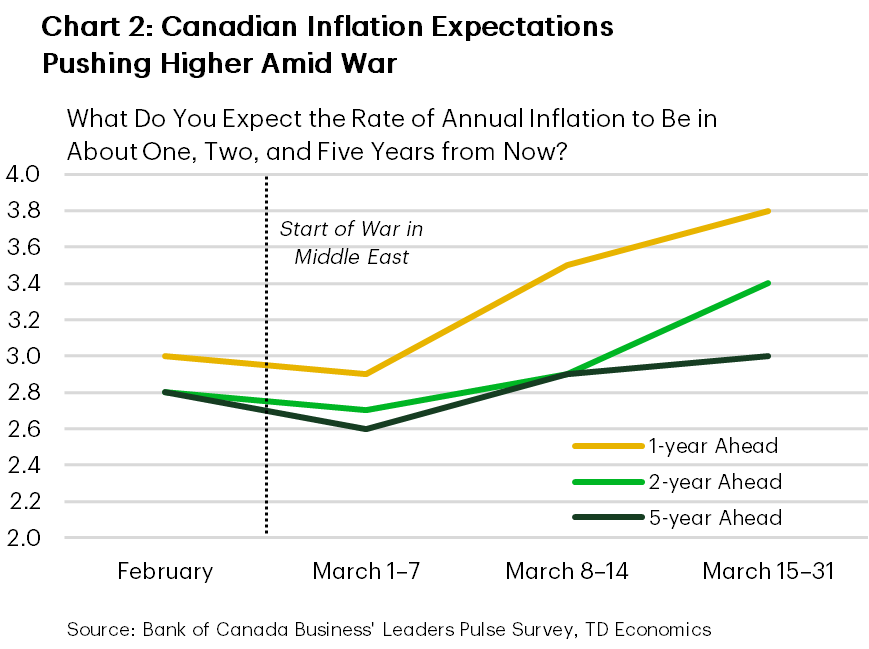
Attention turns to the Bank of Canada’s rate decision next week. The Bank is widely expected to stay on hold - our call as well. With the economic fallout from the war still highly uncertain, it would be premature to pivot from a hold, particularly with core inflation still well behaved. That said, the BoS points to some upward drift in shorter-term inflation expectations, though long-term measures remain well anchored (Chart 2). Expect the Bank to stress its willingness to act as needed to keep expectations anchored.
U.S. – Markets Jitter, Prices Bite
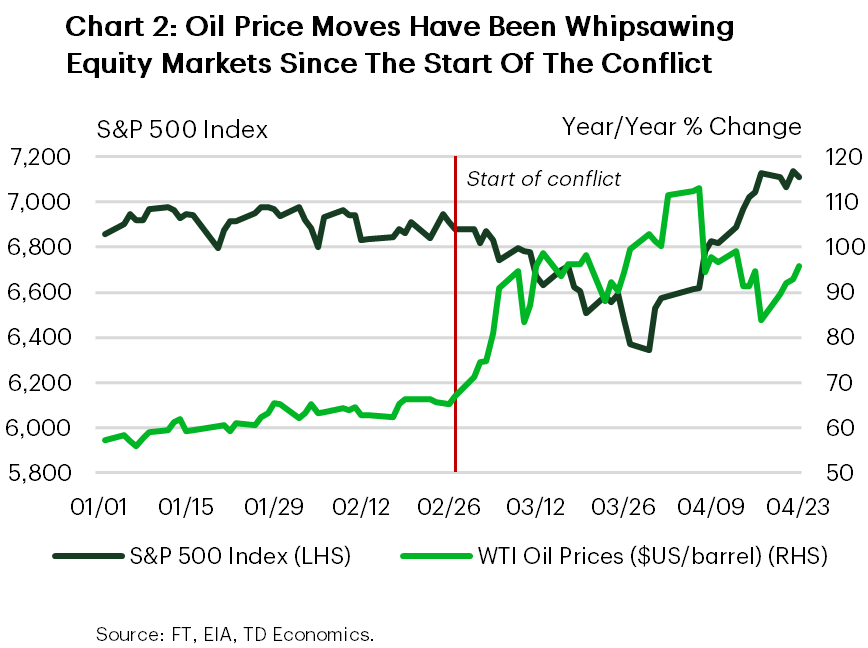
As the Iran conflict approaches the two month mark, financial markets remained highly sensitive to signals around energy supply risks. Early in the week, Iran announced that the Strait of Hormuz would be reopened to commercial shipping vessels during a newly brokered ceasefire, triggering a sharp pullback in oil prices and a relief rally in risk assets. WTI crude fell into the low $80s per barrel range, while U.S. equities moved to new highs as immediate worst case supply scenarios were priced out (Chart 1). That said, reporting around actual shipping flows suggested that conditions on the ground were uneven. As a result, while near term fears eased, geopolitical risks remain elevated and sentiment fragile, leaving markets vulnerable to renewed volatility should tensions re escalate.
U.S. economic data this week offered a reminder that domestic momentum has not yet broken down. Retail and food services sales rose 1.7% in March, driven largely by a surge in gasoline prices, but importantly, real (inflation adjusted) spending also increased a solid 0.8%. Core retail sales excluding gasoline, autos, and building materials posted broad-based gains, suggesting that households have not yet pulled back meaningfully on goods consumption. One area of softness was spending at restaurants, which was little changed on the month, highlighting some emerging price sensitivity among consumers.
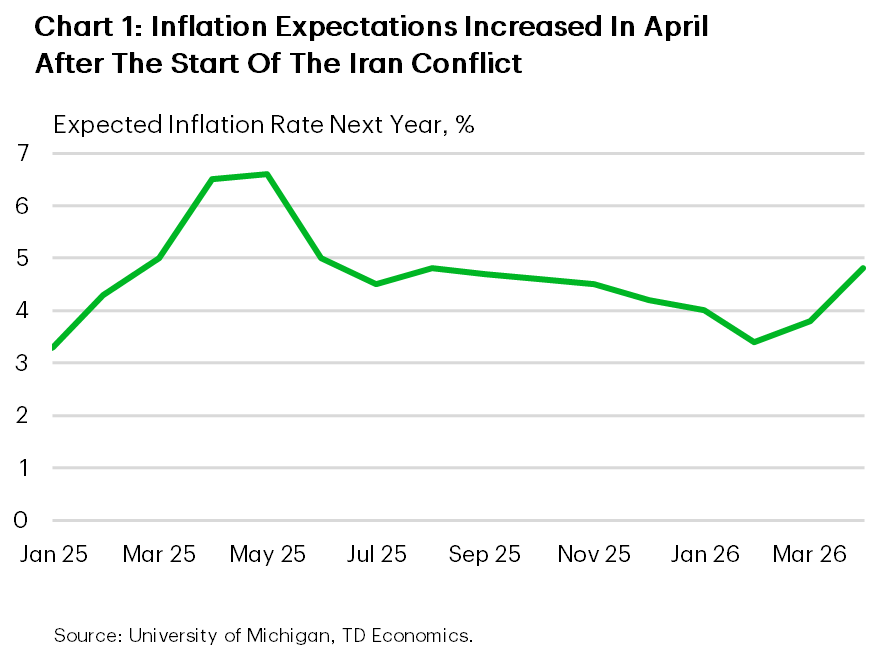
Forward-looking indicators painted a more mixed picture. The latest U.S. PMI readings showed business activity recovering modestly in April after stalling in March, with manufacturing rebounding more strongly than services. However, the rebound was accompanied by worsening delivery times and a sharp increase in input and output prices, reflecting ongoing supply disruptions tied to the conflict. Firms reported precautionary stock building and rising costs, reinforcing concerns that inflation pressures could re-intensify. The University of Michigan survey released today showed inflation expectations over the next year rising sharply, a key indicator energy-driven price worries are becoming more entrenched (Chart 2).
Markets are also increasingly focused on the Federal Reserve policy backdrop. Kevin Warsh’s confirmation hearing this week underscored uncertainty around the future policy framework, with investors parsing how shifts in leadership could influence the Fed’s reaction function at a time when inflation and growth risks are pulling in opposite directions. While Warsh’s confirmation by the Senate Banking Committee was uncertain amid the ongoing DOJ investigation of Chair Powell, headlines on Friday morning suggested the charges had been dropped. This clears a path for Warsh’s confirmation, which means next week’s interest rate announcement will likely be Jerome Powell’s last as chair. Looking ahead, next week’s data calendar is heavy, with personal income and PCE inflation, first quarter GDP, and ISM surveys all due. Together, these releases will help determine whether the economy is slowing enough to offset renewed price pressures.
Bank of Canada Expected to Keep Rates Unchanged as GDP Tracks Modest Growth
The focus will be on the Bank of Canada’s decision on interest rates on Wednesday amid rising consumer prices, followed February’s gross domestic product print on Thursday.
We expect the BoC will hold interest rates unchanged for a fourth consecutive meeting, but policymakers will be watching the impact of higher energy prices on inflation closely. Headline CPI growth looks likely to rise above the 1% to 3% inflation target range in April for the first time since December 2023.
But there is nothing that BoC interest rate policy can do to influence the global price of oil. And lags in the impact of interest rates on the economy mean the central bank needs to set monetary policy based on where inflation will be in the future, not just where it is today.
We expect the BoC will be cautious about adding to near-term affordability challenges created by a supply-driven surge in fuel costs as long as inflation expectations and broader inflation pressures (outside of energy price increases) remain contained.
Inflation expectations did edge higher in the BoC’s Business Outlook Survey, but further signs of easing in “core” measures in March should leave the central bank flexibility to focus on incoming data against its recent projections.
Q1 GDP growth is tracking broadly in line with the Bank’s January forecast with recent data pointing to a modest pickup in momentum following a softer start to the year. Labour market conditions have also shown signs of stabilization, but with the unemployment rate still at levels that wouldn’t imply underlying inflation pressures building.
This combination suggests limited urgency for further policy adjustment in the near term. Our base case forecast assumes rates remain on hold through 2026 with gradual increases beginning in 2027 as the economy continues to normalize.
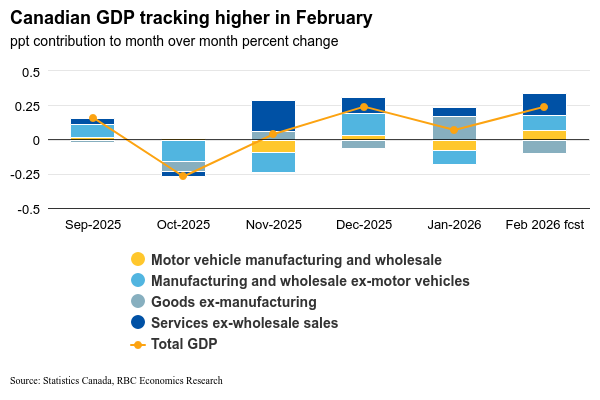
Growth in goods and services to hold up GDP
We expect real GDP to increase by 0.2% in February in line with Statistics Canada’s advance estimate. Industry data points to continued growth in goods and services sectors with manufacturing and wholesales recovering as earlier auto production disruptions faded. Retail volume also continued to increase in the month (+0.3%), highlighting ongoing resilience in consumer spending.
Partially offsetting these gains is non-conventional oil and gas extraction in Alberta that appears to have pulled back in February. Housing-related activity also remained a drag with home resales continuing to decline, albeit at a slower pace.
Early indicators for March suggest growth momentum has been maintained into the end of Q1. Hours worked edged higher by 0.2%, alongside other signs of steady economic activity. Advance manufacturing sales rose 3.5% in March—in part reflecting higher petroleum prices, but also consistent with further recovery in auto production from earlier disruptions. Excluding petroleum and related products, advance wholesale sales also rose 1.3%, driven by higher machinery, equipment, and supplies sales
Taken together, data for Q1 are tracking between our forecast of 1.3% annualized growth and the BoC’s January projection of 1.8%.
U.S. Fed also seen on hold
The U.S. Fed will also be watching the impact of the conflict in the Middle East on inflation closely but is expected to leave interest rates unchanged for now. Higher oil prices are putting pressure on both ends of the Fed’s mandate – higher gasoline prices are cutting into household purchasing power (threatening to slow consumer spending, with negative implications for labour markets) but also pushing headline inflation higher. And broader core inflation measures in the United States remain elevated with the core PCE deflator expected to rise to 3.2% year-over-year in March. We continue to expect the central bank to hold interest rates at current levels through the end of this year.
- We expect U.S. GDP rose 1.3% (annualized rate) in Q1 following a 0.5% increase in Q4. Consumer spending growth appears to have slowed from 1.9% in Q4, but government spending likely rebounded following a drop in Q4 due to a federal government shutdown, and business investment likely continued to rise.
- We expect a 0.6% increase in March personal spending, but with much of the gain reflecting increased prices (surge in gasoline prices due to conflict in the middle east.) We look for real consumer spending to edge up 0.2%. Both headline and core PCE price deflator growth is expected to tick higher on a year-over-year basis in March.
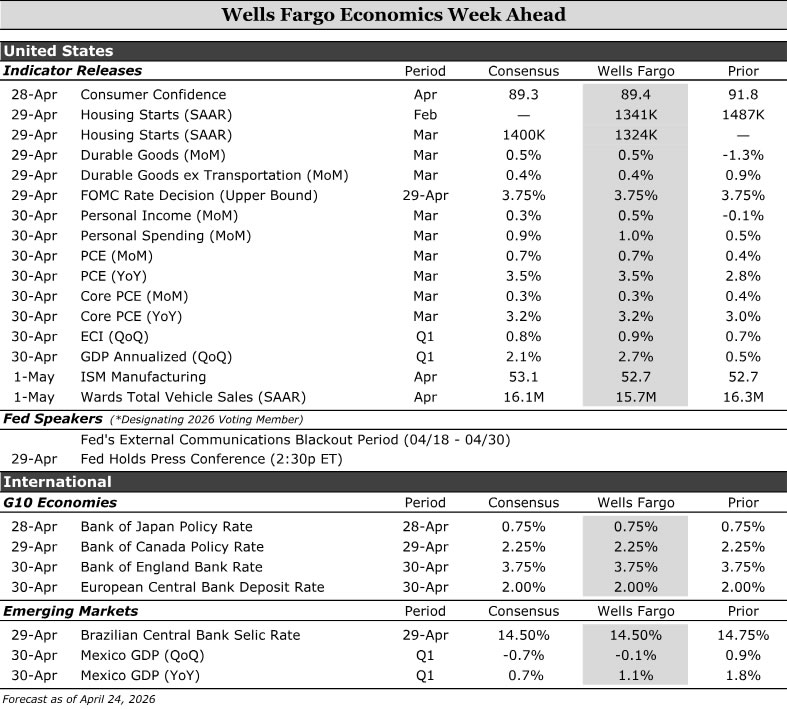
Economics Week Ahead
United States:
- FOMC (Wednesday), Personal Income & Spending (Thursday)
G10 Economies:
- Bank of Japan (Tuesday), Bank of Canada (Wednesday), Bank of England (Thursday), European Central Bank (Thursday)
Emerging Markets:
- Brazilian Central Bank (Wednesday), Mexico GDP (Thursday)
U.S. Week Ahead
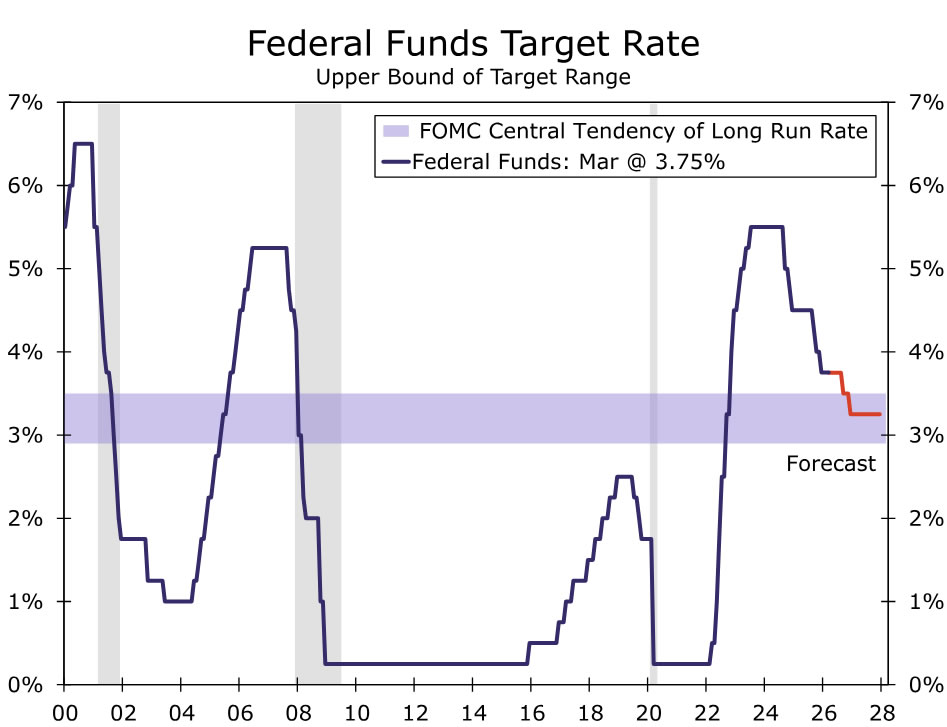
FOMC • Wednesday
The Fed's dual mandate remains in tension. Recent data point to PCE inflation remaining stuck around 3%, with the energy shock from the conflict in the Middle East expected to strengthen headline inflation in the near term. Meanwhile, the labor market continues to lose momentum. First‑quarter job growth was distorted by strikes and volatile weather, and we expect hiring to slow further in coming months as renewed geopolitical uncertainty restrains labor demand. Against this backdrop, we expect the Fed to remain patient and hold the federal funds target rate steady at next week’s meeting.
The Committee is likely to emphasize optionality in its statement. We expect it to note that higher energy costs are keeping inflation elevated and to soften forward guidance, replacing language around “the extent and timing of additional adjustments” with more open‑ended phrasing that references “future adjustments” to the policy rate.
Chair Powell is also likely to stress in his press conference that policy is well positioned to await further data. We expect him to highlight heightened uncertainty stemming from the Iran conflict and its implications for both sides of the dual mandate, while reiterating that the Committee is prepared to adjust policy as needed to balance these risks. Our forecast continues to call for two 25 bps rate cuts this year, in September and December.
Personal Income & Spending • Thursday
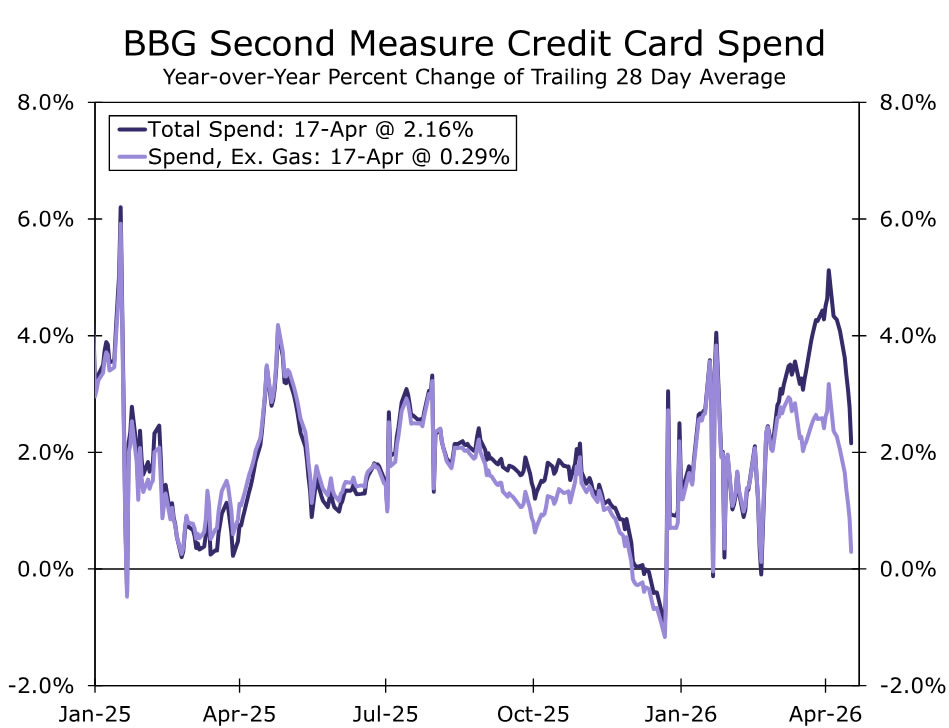
Consumer spending has remained broadly resilient in the immediate aftermath of the Iran conflict, though early signs suggest higher gas prices are beginning to weigh on demand. Higher energy costs will drive a 0.7% gain in the March PCE deflator, lifting nominal spending in the near term. On a real basis, we estimate consumption rose a more modest 0.3% last month. Core retail sales held up in March, and high‑frequency Bloomberg credit card data point to continued spending into early April. More recent estimates, however, suggest a pullback in spending outside of gasoline (chart).
That resilience is increasingly being sustained by offsets rather than improving fundamentals. We expect personal income rose just 0.5% in March, with elevated inflation eroding household purchasing power amid a cooling labor market. While households have so far absorbed higher fuel costs, the mid‑April slowdown in credit card spending may signal early trade‑down behavior. As we parse the broader March spending data, we will be watching closely for additional softening in discretionary categories. Overall, we expect spending to continue, but at a slower pace, as higher tax refunds and after‑tax income have largely offset—but not eliminated—the initial hit from higher prices.
G10 Week Ahead
Bank of Japan Policy Rate • Tuesday
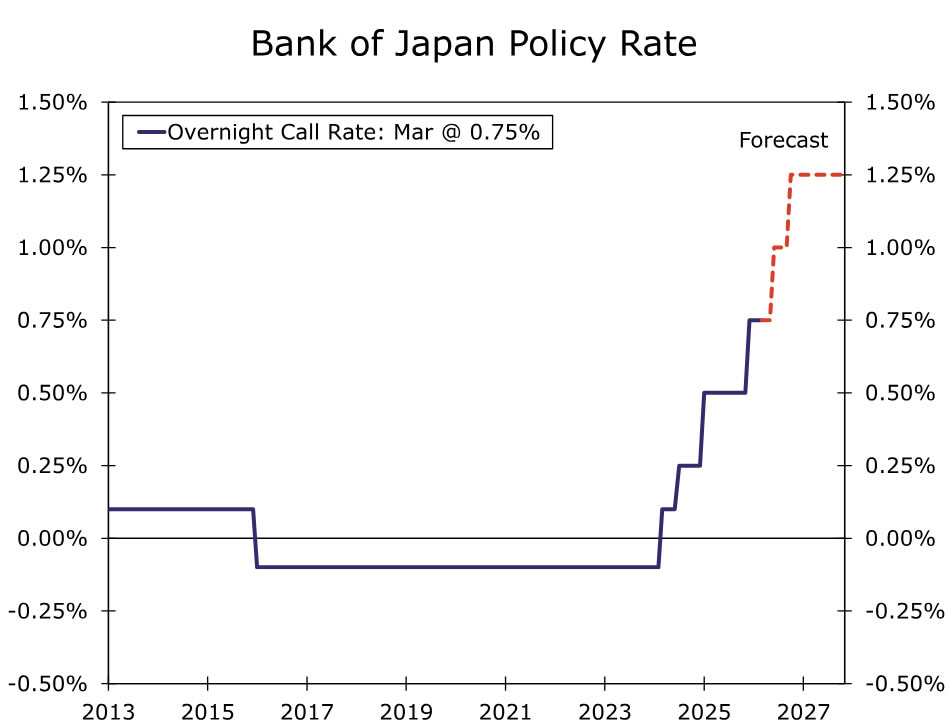
The Bank of Japan (BoJ) enters the April 27-28 meeting with a tightening bias intact, even as growth risks have risen. Headline CPI softness reflects energy subsidies and base effects, while underlying "core‑core" inflation remains above target and inflation expectations have firmed. Wage dynamics are the decisive input, with another year of 5%+ Shunto outcomes reinforcing the credibility of a wage‑price cycle. The macro tension is clear: growth momentum is increasingly fragile and exposed to the energy shock, but not weak enough to restrain policy on its own. As a result, although the April meeting is technically live, a hold with hawkish‑leaning guidance remains the cleanest outcome if policymakers prefer additional confirmation on oil prices, FX and financial conditions.
The policy direction rather than timing is the key signal, in our view. The BoJ’s revised reaction function explicitly tolerates weaker growth so long as inflation persistence and wage gains remain intact. Our base case remains for a Q2 hike (June), followed by at least one additional increase later in 2026, taking the policy rate to around 1.25% by year‑end. Even at that level, policy would remain only mildly restrictive relative to estimates of neutral. Risks to the outlook are skewed toward higher rates if yen weakness persists or energy prices remain elevated, while a durable de‑escalation in the Middle East represents the main downside risk to the tightening path.
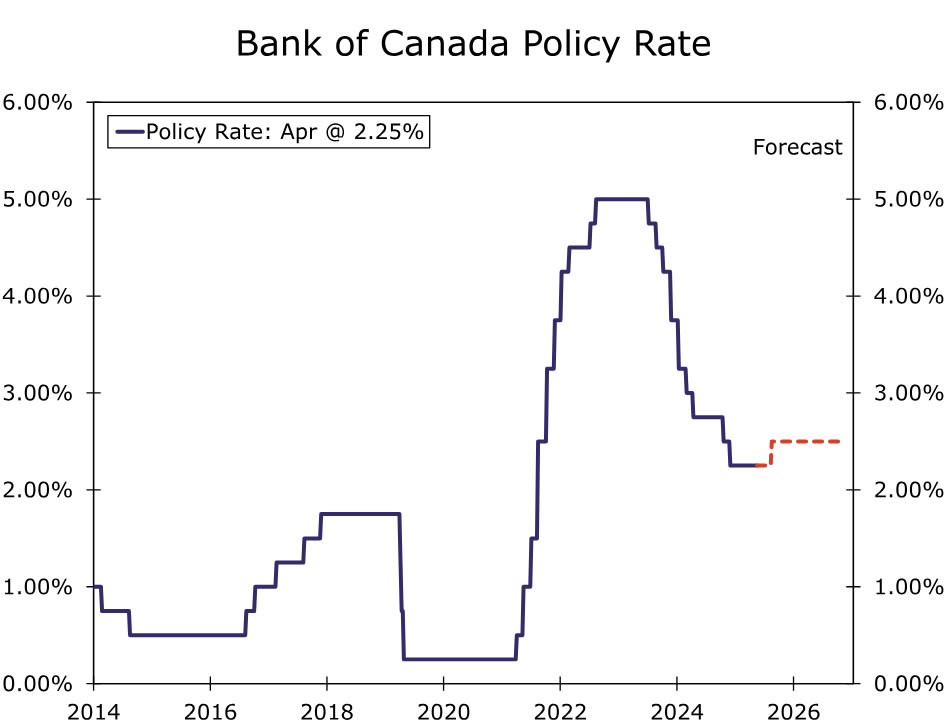
Bank of Canada Policy Rate • Wednesday
We expect the Bank of Canada (BoC) to hold rates at 2.25% in April, with the meeting serving as a reaction function update rather than a decision point. Growth remains soft but resilient, with labor markets stabilizing rather than deteriorating and higher energy prices improving the nominal growth mix despite ongoing trade and USMCA uncertainty. April communications should be less dovish, emphasizing two‑sided risks while making clear that the bar for renewed rate cuts has risen materially.
The dominant shift is on inflation, not growth. The energy shock has reintroduced risks around headline persistence and expectations, even as the Bank avoids overreacting to what may still be a relative price shock. Our baseline is for rates to remain on hold through mid‑year, with a 25 bps hike in July. By that time, the BoC would have received better data on how the shock is propagating through the economy, the passing of the USMCA July 1 deadline and another update to its Monetary Policy Report. We continue to believe that further rate hikes may be entertained in H2 if energy prices stay elevated for longer, inflation expectations firm and price pressures broaden.
Bank of England Bank Rate • Thursday
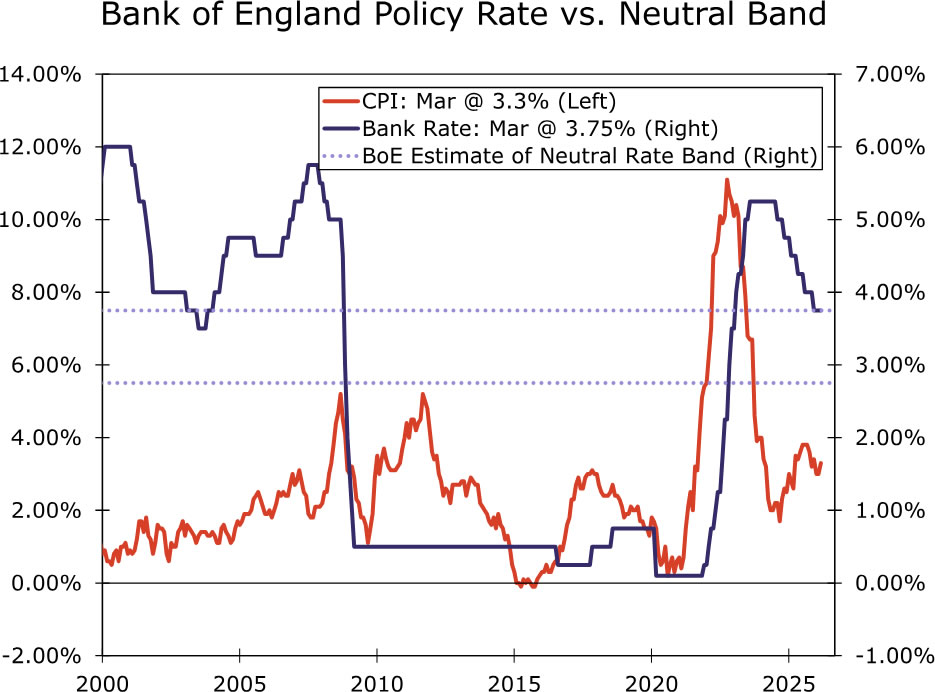
When Bank of England (BoE) policymakers meet next week, we expect that they will keep the Bank Rate on hold at 3.75%. The Monetary Policy Committee’s guidance is likely to continue emphasis on optionality and data dependence, particularly if second-round effects become more pronounced. We expect growth projections to be revised lower and near-term inflation forecasts higher as the energy supply shock reintroduces upside risks to headline persistence, with longer-horizon forecasts largely unchanged. It would take a notably sharp upgrade to the growth outlook or medium-term inflation forecasts well above the 2% target to shift our view toward a tightening cycle this year.
For now, the bar for a rate hike remains high. Wages are still soft, and while the unemployment rate surprised to the downside at 4.9% (vs 5.2%), the drop largely reflected lower participation rather than a meaningful pickup in employment. March inflation came in high but reflected the direct shock of higher fuel prices rather than anything out of the ordinary. And even though April PMIs surprised to the upside, anecdotal evidence suggests the stronger pace of expansion partly reflects a short-term boost from firms and households pulling purchases forward amid feared price rises and war-related supply shortages. This pace is unlikely to be sustained if price levels remain high. We therefore see the BoE on hold in 2026, particularly with the policy rate already restrictive and at the top of the bank’s estimated 2.75%-3.75% neutral range. That said, risks are skewed to the hikes, especially if services inflation continues to accelerate and feed through into wages.
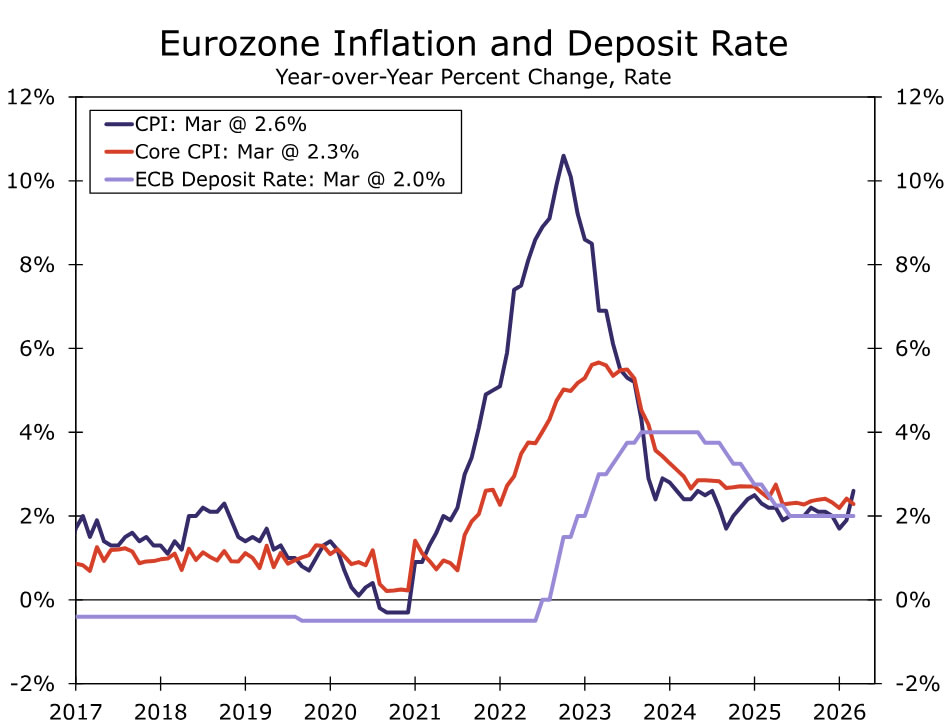
European Central Bank Deposit Rate • Thursday
The European Central Bank (ECB) is expected to hold rates at 2.00% at its meeting next week, but the policy debate has turned meaningfully more hawkish against a deteriorating macro mix. Euro area growth momentum has softened materially since the start of the year, with activity indicators now consistent with near stall speed and services increasingly bearing the brunt of the slowdown. At the same time, the energy shock linked to the Middle East conflict has reintroduced persistent inflation risks, with higher oil and gas prices pushing up headline inflation, tightening supply conditions and raising the risk of second round effects through services prices, wages and FX pass‑through. This has shifted the ECB’s characterization of the outlook toward a clearly stagflationary configuration, weaker growth but firmer and more uncertain inflation dynamics.
Against this backdrop, the ECB has moved away from any easing bias and is operating with a lower bar to tightening. March projections marked a clear regime change, with 2026 inflation revised sharply higher, core inflation expected to remain above target through the forecast horizon and policymakers explicitly emphasizing upside inflation asymmetry and credibility risks. While April is likely to be a holding and signaling meeting rather than a decision point, the tone should continue to validate that hikes are live as early as June. Our base case remains for two 25 bps rate hikes this year, beginning in Q2 and taking the deposit rate to 2.50% by end‑2026, with risks skewed toward earlier or additional tightening if energy prices stay elevated or inflation expectations show signs of drifting higher.
EM Week Ahead
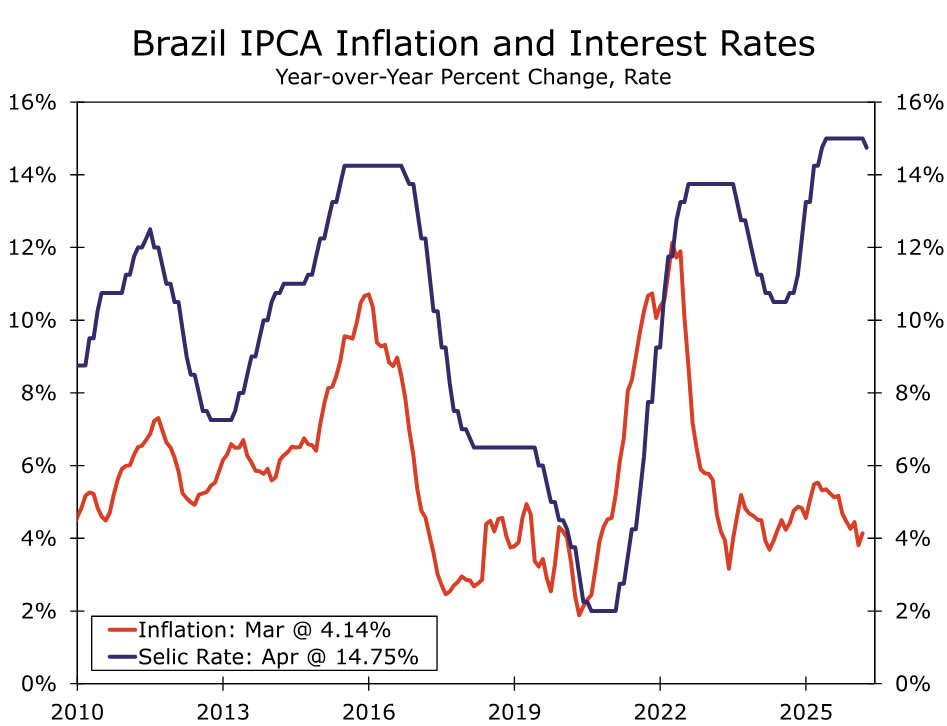
Brazilian Central Bank Selic Rate • Wednesday
The Banco Central do Brasil (BCB) is likely to cut the Selic by 25 bps next week to 14.50% under our baseline. A strong IPCA‑15 inflation print on Tuesday (Apr 28) could still keep the BCB on hold. Either way, the easing cycle has become shallower, more intermittent, and more data-dependent than it appeared back in February.
Our baseline remains for the BCB to deliver 25 bp cuts at each remaining meeting in 2026, bringing the policy rate to 13.25% by year‑end. That said, the risk is clearly skewed toward fewer cuts, as the BCB assesses elevated external and domestic inflation risks. June stands out as a likely pause point, giving policymakers time to evaluate fuel price pass‑through, indirect effects and the stability of inflation expectations. Political risk also rises into Q3, with the pre‑election cycle likely to weigh on expectations amid renewed populist pressures. As such, we see meaningful downside risk to the number of cuts delivered this year.
The macro backdrop argues for caution. March IPCA marked the first clear pass‑through from the energy shock, with fuel and food driving a broad‑based acceleration. Inflation expectations have de‑anchored further, with breakevens rising toward 6%. The inflation outlook for the remainder of 2026 remains highly dependent on the scale and duration of the supply shock. Our baseline has inflation rising to around 4.3% by year‑end, with upside risks as pressure broadens from energy into fertilizers and food. Government subsidies may dampen, but are unlikely to fully offset, pass‑through.
On activity, data have been resilient so far, with some support from higher net energy exports. However, the need to maintain elevated real rates to re‑anchor inflation expectations will continue to weigh on the growth outlook as the year progresses. On fiscal policy, fuel tax exemptions and subsidies add execution risk in an election year. While these measures are officially framed as fiscal neutral, their credibility depends heavily on oil prices and political discipline. Absent structural adjustment, ongoing expenditure pressures and political constraints imply persistent fiscal risk premia, which in turn limit the scope for sustained monetary easing.
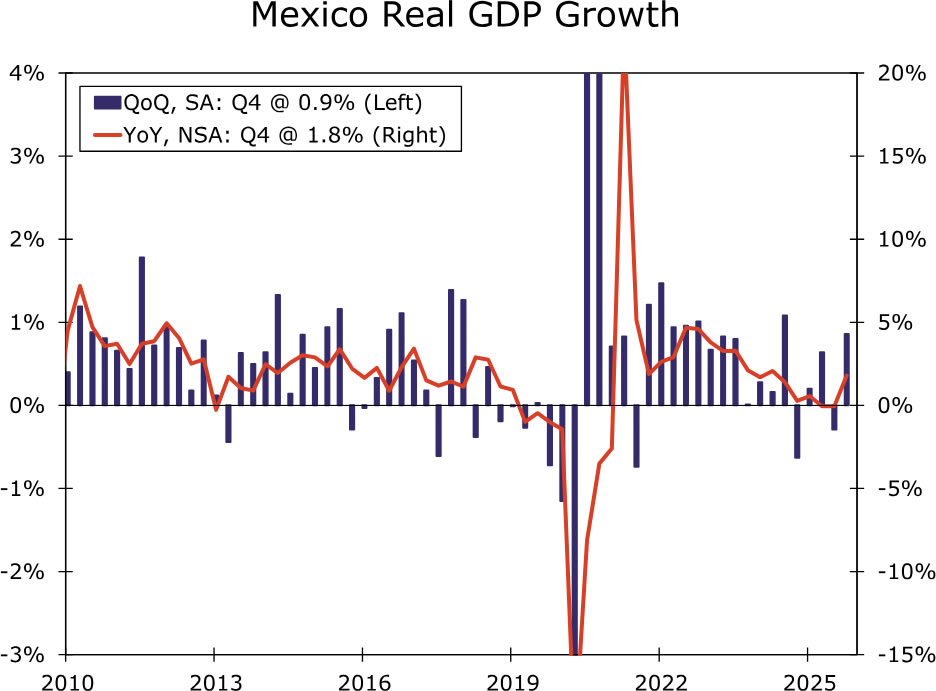
Mexico GDP • Thursday
We expect Mexico’s preliminary Q1 GDP reading to print -0.1% quarter-over-quarter from 0.9% in Q4, as early-2026 momentum fades across key domestic drivers. The year-over-year GDP is expected to decline to around 1.1% from 1.8% in Q4. After a strong January, private consumption lost steam in February, with retail sales contracting on the month and slowing sharply year-over-year, led by weakness in fuel, automobiles and food categories. We expect this softening in consumer demand to persist in March in light of energy price shocks. Although industrial activity rebounded on a month-over-month basis in February, it remains in a clear year-over-year contraction amid broad-based manufacturing weakness and elevated trade-related uncertainty. Investment continues to be a material drag, with gross fixed investment still contracting in both month-over-month and year-over-year, reflecting a fragile business climate, policy uncertainty and delayed capex amid USMCA renegotiation risks. Overall, Q1 growth looks below trend and materially weaker than late 2025, with downside risks if March data fail to stabilize. We continue to expect Banxico to remain dovish given the sluggish growth outlook and take advantage of the narrow window on inflation to cut the policy rate one last time in Q2.
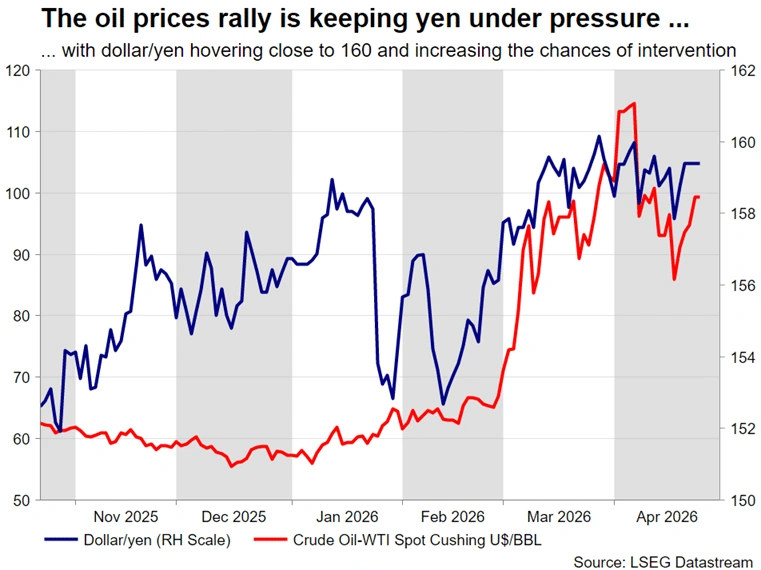
USDJPY Slows on Approach to 160 Zone as Japan’s Authorities Repeat Signals of Potential Intervention
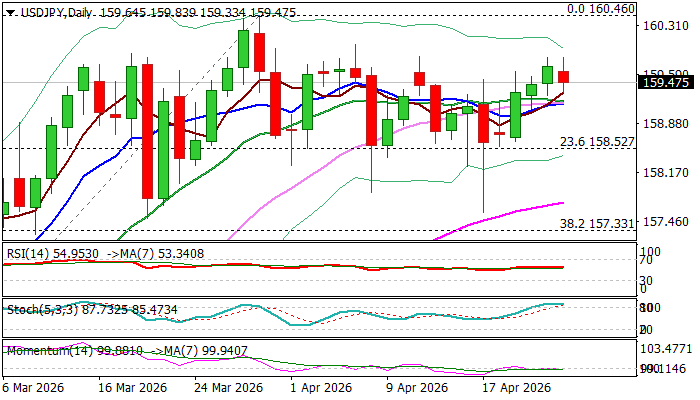
USDJPY keeps firm tone and trading near psychological 160 barrier, with near term action being slower on Friday, in comparison to strong gains in previous few sessions.
The pair is on track for the weekly gain after being held in red for the three consecutive weeks, with technical picture on daily and weekly chart being predominantly bullish but overbought on daily chart.
On the other hand, the pair is pressuring 160 resistance zone, often seen as a trigger for the intervention of Japanese authorities, to prevent further weakening of the national currency.
From that perspective we need to see the latest comments from Japan’s Fin Min, who warned of decisive action at 160 zone, which marks a verbal intervention and confirms Japan’s readiness to take an action.
The Bank of Japan policymakers will meet next Tuesday, with widely expected decision to stay on hold this time, mainly due to high uncertainty over the situation in the Middle East and yen’s trajectory.
Japanese policymakers also remain concerned about inflation driven by imports in situation on persistently weak yen, that adds to the view that Apr 28 meeting decision may not be neutral hold, with vote count to be in focus.
After March unanimous (9-0) vote, any divergence from this configuration would be a hawkish signal that the board is laying groundwork for rate hikes later this year.
Initial support lays at 159.18 (converged 10/20DMAs) followed by more significant 158.52 level (Fibo 23.6% of 152.26/160.46 rally / floor of the recent range) firm break of which to expose next strong supports at 157.60/30 zone (recent spike lows / Fibo 38.2%).
On the flip side, 160.00 and 160.46 (2026 high), offer solid resistances, guarding very strong 161.95 (2024 pre-intervention peak).
Res: 159.85; 160.00; 160.46; 161.00
Sup: 159.18; 158.00; 157.60; 156.30
Bank of England Preview – On Hold Amid Solid Macro Data
- We expect the Bank of England on hold on 30 April. We pencil in no rate changes for the coming 12 months but with risks tilted towards hikes.
- Data has come in mostly on the hawkish side since March as the economy has weathered the energy blow better than expected. Like consumer sentiment, it could still turn sour, though.
After the BoE's hawkish turn in March, investors quickly started to price in near-term hikes but from mid-March to mid-April much was priced out again not least because Governor Bailey has been quite clear that the BoE is in no rush. During the recent week, pricing has taken another turn on the back of deteriorating energy markets and macro data coming in mostly on the hawkish side.
Starting with the soft data, April consumer sentiment declined for a third consecutive month, suggesting solid retail sales growth in March is probably not fully reflecting consumers reaction to the energy shock. The salary index in the KPMG and REC report on jobs ticked lower in March and the freshest part of the official labour market report also showed 11K jobs were lost in March while February was revised lower pointing to lower payrolls after the recent release had shown signs of improving.
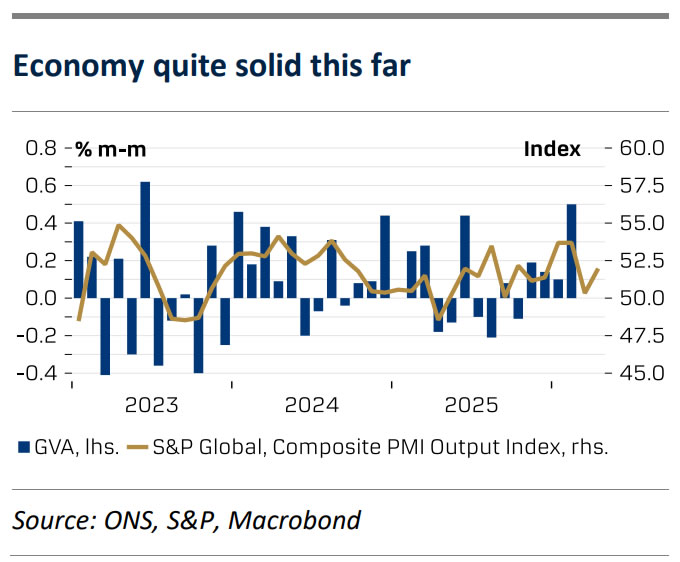
On the other hand, the more outdated part of the report shows that a worrying increase in unemployment has reversed with a 0.3 percentage point decline in February to 4.9% and the trend for lower wage growth not as strong as expected. Furthermore, the UK headed into the energy crunch with surprisingly strong momentum, as the service sector drove 0.5% mom GDP growth in February. April PMIs suggest the economy has remained afloat with the service sector even accelerating leaving composite PMI at a solid 52, much stronger than expected. Price indexes increased a lot, mostly for input prices but also the output price index has crossed 62 levels its highest since early 2023. Core inflation edged lower in March slightly below expectations, but service inflation rebounded to 4.5%, clearly too high.
BoE call. Even if recent data has come in quite solid, the UK labour market is much cooler and the starting point for the Bank Rate at 3.75% is much higher compared to 2022. Hiking rates will have to be weighed against a considerable risk of exacerbating a looming economic contraction. We think it is most likely the BoE will remain sidelined for the foreseeable future.
Market reaction. With the hawkish repricing in mind, we see risks slightly tilted towards a more dovish stance, supportive for EUR/GBP. We think the BoE is most likely to refrain from pushing back too much on market pricing, though. We forecast EUR/GBP to move higher towards 0.89 on a 6-12-month horizon.
Week Ahead – Geopolitics, Central Bank Meetings and Earnings Test Market Resilience
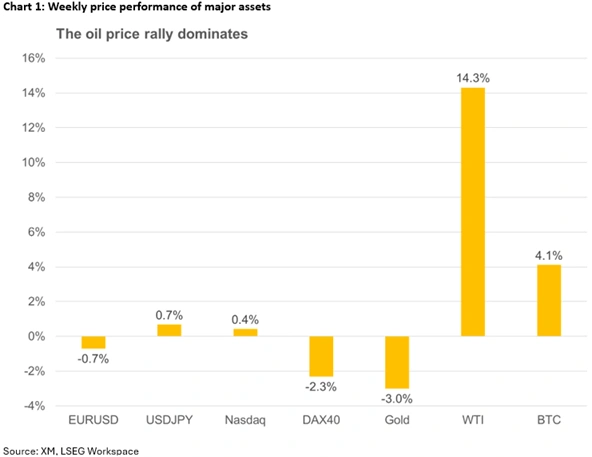
- Middle East developments drive market sentiment as negotiations appear to have stalled.
- An action-packed week ahead, with key GDP prints, central bank meetings and pivotal US earnings.
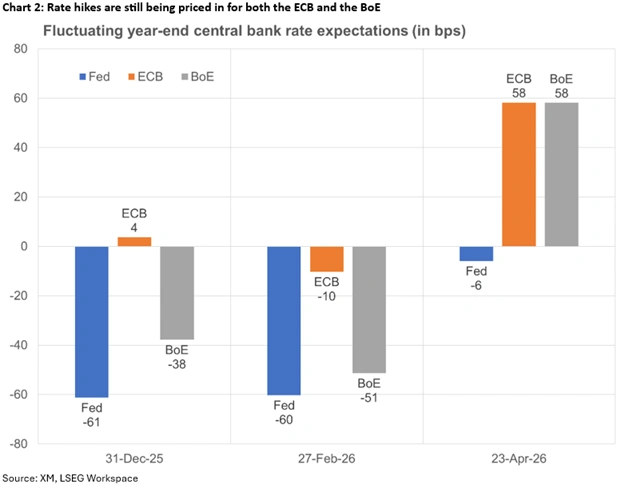
- US dollar rebound to be tested if ME newsflow improves and/or ECB and BoE turn hawkish.
- BoJ discontent could trigger intervention; equities could suffer on weaker earnings and geopolitical uncertainty.
Middle East conflict continues to dictate market sentiment
Another week has gone by with investors glued to their screens for developments in the Middle East. Risk appetite has been whipsawed based on the busy newsflow, the lack of a much-talked-about meeting between US and Iranian representatives, and the numerous comments from US President Trump. Notably, major US equity indices managed to record fresh all-time highs and bitcoin climbed to a two-month high, but not everything is shining bright in markets as hostilities could restart at a moment’s notice.
Consequently, oil prices remain in the driving seat, as even the positive scenario of a swift US-Iran agreement pushing oil towards $80 will leave central banks on the edge for second-round effects but obviously quite relieved that the global economy will not come to a standstill due to elevated energy costs.
Amidst this volatile environment, next week brings a rather packed calendar for investors. Key data releases like the preliminary GDP prints for the first quarter of 2026 from both the US and eurozone, and the April PMI surveys from China will complement the five planned central bank meetings and the pivotal US earnings announcements, making next week one of the busiest weeks so far in 2026.
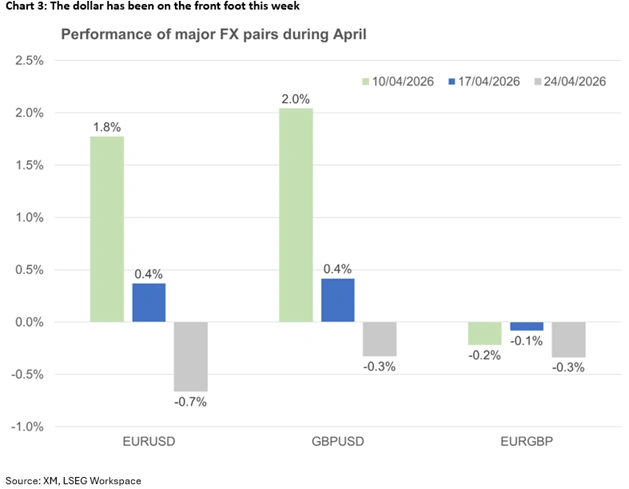
Euro/Dollar rally reverses, Pound/Dollar drops from two-month high
Following a rather difficult first part of April, with the US dollar significantly underperforming against both the euro and the pound, the greenback has been faring much better this week, benefiting from the lack of progress in the Middle East negotiations. At the time of writing, the dollar index is up 0.8% since Monday’s open, reversing last week’s losses.
Understandably, the US will be in the spotlight next week. The preliminary Q1 GDP print, the March durable goods orders report and April’s ISM Manufacturing survey could disappoint on the back of the Middle East conflict, while April’s CB Consumer Confidence index and March’s PCE report could highlight the damage done to spending behaviour as inflation expectations rise and energy costs bite.
On Wednesday, the Fed meeting is not expected to announce a rate change, given the lack of the usual dot plot and projections, and the fact that Powell might be less inclined for a major tilt in his (most likely) final meeting as Chairman. That said, overall rhetoric and the Q&A session at the usual press conference, along with the possibility of more FOMC members voting with Miran for a rate cut, are pivotal in gauging the sentiment within the committee. Hawkish dissenters are not expected following balanced commentary from Cleveland Fed President Hammack.
On the other side of the pond, the ECB will meet on Thursday. Courtesy of the Middle East developments and surging energy prices, the eurozone is going through a rough patch as per the PMI and ZEW surveys. However, there are no thoughts about rate cuts since inflation has been accelerating and remains the ECB’s only mandate.
Similar to the Fed, the ECB is expected to stand pat. The scenarios presented in the previous meeting will be the main topic of discussion in the council, but most members are expected to support another pause until the picture is completely clear, postponing any decision to June, when the new staff projections will be published. That said, there is a non-negligible risk of President Lagarde sounding more hawkish to please the uber hawks, especially if Thursday‘s preliminary eurozone inflation report shows further inflation pressures and the preliminary Q1 GDP figure surprises on the upside.
Meanwhile, amidst continued pressure on PM Starmer regarding the Mandelson case, the Bank of England will also meet on Thursday. Despite the lack of a sizeable acceleration in March inflation, the jump in the preliminary PMI surveys for April and the impressive March retail sales report have refueled rate hike expectations. To be fair, while the rhetoric from MPC hawks has been quite strong, the doves seem to still be in control of the committee. Therefore, the voting result can tilt either way, with a 5-4 outcome proving extremely market-moving.
Putting everything together, the US dollar will mostly remain whipsawed by developments in the Middle East. However, if there is positive sentiment from the region, even without a peace deal being agreed, the greenback might find itself on the back foot against both the euro and the pound. A successful bounce off the busy 1.1636-1.1671 range in euro/dollar would open the door to a rally towards 1.1830, reversing this week’s move. Similarly, a climb for pound/dollar above the recent local peak of 1.3599 could act as a basis for a more protracted advance, especially if the BoE doves avoid voting for a rate cut.
Could BoJ’s inaction trigger an intervention in Dollar/Yen?
On Tuesday, the Bank of Japan kicks off this round of central bank meetings. Despite a buildup of hawkish expectations ahead of the US-Israel-Iran conflict for the April gathering, a rate hike is out of the picture, which, along with concerns about the Japanese economy due to the blockade of the Strait of Hormuz, can explain the yen’s inability to benefit from the recent dollar weakness.
The focus will mostly be on the overall rhetoric of the BoJ meeting, but yen hawks looking for a clear signal that the BoJ is primed to deliver the much-discussed hike in June might be disappointed again. Dollar/yen trades just below 160 at the time of writing and developments could quickly force BoJ officials to decide if they will continue to tolerate the current high dollar/yen level, which helps exports and inflation, or intervene, reducing pressure on the BoJ to hike rates?
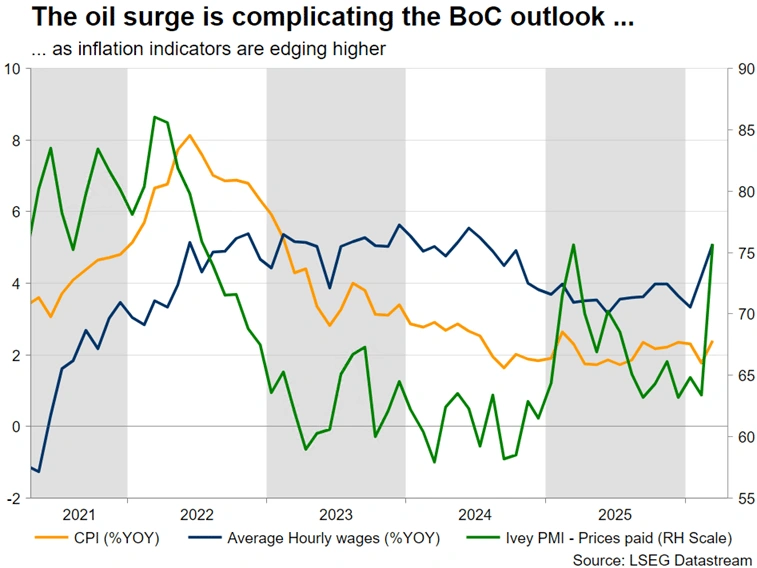
Loonie’s performance rests on BoC’s rhetoric
Commodity currencies have been outperforming the US dollar due to the improved risk appetite and, in the case of the loonie, higher oil prices. However, in the case of the Bank of Canada, which meets on Wednesday ahead of the Fed, growth concerns could still outweigh the inflation surge. No rate change is expected, although the weak March Ivey PMIs might force BoC members to refrain from sounding hawkish. In this case, coupled with negative newsflow from the Middle East, the current upward move in dollar/loonie could extend further, with the 1.3800 being the next key resistance area.
Gold remains directionless while equities appear too optimistic
Gold has been confusing most investors. While in the first part of the US-Israel-Iran conflict, dollar strength was the key factor for gold’s underperformance, the precious metal has failed to rally since early April when the dollar was on the backfoot. And while demand from central banks remains strong, with surveys pointing to further gold buying ahead, and real yields are not rising, gold continues to weaken, which can only mean that certain countries, most likely in the Middle East, are selling gold to raise cash.
On the other hand, US equities are faring much better, ignoring the Middle East developments and the reduced probability of Fed rate cuts in 2026. The current earnings season has been contributing to the sentiment change, but this upbeat sentiment will be put to the test next week as Alphabet, Microsoft, Amazon and Meta will announce their results on Wednesday, followed by Apple on Thursday. Other key earnings announcements include oil giants ExxonMobil and Chevron.
Provided that the situation in the Middle East does not escalate further, a positive set of figures would fuel another move higher, negating concerns about the recent movement being too aggressive – even groundless. Growth and technology stocks are expected to lead such a rally, pushing the usual suspects – the Nasdaq 100 and the S&P 500 indices – to post new all-time highs.
Weekly Focus – A Lot of Talk But Little Progress
Markets' last week's optimism regarding the war in Iran faced at least a partial reality check this week, as energy traffic at the Strait of Hormuz remains effectively frozen. Trump announced an extension to the ceasefire with Iran, but tangible progress in the actual negotiations seems elusive. Trump also announced a three-week extension to the ceasefire between Lebanon and Israel, but oil markets were little affected, as the price of Brent crude has risen back to around USD105/barrel.
Prices of refined oil products, like jet fuel or diesel, have also seen renewed upticks. The equity market rally took a breather, with European indices underperforming their American equivalents, and the EUR/USD rate declined back below 1.17.
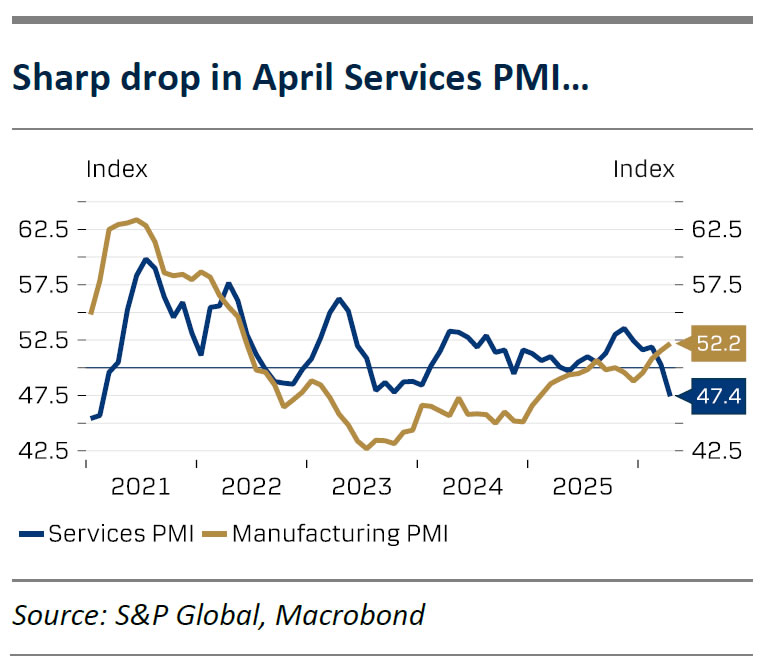
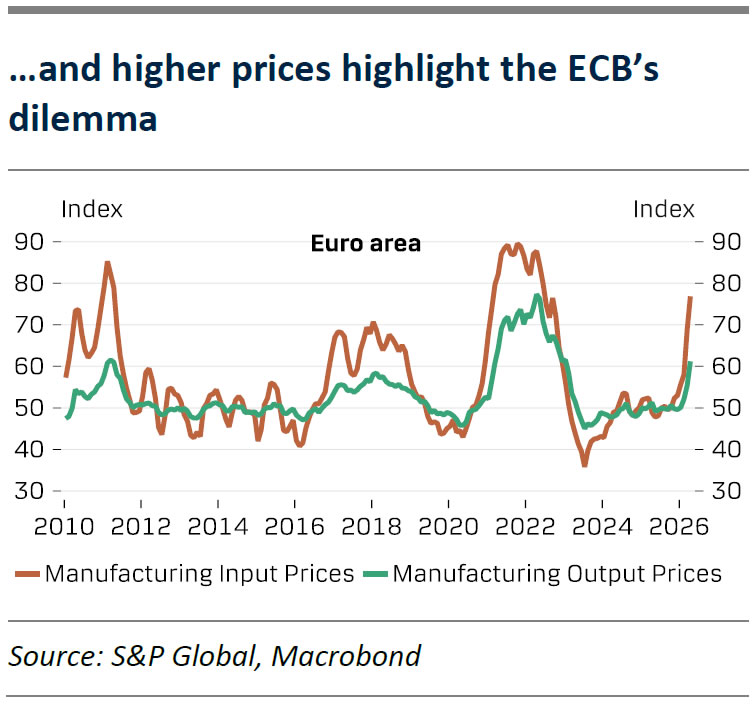
Over the coming days and weeks, markets will increasingly focus on not just what happens on the ground in Middle East, but also the economic impact across the globe. This week's April flash PMIs offered a mixed but also distorted bag of signals. Manufacturing indices moved higher across the US, UK, euro area, Japan and Australia, but lengthening delivery times and front-loaded new orders amid expected price hikes and supply shortages likely contributed to the upticks. Notably, the euro area recorded a clear downtick in services sector business activity (47.4; March 50.2), which could be a concerning sign of the negative sentiment effects. Unsurprisingly, leading indices for both input and output prices rose sharply across the different economies and sectors.
As such, both the ECB and the Fed will have plenty of mixed data and unclear geopolitical signals to digest in their next week's meetings. We expect both central banks to leave their monetary policy unchanged for now and wait for more clarity before reacting. Eventually, we expect the ECB to hike rates twice in the summer, in the June and July meetings. Even if policy rate hikes can do little about the first-order cost pressures stemming from the war, we believe the ECB will focus on ensuring inflation expectations remain well anchored by modestly tightening its policy. We see a good chance the policymakers will ultimately end up cutting rates again earlier than markets expect, already during the spring of 2027.
In contrast, we expect the Fed to maintain a steady hand through summer and eventually resume its rate cutting cycle in September and December. In his hearing at the US Senate, Kevin Warsh emphasized the importance of differentiating between the underlying pace of inflation and supply-driven level shifts in prices, and that the Fed should only react to acceleration in the former. Senator Thom Tillis is still withholding confirming Warsh's nomination as the new Fed Chair, but underscored this was not related to Warsh himself, but Department of Justice's ongoing probe into the Fed. If the nomination gets delayed past the end of Powell's term as the Chair (15 May), Powell will remain as the acting Chair for as long as needed.
Elsewhere, Bank of England, Bank of Japan and Bank of Canada are all widely expected to maintain their policy stances unchanged. On the data front, perhaps the most interesting releases will be euro area's flash April inflation and Q1 GDP, released just hours before the ECB's rate decision. We forecast headline inflation at 2.8% y/y and core inflation at 2.3% y/y. Q1 GDP data is due for release also from the US and Sweden, while China releases the latest set of official PMIs on Thursday.
ECB Preview : No Rush Before Summer Hikes
- We expect the ECB to leave the deposit rate unchanged at 2.00% on Thursday 30 April in line with consensus and market pricing. All focus is on signals.
- We expect Lagarde to leave the door open for summer hikes in order to keep inflation expectations anchored, but at the same time not pre-commit to hikes.
- We expect the ECB to increase policy rates by 25bp in June and July.
We expect the ECB to leave the deposit rate unchanged at 2.00% on Thursday 30 April in line with consensus and market pricing. Recent communication from the ECB’s GC members has indicated that they are in no rush to increase policy rates. Lagarde has stated that the “ECB needs more data before drawing policy conclusions” and Schnabel has said that “the ECB can afford to take time to analyse Iran shock”. With significant uncertainty around the economic outlook, we believe the option value of “wait and see” at the April meeting is high compared to hiking.
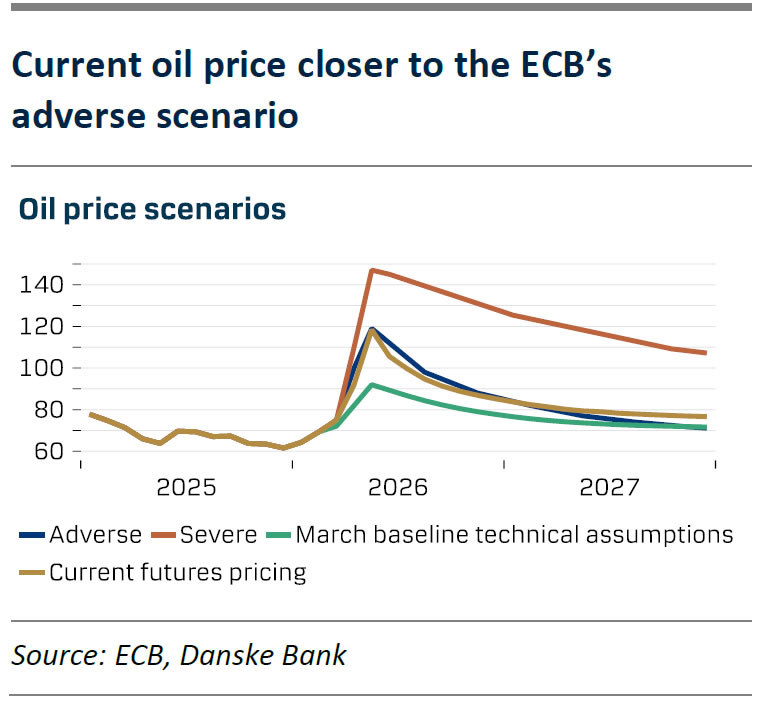
Since the March meeting, headline inflation increased as expected while the PMI data was weaker than expected, but with a sharp rise in price components (charts 1 and 2). Oil contracts for April and May are close to the ECB’s ‘adverse’ scenario while futures have fluctuated and are now close to the adverse scenario (chart 3). The inflation outlook is thus closer to the ‘adverse’ scenario which supports our view of two hikes, as around 35bp worth of hikes was included in the projections’ technical assumptions. The ECB’s communication is still relatively hawkish, and they signal that curbing upside price pressures carries more weight than mitigating deteriorating growth prospects. Moreover, we anticipate rate increases to ensure inflation expectations remain anchored. We therefore expect the ECB to raise policy rates by 25bp at the June and July meetings, bringing the deposit rate to 2.50%.
With an unchanged decision in April all focus during the meeting will be on signals, and we expect Lagarde to leave the door open for summer hikes in order to keep inflation expectations anchored. The ECB is likely broadly satisfied with the current market pricing of 65bp worth of hikes this year. Although we do see room for market pricing falling slightly as most recent communication from the ECB’s GC members has increasingly mentioned deteriorating growth prospects from higher energy prices. For this reason and given the extraordinary uncertainty about the economic outlook we do not expect any pre-commitments to summer hikes. Lagarde will likely state that the ECB remains data-dependent and will look at incoming data on a meeting-by-meeting basis before making decisions. At the same time, we expect her to communicate a full commitment to price stability and say that the ECB is ready to act if data warrants it. On the strategy side, we favour playing the move for lower short-end swap rates highlighting the negative growth effects from the negative supply shock. While timing is tricky, we monitor the 2Y1Y ESTR swap for re-entry after taking 9bp profit last Friday, as we still like the strategic nature of the trade.
Volatile ETF Flows Signal Investor Caution in the Gold Market
- High volatility led to fluctuating ETF flows, with outflows emerging in March
- Total ETF inflows in Q1 were significantly lower than a year earlier
- Elevated prices are weakening jewelry demand
- Geopolitical risks and central bank actions remain key drivers
Strong start followed by corrections
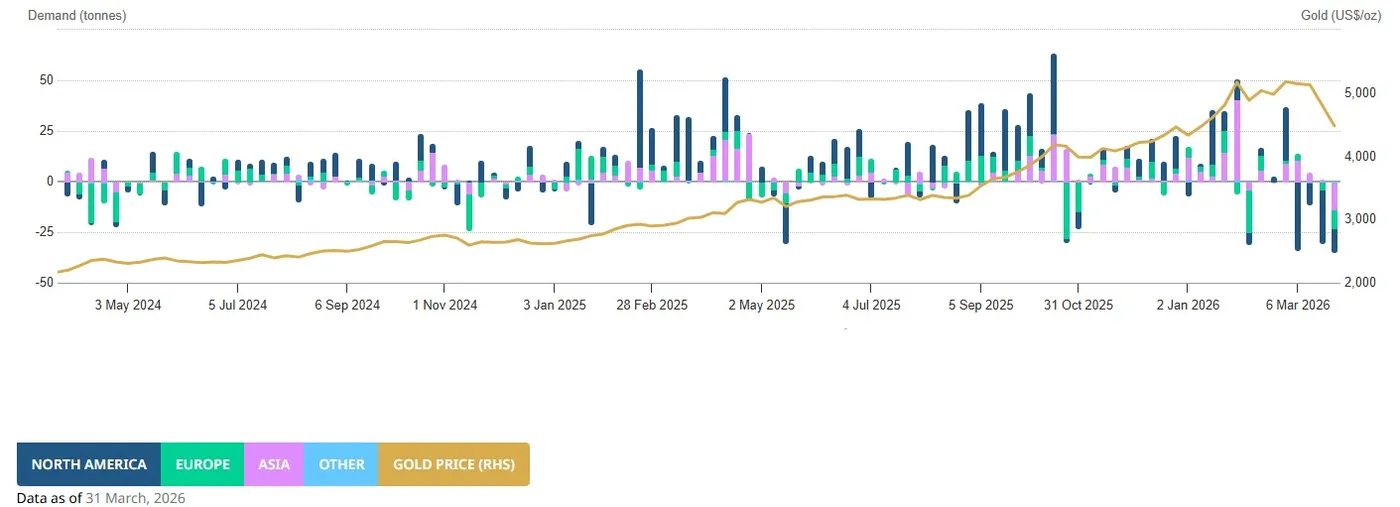
The first quarter in the gold market was marked by high volatility. Prices reached a record high of nearly USD 5,600 per ounce in January, followed by two sharp corrections. These price swings had a clear impact on investor behavior, particularly visible in flows into gold-backed ETFs. After strong inflows in January, February saw a noticeable slowdown, while March brought clear outflows, especially in North America.
Inflows into gold-backed ETFs, weekly data, source: WGC
Weak overall etf demand
As a result, the entire first quarter ended with only modest net inflows, significantly lower than a year earlier. This may limit overall demand for gold, which in 2025 exceeded 5,000 tonnes and reached a record level, supported largely by strong purchases of bars and coins.
High prices weigh on jewelry demand
Elevated price levels are beginning to negatively affect jewelry demand. Gold is currently trading around USD 4,700 per ounce, well above the 2025 average, reducing consumer interest in this segment.
Central banks remain a key factor
Central bank activity continues to play an important role. For instance, the Turkish central bank was forced to significantly reduce its gold reserves in March to support its domestic currency amid tensions related to the conflict with Iran.
Medium-term outlook remains positive
Despite short-term weakness in physical demand, the medium-term outlook for gold remains favorable. Elevated geopolitical uncertainty and expectations of a more accommodative Federal Reserve policy could support further price increases in the coming months.
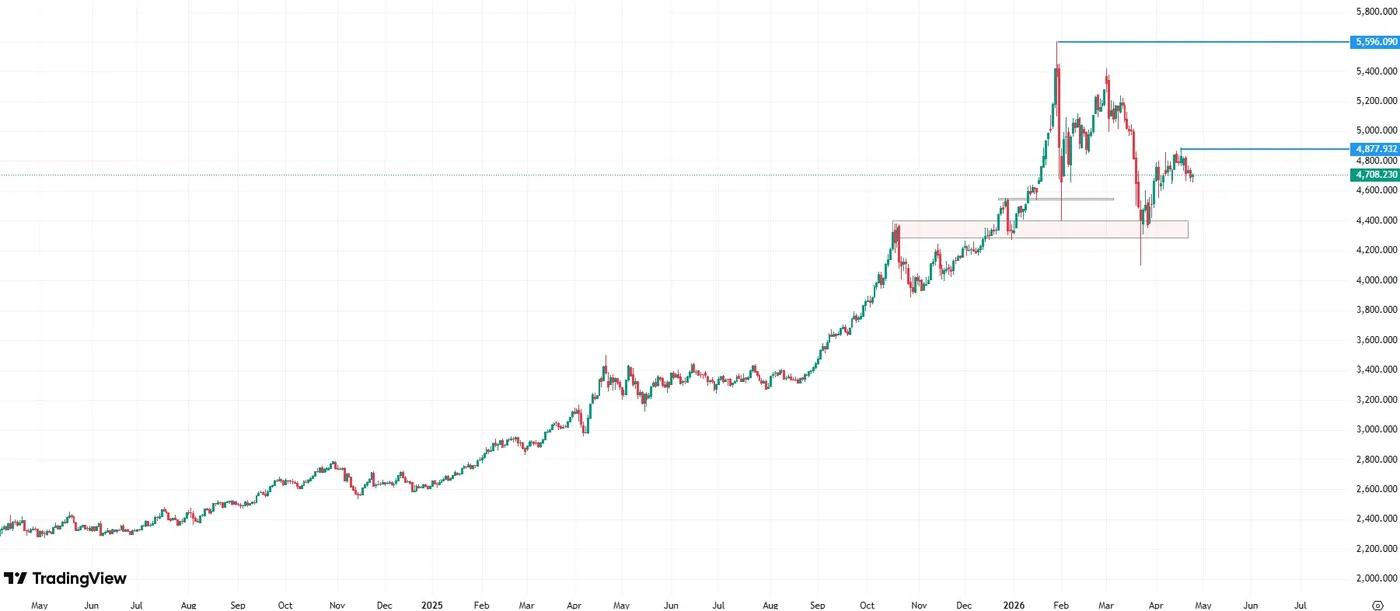
Gold chart (CFD), daily data, source: Tradingview