Sample Category Title
USD/CHF Price Analysis: Bulls Eye Key Resistance After Base Formation
- On the daily chart, USD/CHF is in a recovery phase, currently sandwiched between the 50-day MA (0.7845) and 100-day MA (0.7865).
- The H4 chart shows a more defined bullish structure, featuring a "Golden Cross" (100-period MA above 200-period MA).
- Failure to hold above the 0.7846 short-term support would negate the bullish setup and likely lead to a retest of the 0.7828 support level.
USD/CHF Daily Chart: Building a Base Above Key Support
The daily timeframe shows USD/CHF in a recovery phase following the sharp sell-off witnessed in early 2026. After bottoming out near the 0.7600 handle, the pair has formed a series of higher lows, currently supported by an ascending trendline.
Price action is currently sandwiched between the 50-day MA (0.7845) and the 100-day MA (0.7865). A daily candle close above the 100-day MA would be a significant bullish signal, suggesting a shift in medium-term momentum.
However, the overhead 200-day MA at 0.7937 remains the "line in the sand" for bulls. Until that level is reclaimed, the overall daily structure remains cautious.
The RSI is hovering around the 50 midline, indicating a lack of clear directional conviction at this stage.
USD/CHF Daily Chart, April 24, 2026
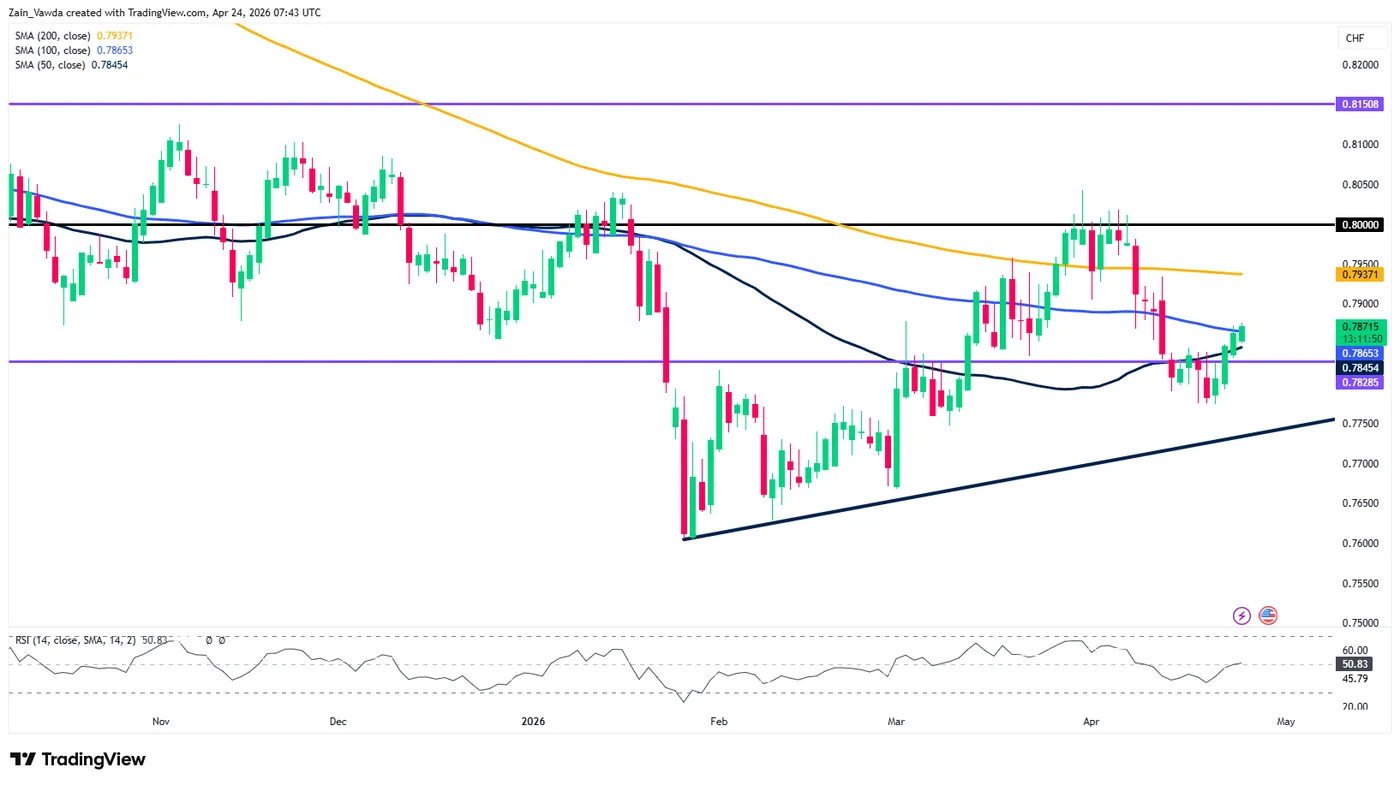
Source: TradingView (click to enlarge)
H4 Chart: Testing the Golden Cross Zone
Moving down to the 4-hour chart, we see a more defined bullish structure. USD/CHF has successfully pushed above the 0.7828 horizontal support level, which previously acted as a ceiling during the consolidation in mid-April.
Notably, the H4 chart shows the 100-period MA crossing above the 200-period MA, often a precursor to sustained bullish momentum.
Price is currently testing the 200-period MA (0.7887). A sustained break above this level would open the door for a retest of the psychological 0.8000 resistance area. The RSI on this timeframe is rising toward 65.00, suggesting there is still room for further upside before reaching overbought conditions.
USD/CHF Four-Hour Chart, April 24, 2026
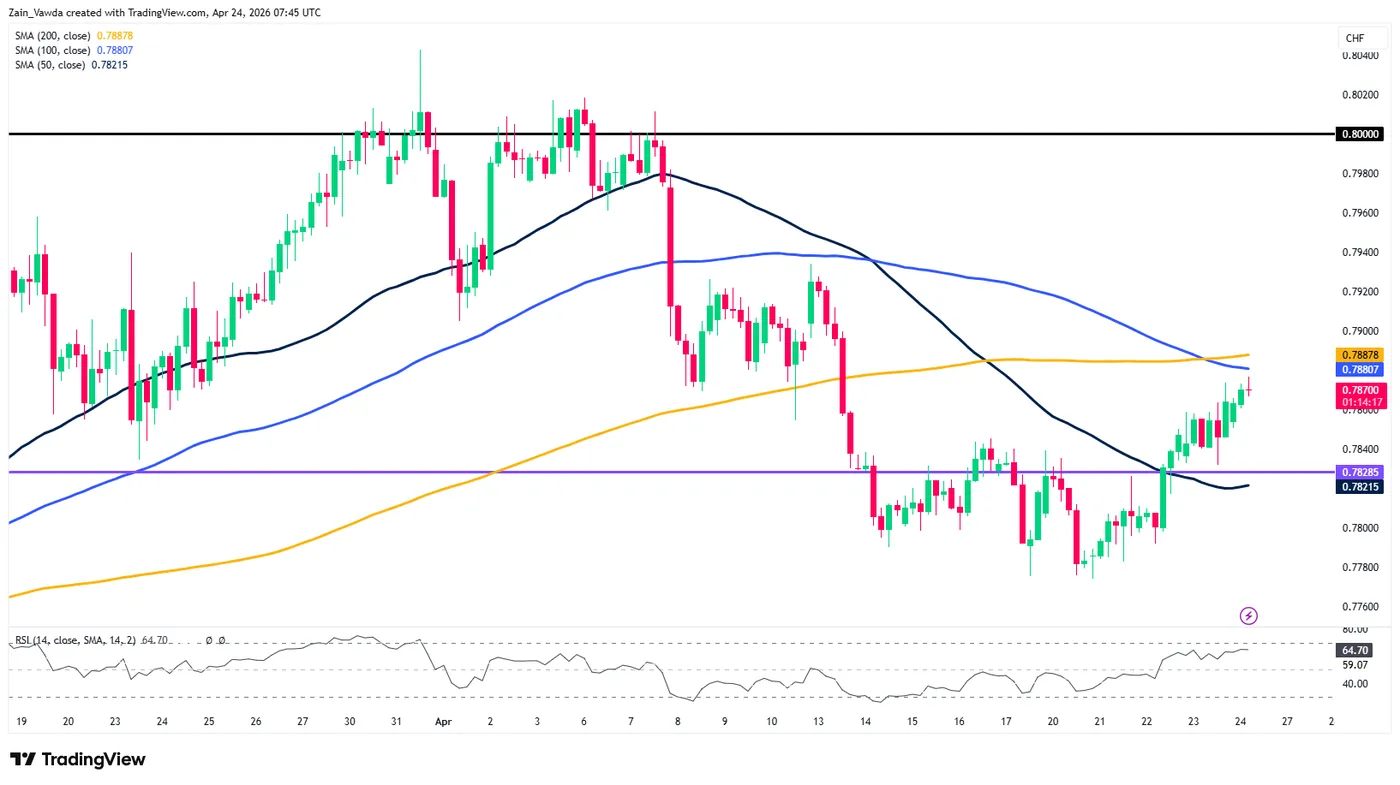
Source: TradingView (click to enlarge)
H1 Chart: Intra-day Scenarios and Key Levels
The 1-hour chart provides a granular view of the current breakout attempt. Price has found a foothold above all three major moving averages (50, 100, and 200), which are now beginning to fan out, supporting the bullish thesis.
Potential Bullish Scenario: If USD/CHF can maintain its position above the 0.7846 level (the recent swing high and current H1 support), bulls will likely target the 0.7887 (H4 200 MA) followed by the 0.7920 area. A clean break of 0.7920 would suggest a run toward the major psychological barrier at 0.8000. The path of least resistance currently appears to be to the upside, provided the 0.7840-0.7828 support zone holds.
Potential Bearish Scenario: Failure to clear the immediate overhead resistance near 0.7870/80 could result in a "bull trap." If the pair slips back below the 0.7846 mark, it would likely revisit the 0.7828 support level. A break below 0.7828 would negate the short-term bullish bias and could see the pair slide back toward the 0.7800 handle as sellers regain control.
Key Levels to Watch:
- Resistance: 0.7887, 0.7937, 0.8000
- Support: 0.7846, 0.7828, 0.7780
USD/CHF One-Hour Chart, April 24, 2026
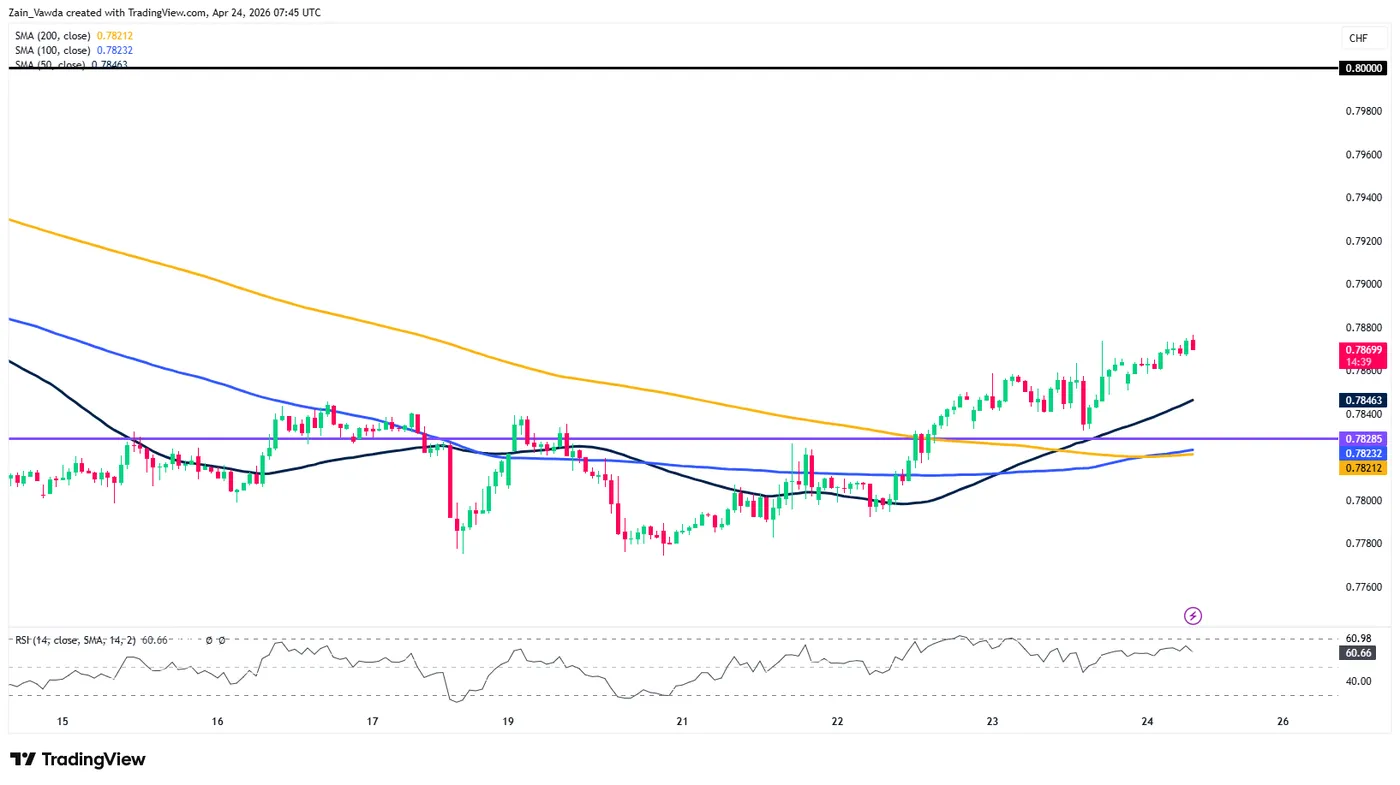
Source: TradingView (click to enlarge)
USD/CHF is at a critical juncture. The daily chart shows a recovery in progress, while the lower timeframes suggest an imminent breakout. Traders should watch the 0.7887 level closely; a breakout here could ignite a fresh wave of buying interest heading into the weekend.
SNB’s Schlegel Flags Global Uncertainty from Middle East Conflict, Signals Policy Readiness
SNB Chair Martin Schlegel warned that the Middle East conflict is injecting significant uncertainty into the global economy, with rising energy prices set to push inflation higher in the months ahead. He noted that “the higher energy prices will lead to a further increase in inflation in many countries,” while also cautioning that global growth is likely to "slow temporarily".
Schlegel acknowledged that external shocks are beyond the control of the Swiss National Bank, stating that “the SNB cannot change the uncertain global environment.” However, he emphasized that policymakers remain focused on domestic stability and are capable of navigating these challenges.
He stressed that the SNB stands ready to act if needed, saying “we are prepared to adjust our monetary policy at any time.” Backed by institutional independence and a well-established framework, Schlegel expressed confidence that the central bank is “well equipped to ensure that we continue to fulfil our mandate”.
Germany Ifo Falls to 84.4 as Iran Crisis Hits Confidence
Germany’s business sentiment deteriorated sharply in April, with the Ifo Business Climate Index dropping from 86.3 to 84.4, the lowest level since May 2020. The decline reflects broad-based weakness, with both the Current Situation Index and Expectations Index falling to 85.4 and 83.3 respectively.
The drop in expectations signals growing concern over the economic outlook, as the impact of the Iran crisis feeds through rising energy costs and uncertainty. Services were hit the hardest, slipping deeper into negative territory, while manufacturing and trade showed modest improvements but remained firmly pessimistic overall.
The data underscores the vulnerability of Germany’s economy to external shocks, particularly energy disruptions. With sentiment deteriorating and expectations weakening further, the outlook points to a continued slowdown, reinforcing concerns that the Eurozone’s largest economy is being hit hard by the ongoing crisis.
| Indicator | Apr | Mar |
|---|---|---|
| Ifo Business Climate | 84.4 | 86.3 |
| Current Situation Index | 85.4 | 86.7 |
| Expectations Index | 83.3 | 85.9 |
| Manufacturing | -12.1 | -14.5 |
| Services | -2.6 | -2.1 |
| Trade | -21.1 | -24.7 |
| Construction | -14.3 | -14.8 |
| Overall Assessment | — | — |
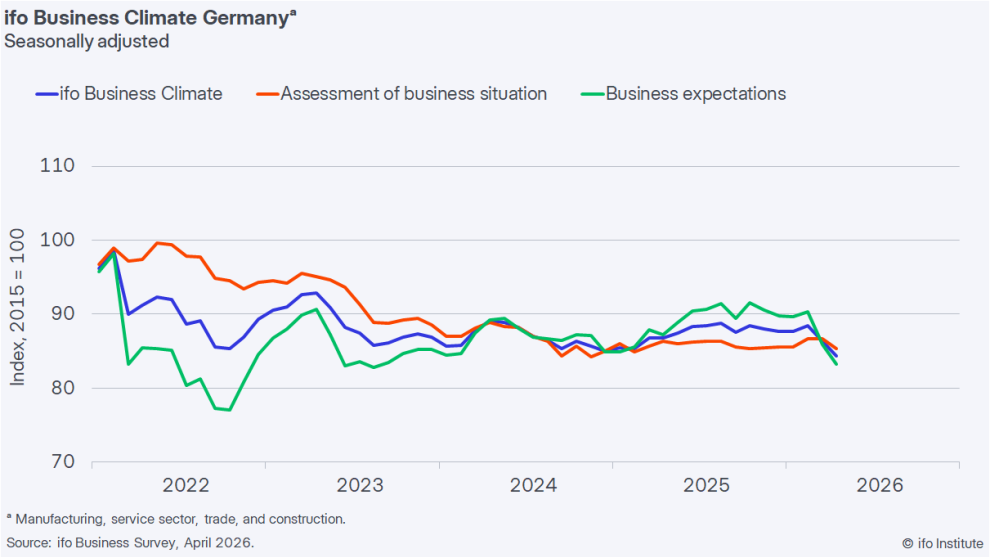
Chart Alert: EUR/USD Drifted Down to 1.1665/1635 Key Support for Potential Bullish Reversal
Key takeaways
- Pullback driven by geopolitical risk and USD strength: EUR/USD declined ~1.5% from its recent high as stalled US–Iran talks and rising oil prices boosted safe-haven demand for the US dollar.
- Macro backdrop turning supportive for euro: A steepening Eurozone–US rate differential suggests a relatively less dovish ECB versus the Fed, providing underlying support for EUR/USD.
- Technical setup points to potential rebound: Price is testing key support at 1.1665/1.1635 with bullish signals (trend above major MAs, RSI divergence, ascending channel), indicating a possible reversal unless support breaks.
The EUR/USD hit a recent two-month high of 1.1849 printed on last Friday, 17 April 2026, and turned soft due to the stalled second round of US-Iran peace talks, where it declined by 1.5% to hit a low of 1.1669 on Thursday, 23 April 2026.
Secondly, cracks have appeared in the extended ceasefire agreement, where both sides are using force to prevent oil tankers from transiting the Strait of Hormuz, which led to a 10% plus rally in oil prices, increasing the appeal of short-term safe haven demand status on the US dollar.
Interestingly, the EUR/USD’s five-day decline from its recent two-month high has reached an inflection area for a potential bullish reversal from a technical analysis and intermarket perspective.
Let’s uncover these factors in greater detail.
Eurozone/US implied interest rate policy curve spread has steepened
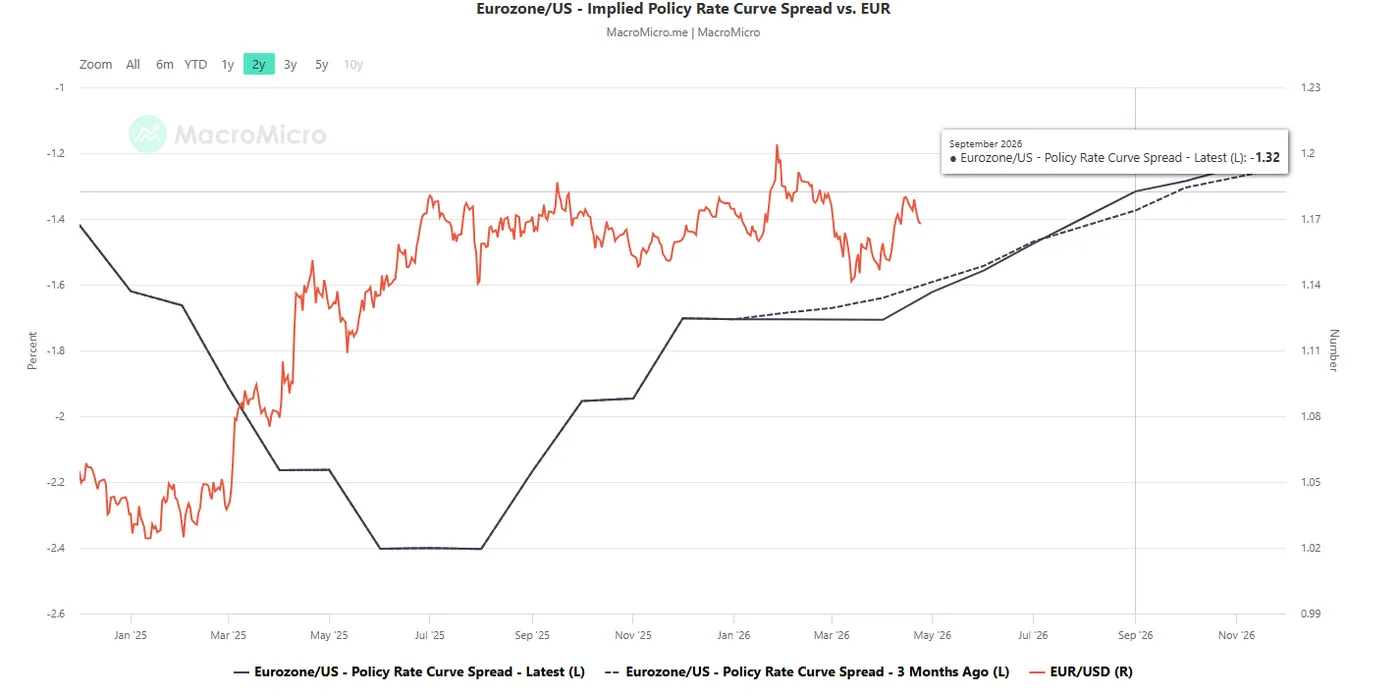
Fig. 1: Eurozone-US implied interest rate policy curve spread as of 23 Apr 2026 (Source: MacroMicro).
The monthly implied future policy interest rate curves for the Eurozone and the US are calculated using short-term interest rate futures that are highly sensitive to the expectations on these countries’ central banks' monetary policies
The current Eurozone/US implied interest rate policy curve spread for the period from May 2026 to September 2026 has steepened from three months ago, with the current September 2026 reading standing at -1.32% compared to -1.37% three months ago (see Fig. 1).
These observations suggest that the ECB is likely to be less dovish or more hawkish than the Fed, which in turn could provide support for a potentially firmer EUR/USD.
Let’s now focus on the potential short-term trajectory (1 to 3 days) of EUR/USD.
EUR/USD – Minor uptrend phase from 13 March 2026 low remains intact
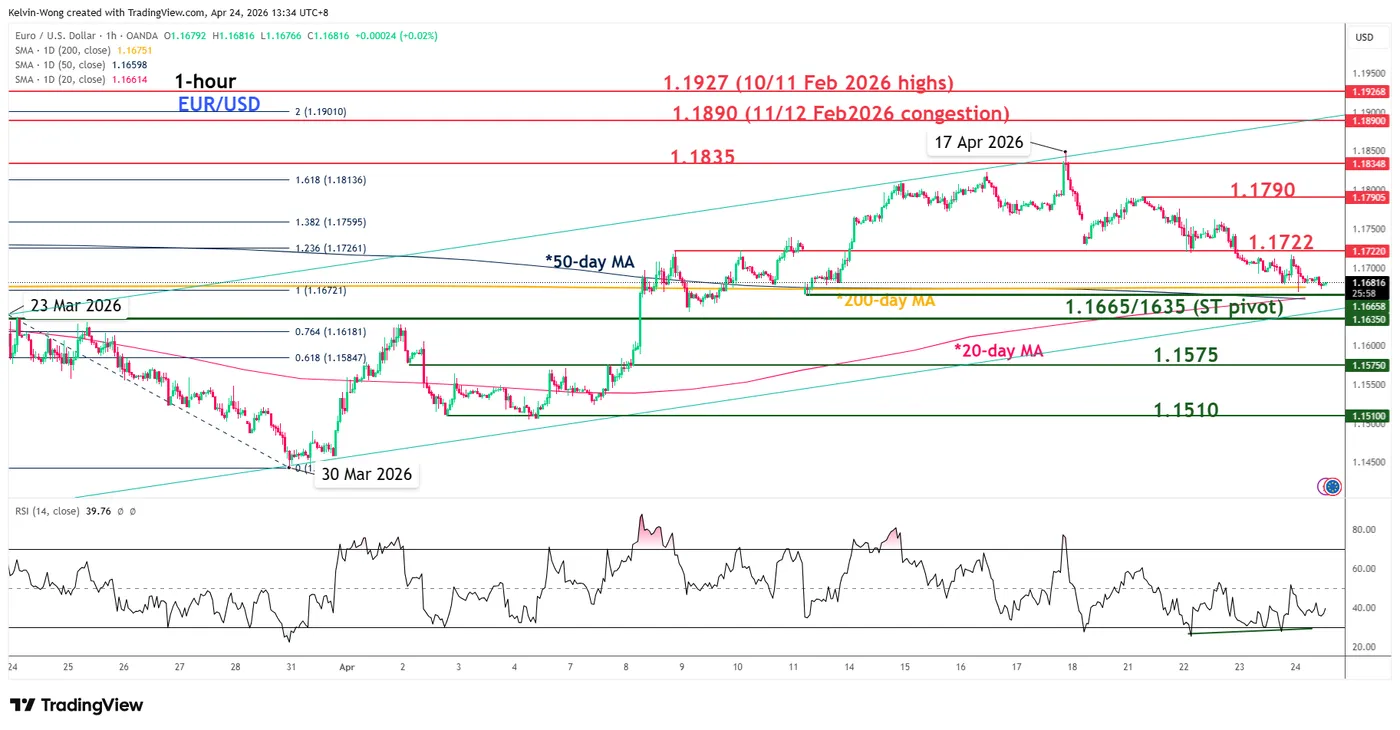
Fig. 2: EUR/USD minor trend as of 24 Apr 2026 (Source: TradingView).
Despite the five-day decline seen in the EUR/USD, its price actions are still trading above the 20-day, 50-day, and 200-day moving averages.
Watch the 1.1665/1635 key short-term pivotal support, and a clearance above 1.1722 (potential upside trigger) may see the next intermediate resistances coming in at 1.1790, 1.1835, and 1.1890 (also a Fibonacci extension) (see Fig. 2).
On the other hand, failure to hold at 1.1635 and an hourly close below it invalidates the bullish reversal scenario to see the continuation of the corrective decline to expose the next intermediate supports at 1.1575 and 1.1510.
Key elements to support the near-term bullish bias on EUR/USD
The five-day decline of the EUR/USD has reached the intersection area of the 20-day, 50-day, and 200-day moving averages, where the 20-day MA is now shaping an impending bullish crossover above the 50-day MA.
The price actions of the EUR/USD have continued to oscillate within its minor ascending channel in place since the 30 March 2026 low.
The hourly RSI momentum indicator has just shaped a bullish divergence condition at its oversold region on Thursday, 23 April 2026.
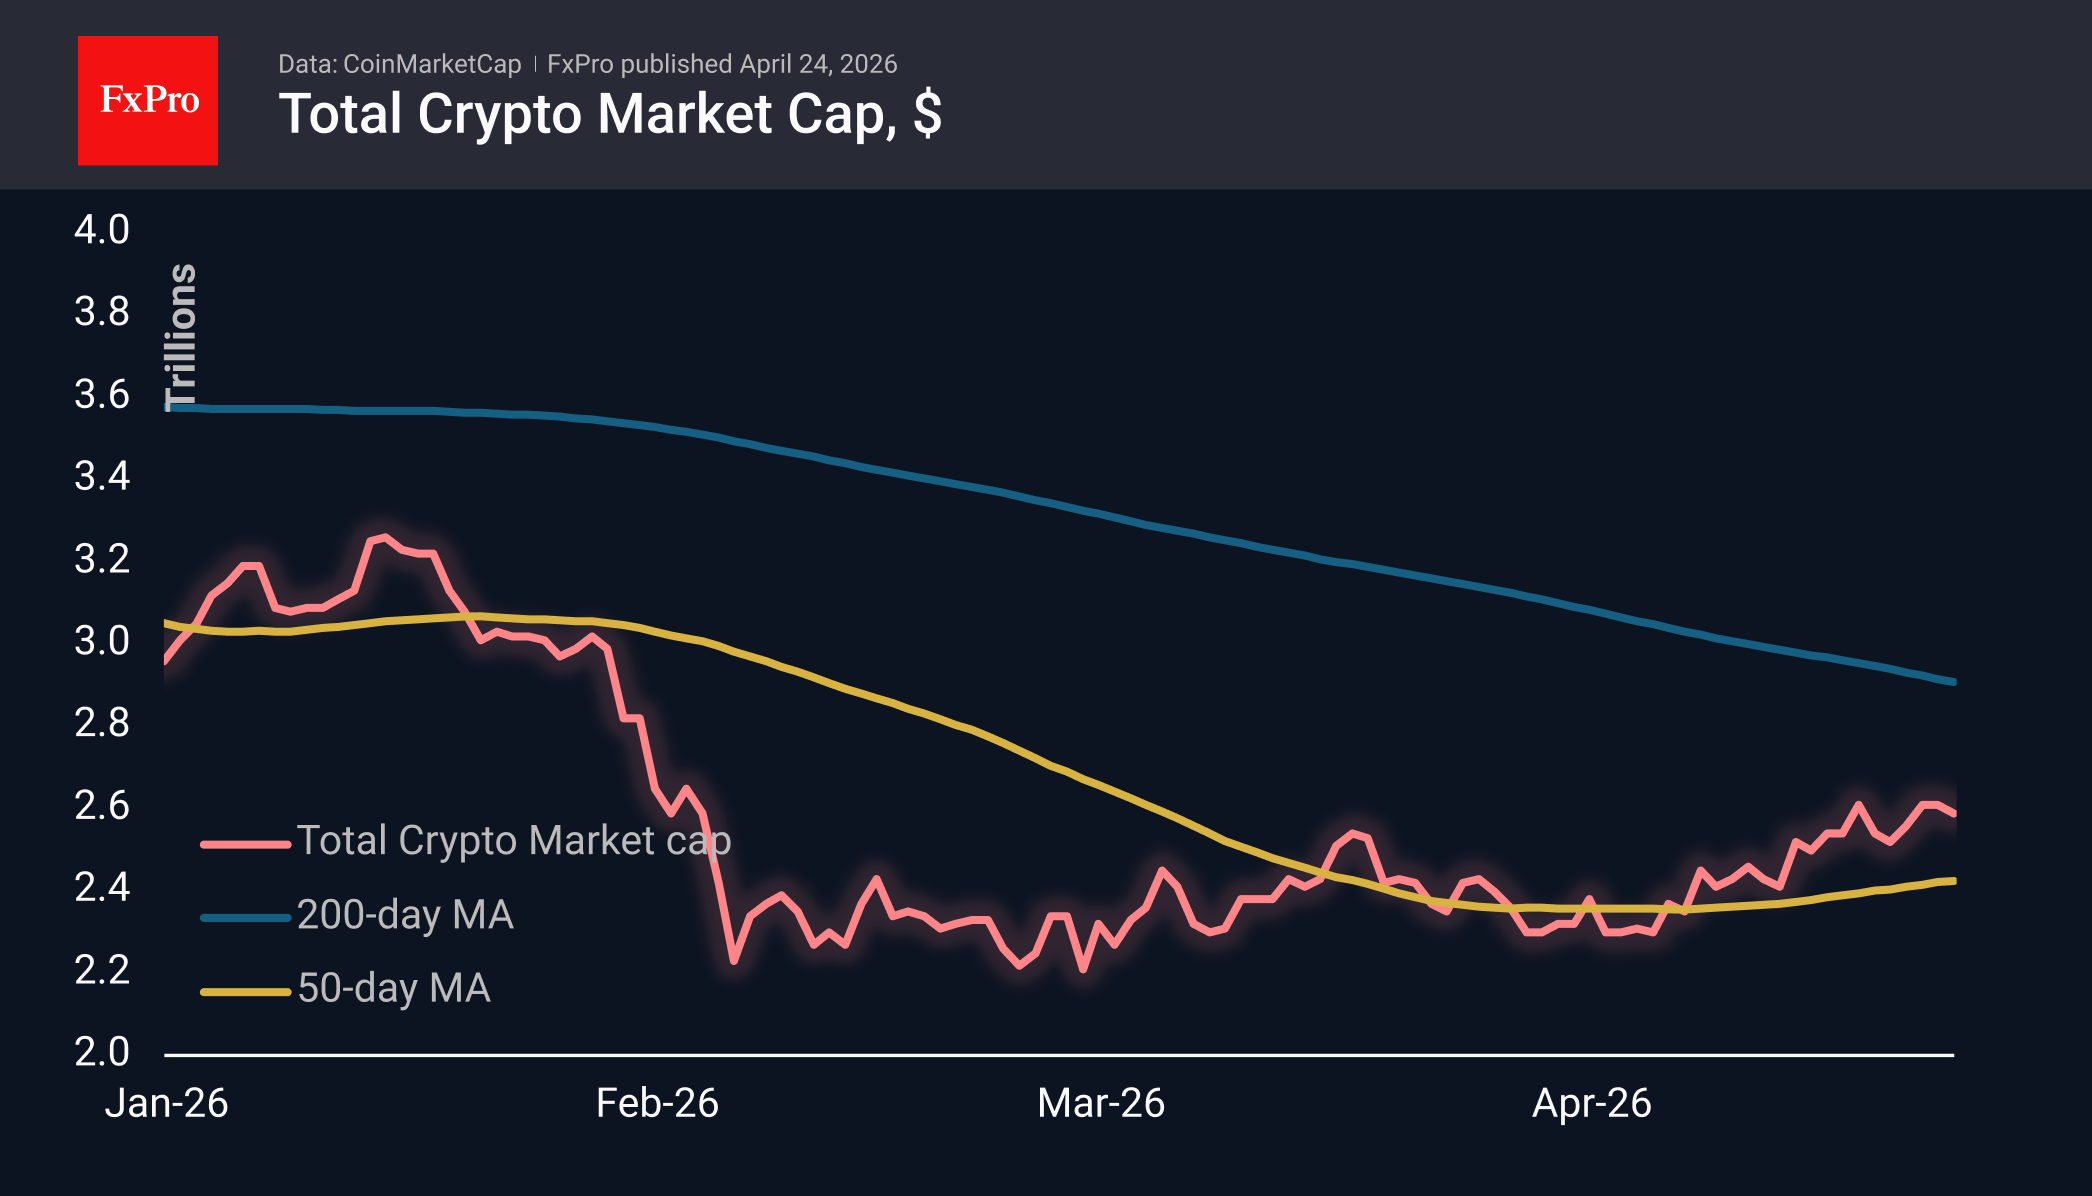
Crypto Market Once Again Awaiting Signal from the Stock Markets
Market Overview
The cryptocurrency market capitalisation fell by 0.6% over the past 24 hours to $2.59 trillion. Leading the gains are the anonymous Zcash (+9.1%), Theta (+6.2%), and Cosmos (+3.6%). Among the underperformers are Toncoin (−1.8%), despite positive news, as well as the major players Ethereum (−1.5%) and Polkadot (−1.2%). Meanwhile, the US S&P 500 is hovering around 7,100, whilst the Nasdaq 100 is testing new highs at 27,000. It appears that the crypto market is once again waiting for a boost from the stock markets to continue its climb.
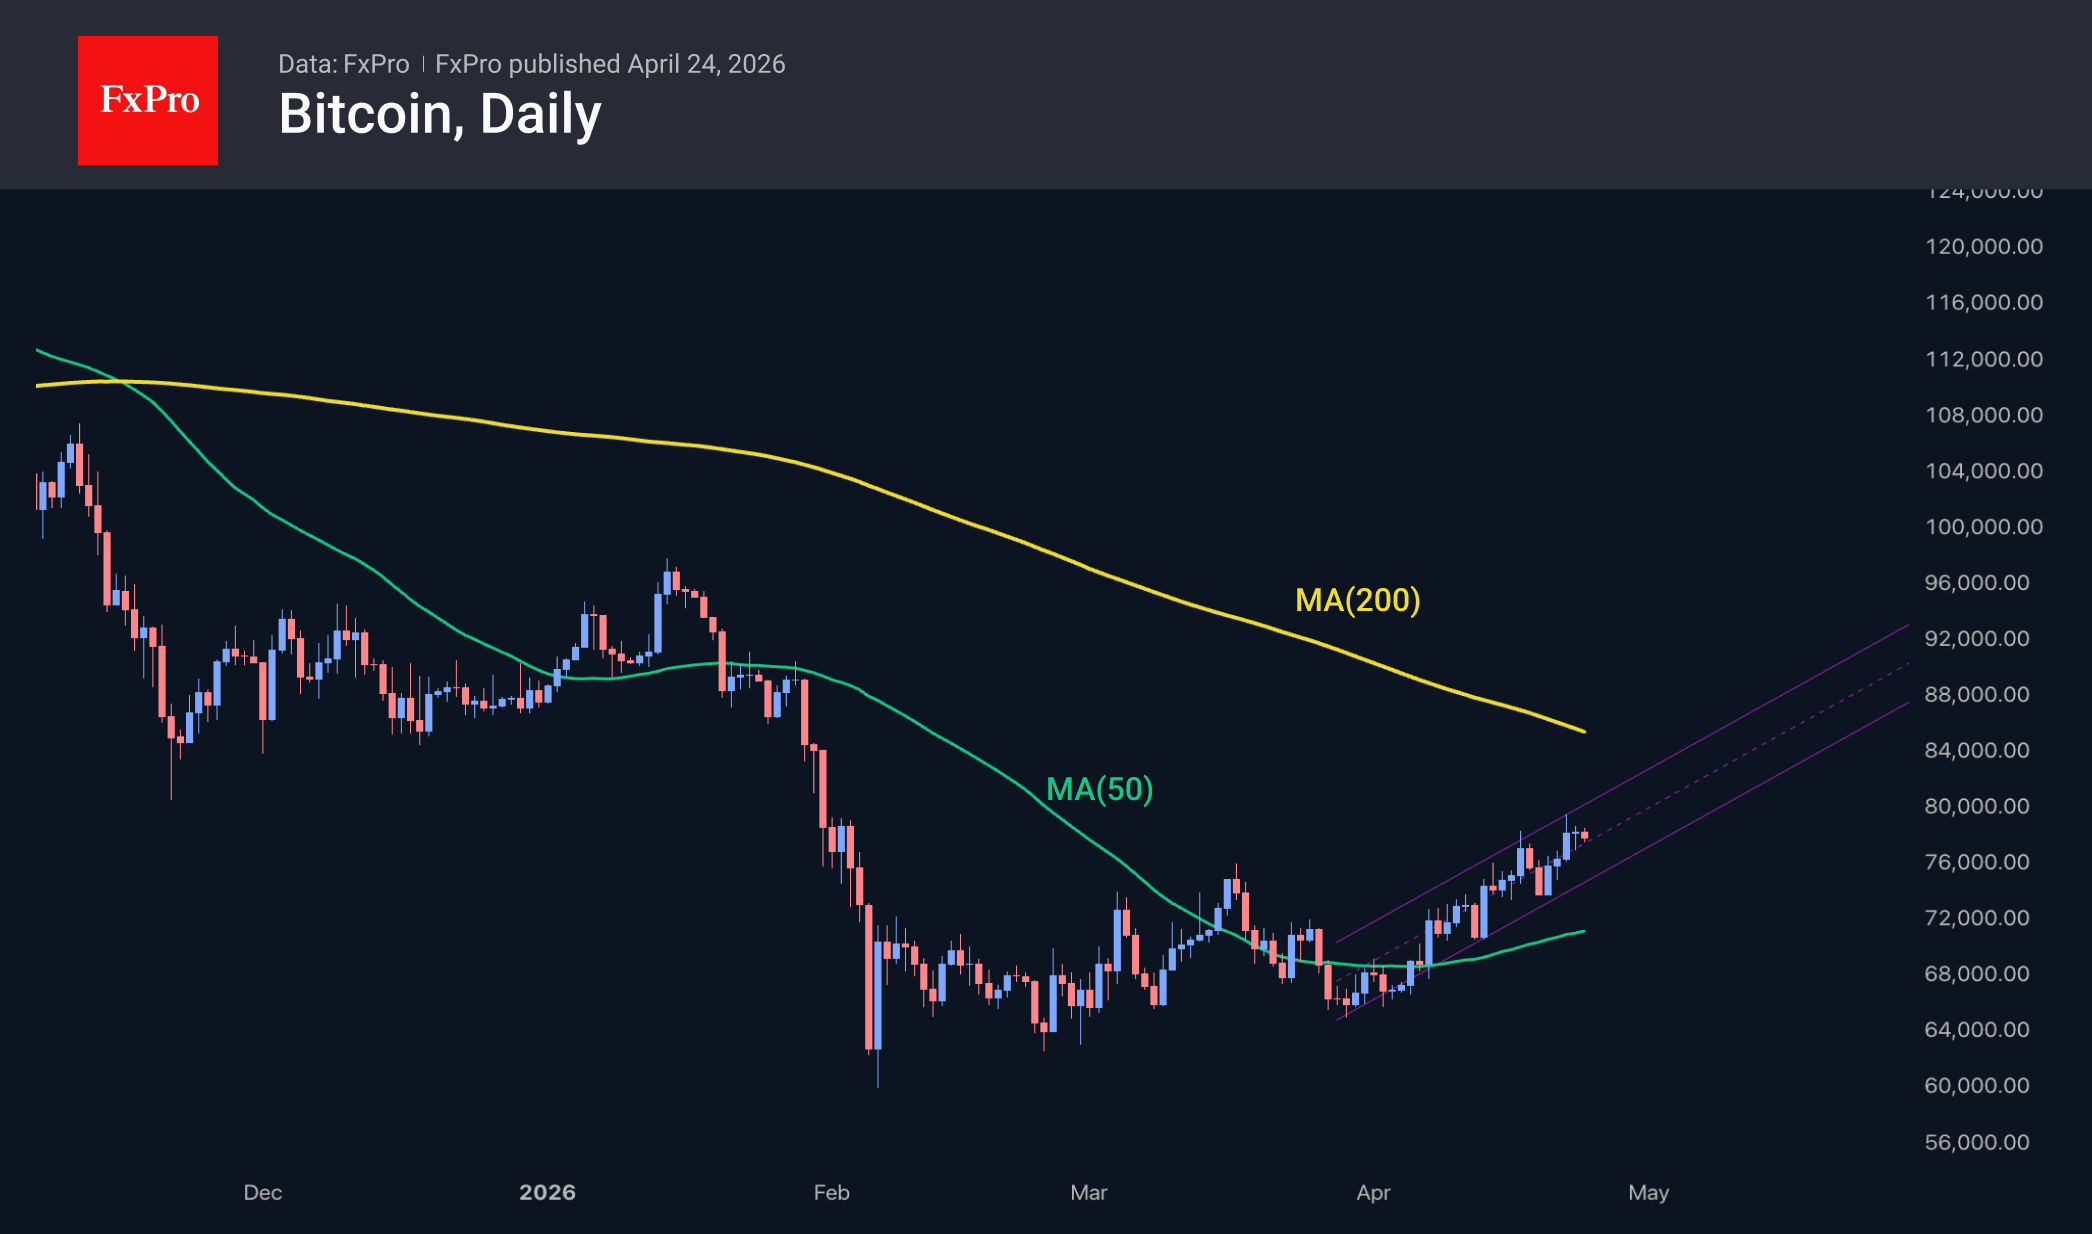
Bitcoin continues to consolidate around $78K. Attempts to push prices below $77K have met with confident buying. The leading cryptocurrency remains in an uptrend that began in early April, with fairly active buying on dips, and the price is currently roughly in the middle of this channel, which ranges from $75.6K to $80.5K. If this pace continues, it will take just over two weeks to reach the 200-day moving average, but we expect to see an acceleration in growth soon, along with more intense fluctuations in key indicators of the long-term trend.
News Background
QCP Capital believes that the Bitcoin rally is temporary and will not alter the bearish trend of recent months. Risky assets are feeling more confident solely due to the extension of the truce and the stance of Federal Reserve Chair nominee Kevin Warsh, who has confirmed the agency’s complete independence.
The options market also does not confirm a trend reversal. Short-term volatility remains low, and downside protection remains in demand.
At K33 Research, they are more confident that the rally in the leading cryptocurrency will continue. The divergence between BTC’s rise and negative funding rates makes the market tactically vulnerable to a short squeeze. However, the $79K–$80K zone presents a barrier, as it coincides with the realised price of short-term holders — a group of investors more likely to sell as prices rise. CryptoQuant also refers to the $80K level as a “critical inflexion point”.
A 50% correction in the leading cryptocurrency from its October highs could lead to new highs — the stronger the pullback, the more powerful the subsequent rally, said Morgan Creek co-founder Anthony Pompliano. According to him, “Bitcoin has become the king of safe havens in all kinds of chaos”.
Recent attacks on the Drift and Kelp protocols, following which users withdrew more than $15 billion from the DeFi sector, may temporarily dampen Wall Street firms’ interest in blockchain technologies, according to Jefferies.
Bitcoin: Futures Momentum vs Spot Market Reality
Rising oil prices amid risks to shipping through the Strait of Hormuz have strengthened global inflation expectations. According to the Pentagon, clearing the strait could take at least six months, sustaining uncertainty in commodity markets and weighing on risk assets overall — a category that typically includes cryptocurrencies.
At the same time, institutional demand for Bitcoin remains resilient. As of 20 April, spot ETFs recorded five consecutive days of inflows, with daily volumes around $238 million, while Strategy (formerly MicroStrategy) executed its largest purchase since late 2024, acquiring 34,164 BTC worth $2.54 billion. However, analysts at CryptoQuant note that the current price momentum is being driven primarily by the perpetual futures market, while spot demand is declining. A similar pattern was observed in January ahead of the correction from $98,000, suggesting that the market remains vulnerable.
Technical picture
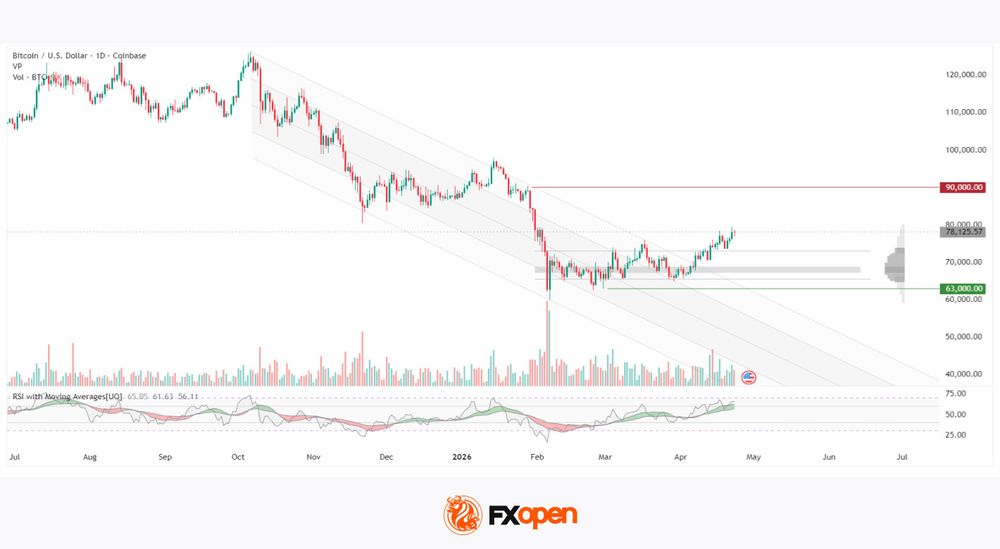
Since October 2025, Bitcoin has been trading within a descending parallel channel, with the lower boundary tested in February 2026 when the price fell to around $60,000 amid exceptionally high trading volumes typical of a selling climax. Following this low, the market shifted into recovery mode, and in the first half of April 2026, the price broke above the upper boundary of the channel and managed to hold above it.
At the same time, the price moved beyond the upper edge of the horizontal volume zone between $65,000 and $73,000, where most trading activity had been concentrated in previous months. This zone now lies below current levels. The nearest resistance is seen at $90,000, while support stands at $63,000. The RSI with moving averages shows readings of 64 / 61 / 56 — the oscillator remains above both moving averages, which are trending upwards, indicating ongoing buying pressure. Vertical volume in recent sessions remains moderate, with no clear signs of acceleration.
Summary
The horizontal volume zone has shifted below the current price, signalling a structural tilt in favour of buyers. The RSI remains above its moving averages, confirming bullish pressure, though recent trading volumes do not yet indicate a strong acceleration in momentum. Resistance at $90,000 and support at $63,000 define the key range within which the next phase of market structure is likely to develop.
FXOpen offers the world's most popular cryptocurrency CFDs*, including Bitcoin and Ethereum. Floating spreads, 1:2 leverage — at your service (additional fees may apply). Open your trading account now or learn more about crypto CFD trading with FXOpen.
*Important: At FXOpen UK, Cryptocurrency trading via CFDs is only available to our Professional clients. They are not available for trading by Retail clients. To find out more information about how this may affect you, please get in touch with our team.
This article represents the opinion of the Companies operating under the FXOpen brand only. It is not to be construed as an offer, solicitation, or recommendation with respect to products and services provided by the Companies operating under the FXOpen brand, nor is it to be considered financial advice.
EUR/USD and EUR/CAD Continue Correction Ahead of Key Data
The euro remains under pressure, extending its corrective decline following the previous impulsive rally. Market participants are taking profits and trimming positions ahead of key macroeconomic releases, reducing demand for the single currency and keeping both pairs near important levels, with the potential for increased volatility.
Ongoing geopolitical uncertainty in the Middle East continues to act as an additional factor, particularly through its impact on commodity markets, especially oil. Fluctuations in energy prices are influencing inflation expectations and the outlook for monetary policy, which is particularly relevant for commodity-linked currencies such as the Canadian dollar.
Focus now shifts to upcoming data from the euro area, Canada, and the United States, which may reshape expectations regarding the next steps of major central banks. Weak or neutral data could increase pressure on the euro and extend the current downside move, while stronger figures may provide support and trigger a corrective rebound or stabilisation near current levels.
EUR/USD
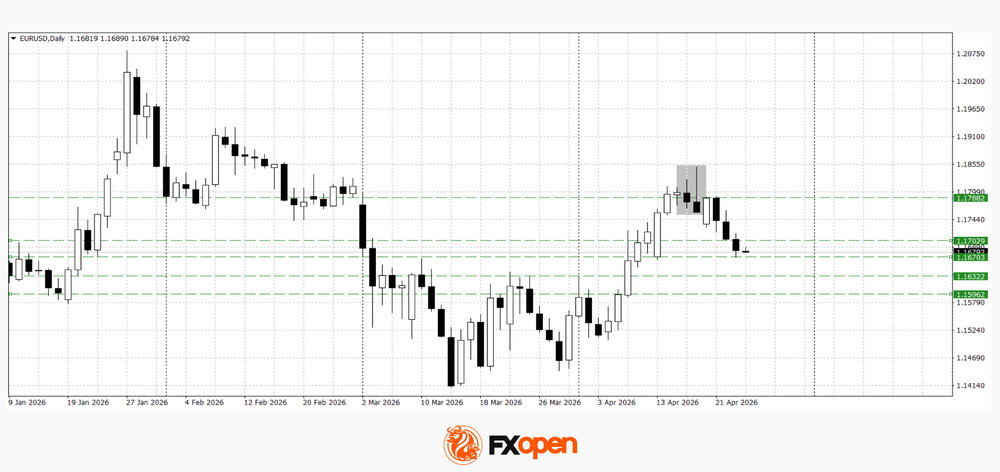
After forming a bearish reversal pattern last week, EUR/USD continues to trade within a corrective downtrend. Sellers managed to push the pair below the key 1.1700 support level yesterday. If this level turns into resistance, a retest of recent lows and further decline towards 1.1630–1.1600 may follow.
Key events for EUR/USD:
- today at 09:45 (GMT+3): France consumer confidence
- today at 11:00 (GMT+3): Germany IFO business climate index
- today at 17:00 (GMT+3): US inflation expectations (University of Michigan)
EUR/CAD
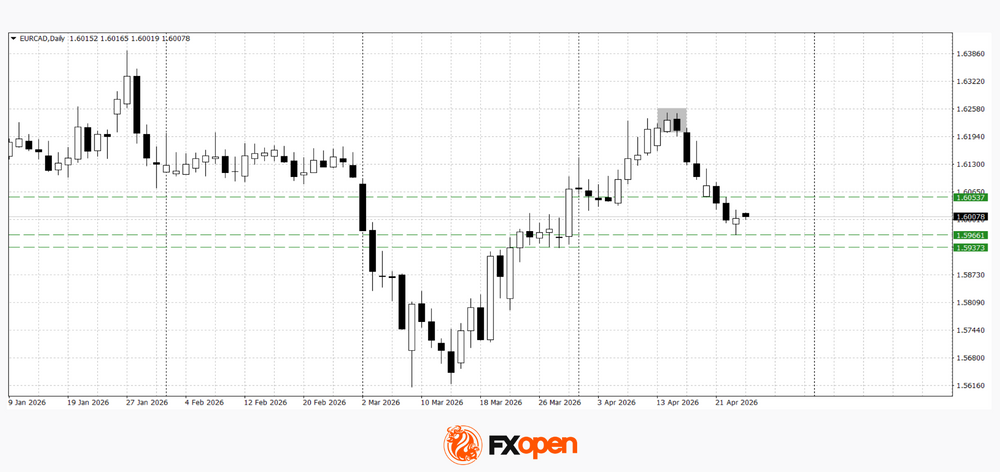
EUR/CAD is also moving lower, testing important levels amid mixed fundamental drivers. Technical analysis points to the possibility of further downside towards 1.6000–1.5940, supported by a confirmed bearish “tweezer” pattern on the daily chart. A move above 1.6050 could bring buyers back into the market.
Key events for EUR/CAD:
- today at 15:30 (GMT+3): Canada core retail sales
- today at 18:00 (GMT+3): Canada budget balance
- today at 22:30 (GMT+3): CFTC CAD net speculative positions
Both pairs remain near key levels, with future direction dependent on a combination of fundamental factors. Depending on incoming data, the market may either shift into consolidation with attempts to hold support, or see an extension of the current corrective decline.
Trade over 50 forex markets 24 hours a day with FXOpen. Take advantage of low commissions, deep liquidity, and spreads from 0.0 pips (additional fees may apply). Open your FXOpen account now or learn more about trading forex with FXOpen.
This article represents the opinion of the Companies operating under the FXOpen brand only. It is not to be construed as an offer, solicitation, or recommendation with respect to products and services provided by the Companies operating under the FXOpen brand, nor is it to be considered financial advice.
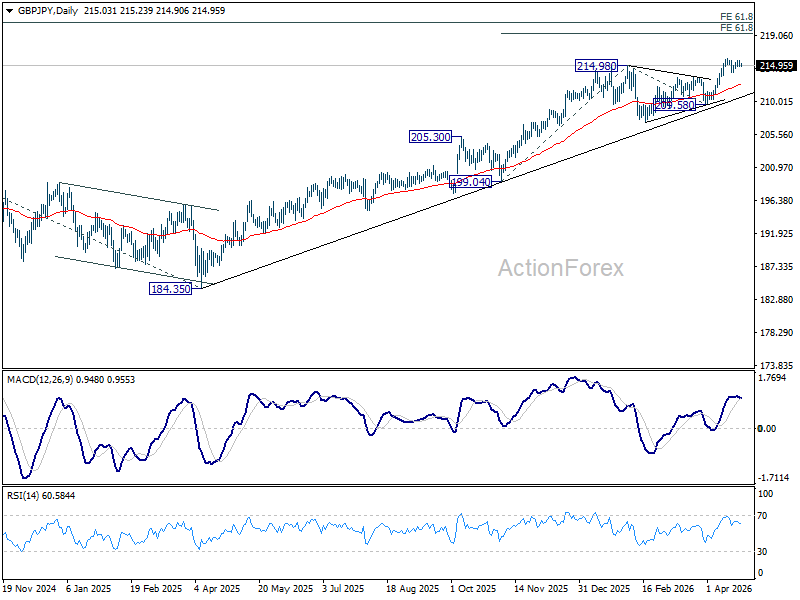
GBP/JPY Daily Outlook
Daily Pivots: (S1) 214.78; (P) 215.27; (R1) 215.58; More...
Intraday bias in GBP/JPY remains neutral and more consolidations could be seen below 215.89. Further rise is expected as long as 213.29 resistance turned support holds. Firm break of 215.89 will resume larger up trend to 61.8% projection of 199.04 to 214.98 from 209.58 at 219.43.
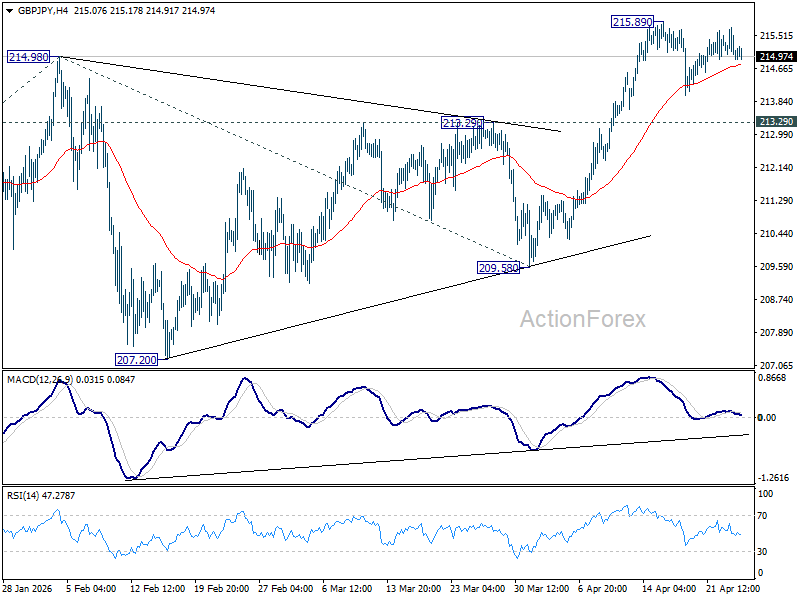
In the bigger picture, up trend from 123.94 (2020 low) is still in progress. Firm break of 214.98 will target 61.8% projection of 148.93 (2022 low) to 208.09 (2024 high) from 184.35 at 220.90. This will remain the favored case as long as 55 W EMA (now at 204.83) holds, even in case of another deep pullback.
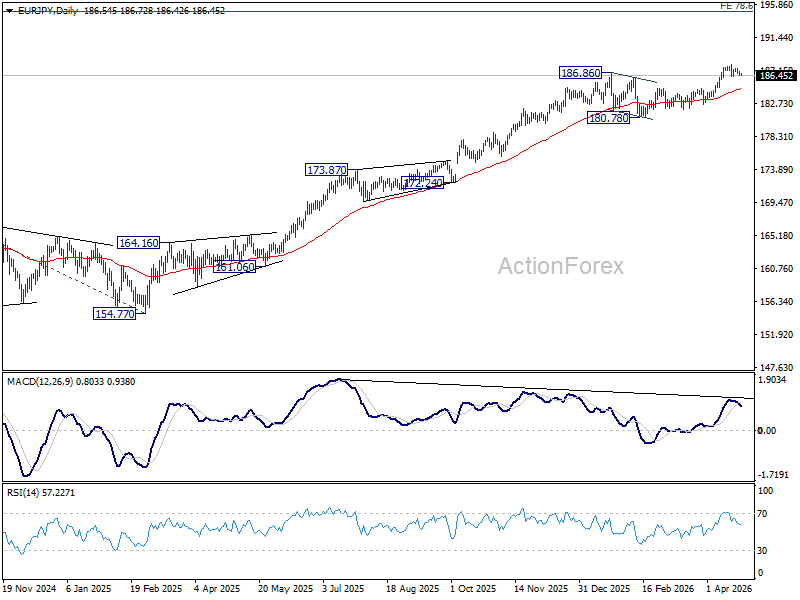
EUR/JPY Daily Outlook
Daily Pivots: (S1) 186.37; (P) 186.67; (R1) 186.91; More...
EUR/JPY is staying in consolidations below 187.93 and intraday bias remains neutral. Another fall might be seen to 38.2% retracement of 182.56 to 187.93 at 185.87. But strong support would be seen there to bring rebound. On the upside, though, break of 187.93 will resume larger up trend.
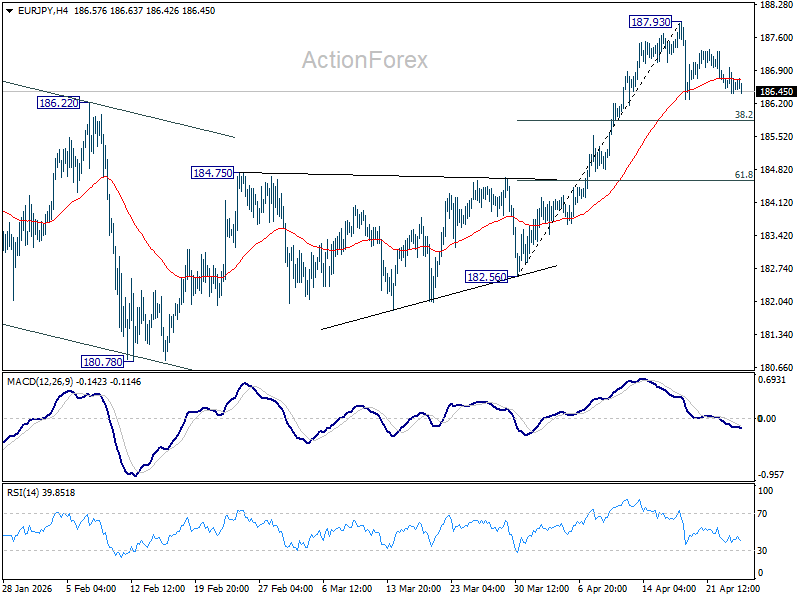
In the bigger picture, up trend from 114.42 (2020 low) is in progress Next target is 78.6% projection of 124.37 (2022 low) to 175.41 (2025 high) from 154.77 at 194.88 next. For now, medium term outlook will stay bullish as long as 180.78 support holds, even in case of deeper pullback.
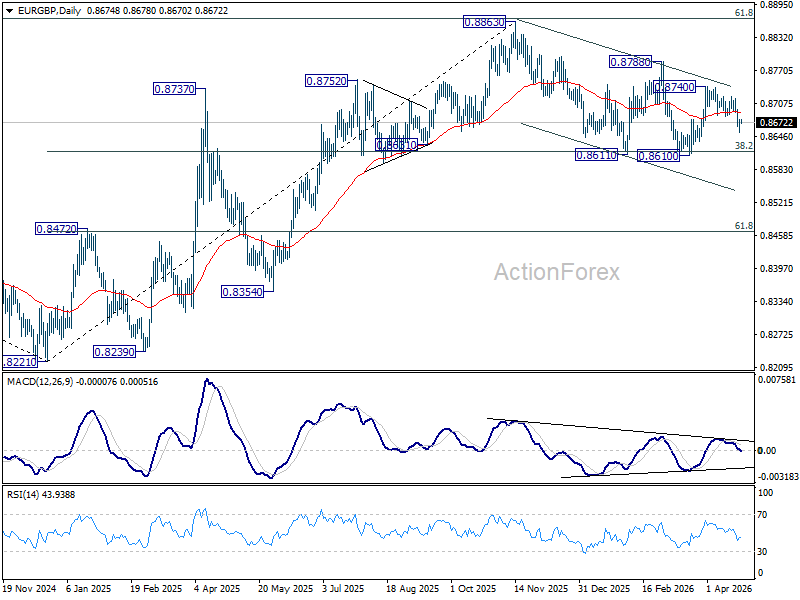
EUR/GBP Daily Outlook
Daily Pivots: (S1) 0.8659; (P) 0.8670; (R1) 0.8686; More…
Intraday bias in EUR/GBP is turned neutral first with current recovery. But further fall is expected as long as 0.8718 resistance holds. Below 0.8652 will extend the decline from 0.8740 to retest 0.8610 low. However, break of 0.8718 will resume the rebound from 0.8610 through 0.8740 resistance.
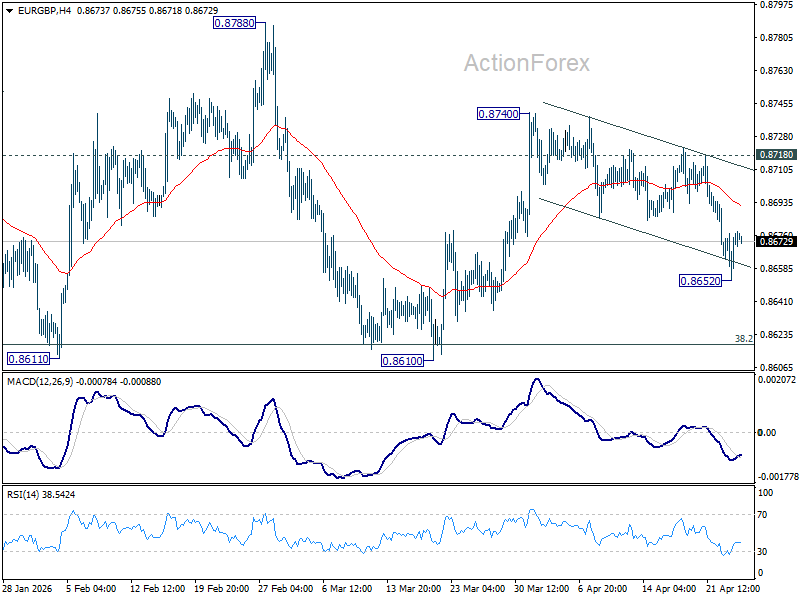
In the bigger picture, strong support was seen again from 38.2% retracement of 0.8821 to 0.8863 at 0.8618. Break of 0.8788 resistance will argue that larger rise from 0.8221 might be ready to resume through 0.8863 (2025 high). Nevertheless, sustained trading below 0.8618 should confirm bearish reversal, and bring deeper fall to 61.8% retracement at 0.8466 at least.