

Sample Category Title
GBP/JPY Weekly Outlook
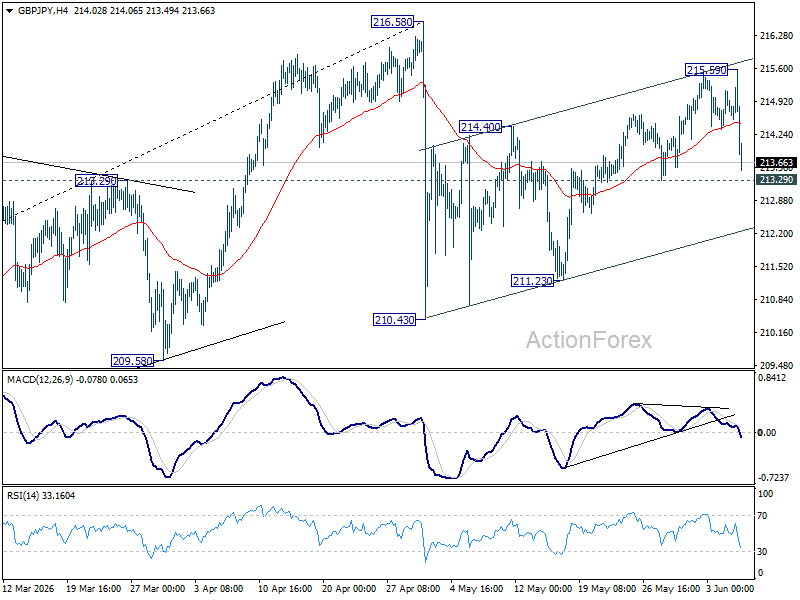
GBP/JPY edged higher to 215.59 last week but retreated sharply since then. Initial bias remains neutral this week first. Rebound from 210.43 is seen as the second leg of the corrective pattern from 216.58, and could have completed at 215.59 already. Break of 213.29 will suggest that the third leg has started and target 210.43 support. For now, risk will be mildly on the downside as long as 215.59 holds, in case of recovery.
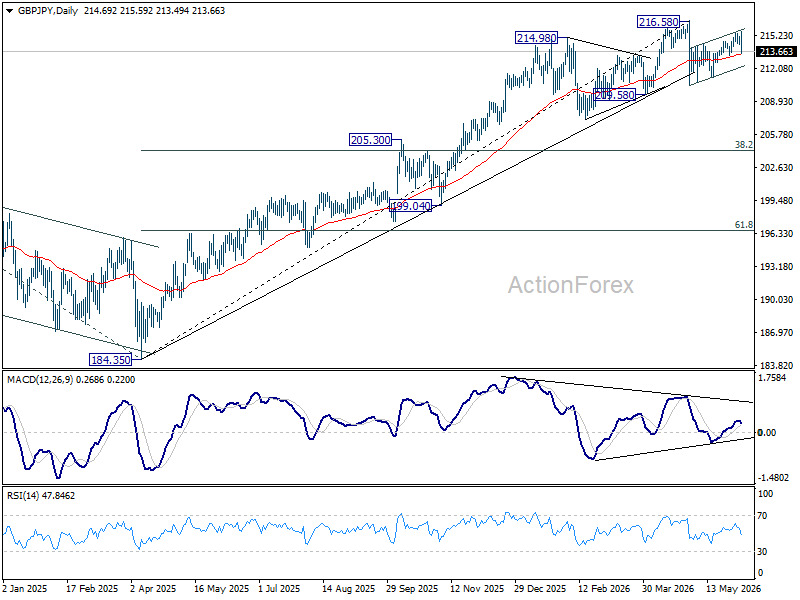
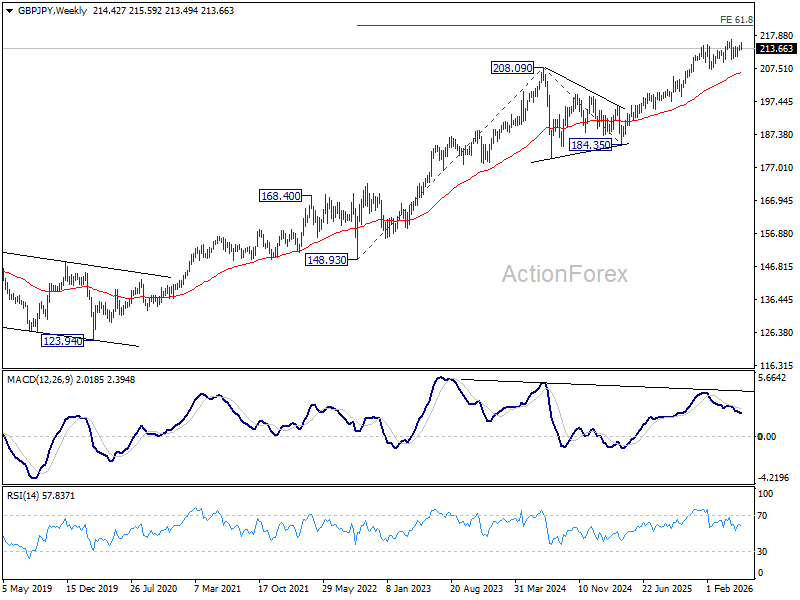
In the bigger picture, there is no clear sign of trend reversal yet. The long term up trend could still extend to 61.8% projection of 148.93 (2022 low) to 208.09 (2024 high) from 184.35 at 220.90 on resumption. However, sustained break of 55 W EMA (now at 206.53) will argue that it's already in medium term down trend for 184.35 support.
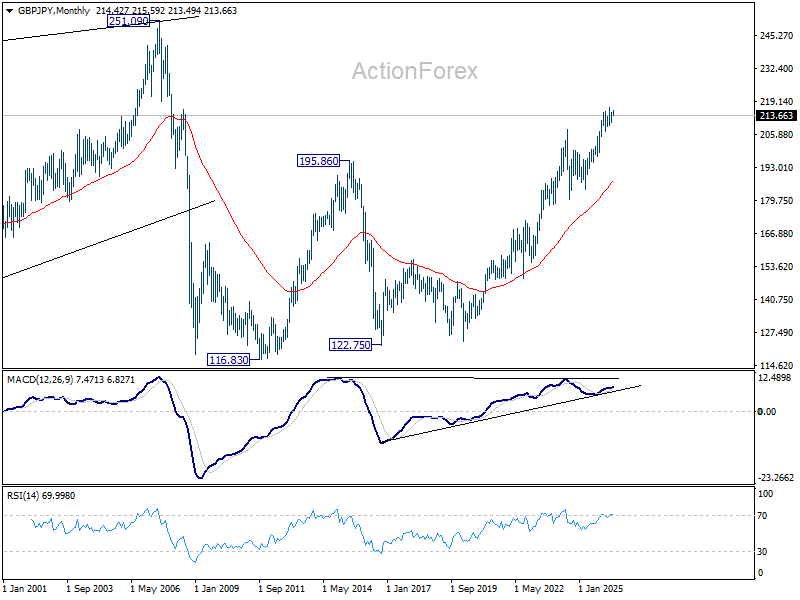
In the long term picture, up trend from 116.83 (2011 low) is in progress. Next target is 251.09 (2007 high). This will remain the favored case as long as 55 M EMA (now at 186.82) holds.
EUR/JPY Weekly Outlook
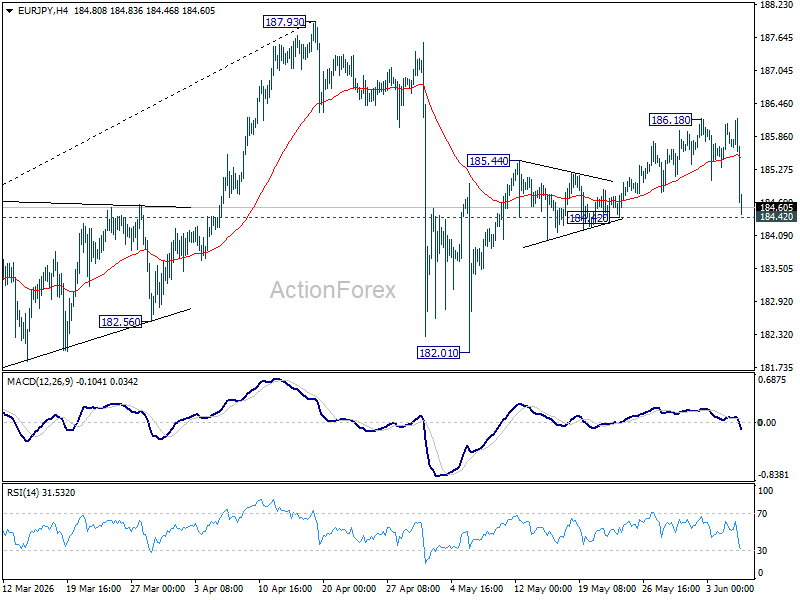
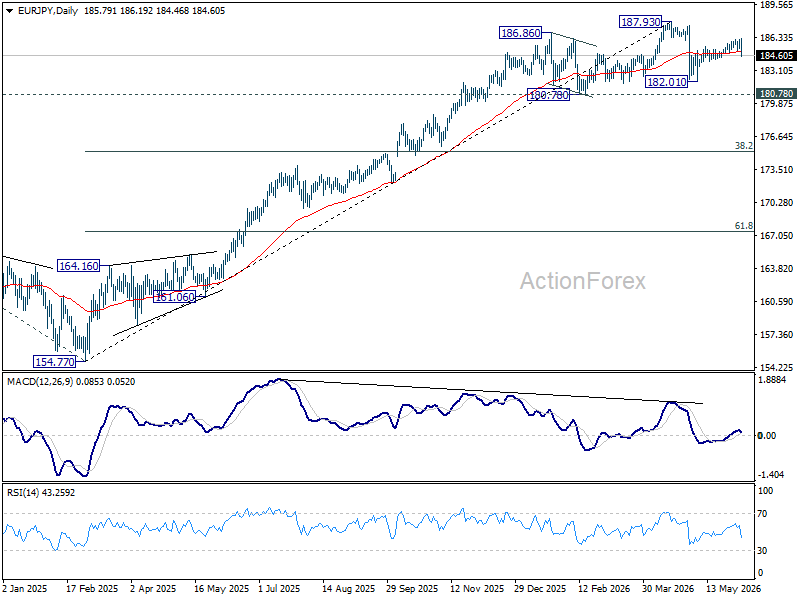
EUR/JPY edged higher to 186.18 but retreated sharply since then. Downside is still supported above 184.42 and initial bias remains neutral this week first. Rebound from 182.01 is seen as the second leg of the corrective pattern from 187.93, and could have completed at 186.18 already. Firm break of 184.42 will argue that the third leg has already started. Intraday bias will be back on the downside for 182.01 support and below. Risk will now stay mildly on the downside as long as 186.18 holds, in case of recovery.
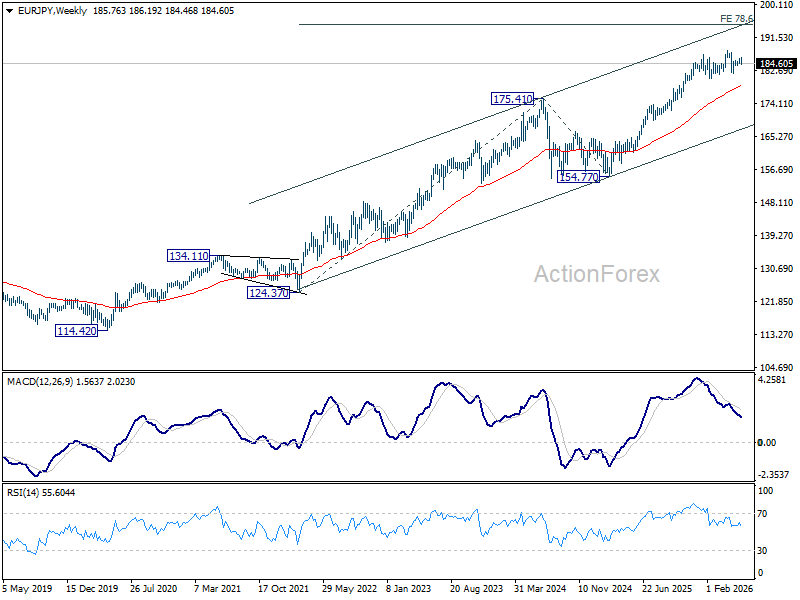
In the bigger picture, there is no sign of reversal yet. Uptrend from 114.42 (2020 low) is still expected to resume at a later stage to 78.6% projection of 124.37 (2022 low) to 175.41 (2025 high) from 154.77 at 194.88. However, sustained break of 55 W EMA (now at 178.53) will argue that it's already in a medium term down trend to 175.41 resistance turned support and below.
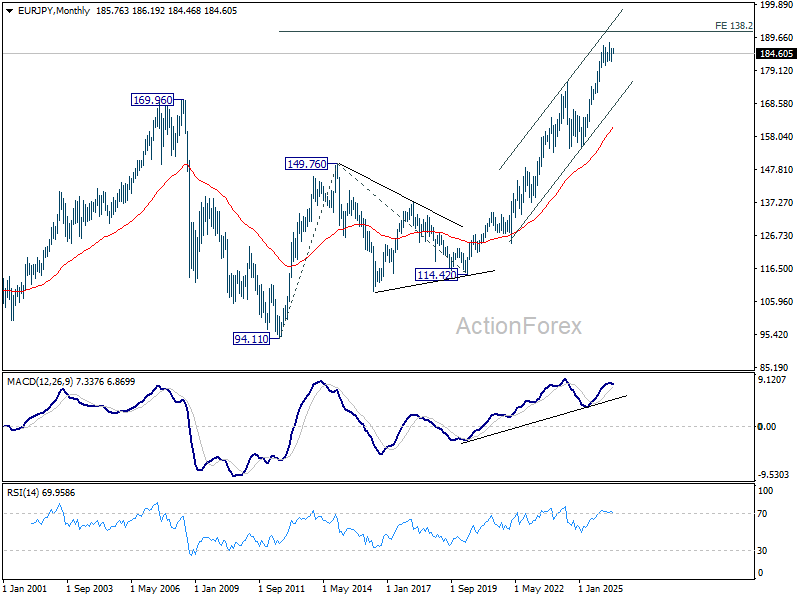
In the long term picture, up trend from 94.11 (2021 low) is in progress. Next target is 138.2% projection of 94.11 to 149.76 (2014 high) from 114.42 (2020 low) at 191.32. This will remain the favored case as long 55 W EMA (now at 178.53) holds.
EUR/GBP Daily Outlook
Sideway trading continues in EUR/GBP and outlook is unchanged. Initial bias stays neutral this week. On the downside, decisive break of 0.8610 support will revive the case of bearish trend reversal. On the upside, break of 0.8728 resistance will bring stronger rally back towards 0.8740 resistance.
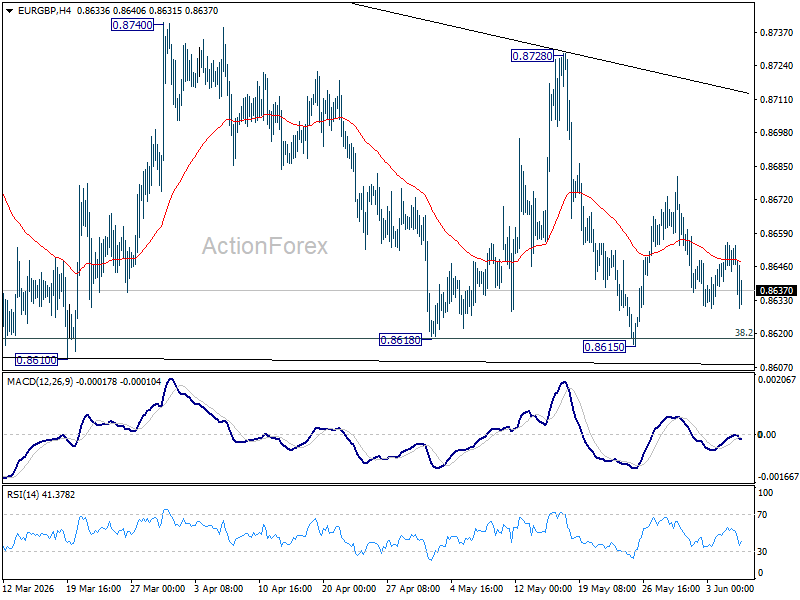
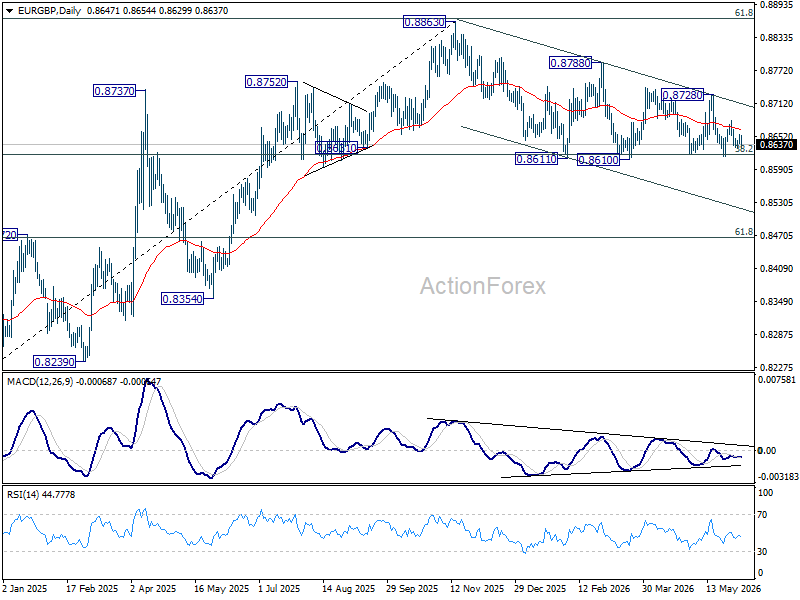
In the bigger picture, focus is staying on 38.2% retracement of 0.8821 to 0.8863 at 0.8618. Strong rebound from there will retain medium term bullishness. Rise from 0.8221 should resume through 0.8863 at a later stage. Nevertheless, sustained break of 0.8618 will confirm that whole rise from 0.8221 has completed at 0.8863. Deeper decline should then be seen to 61.8% retracement at 0.8466 at least.
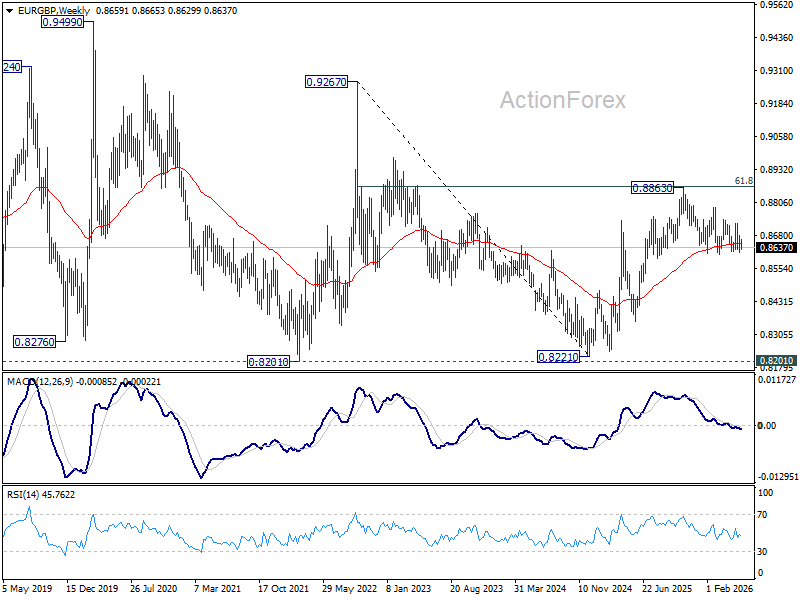
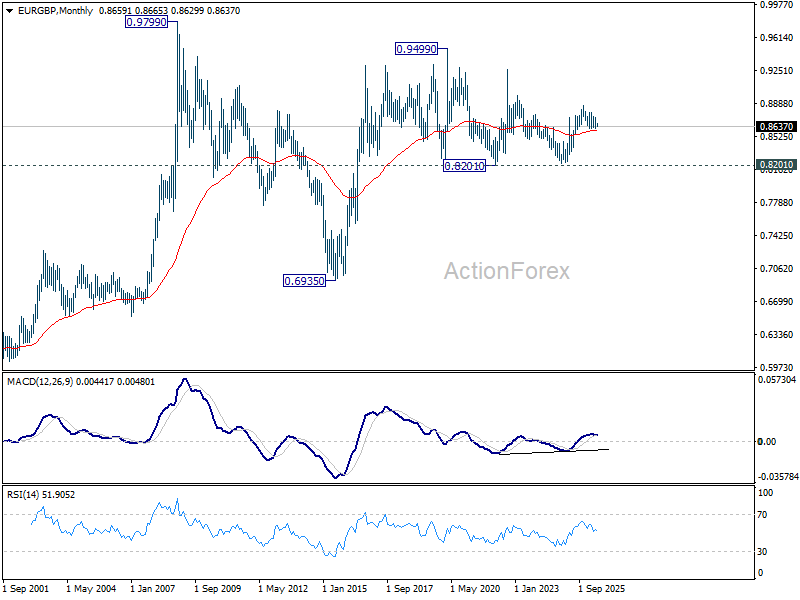
In the long term picture, price action from 0.9499 (2020 high) is seen as part of the long term range pattern from 0.9799 (2008 high). Range trading should continue between 0.8201 and 0.9499, until there is clear signal of imminent breakout.
EUR/AUD Weekly Outlook
EUR/AUD stayed in range below 1.6381 last week. Initial bias remains neutral this week first. On the upside, break of 1.6381 will resume the rebound from 1.6108 short term bottom to 100% projection of 1.6108 to 1.6381 from 1.6186 at 1.6459. Firm break there will pave the way to 161.8% projection at 1.6628. Risk will stay on the upside as long as 1.6186 support holds, in case of retreat.
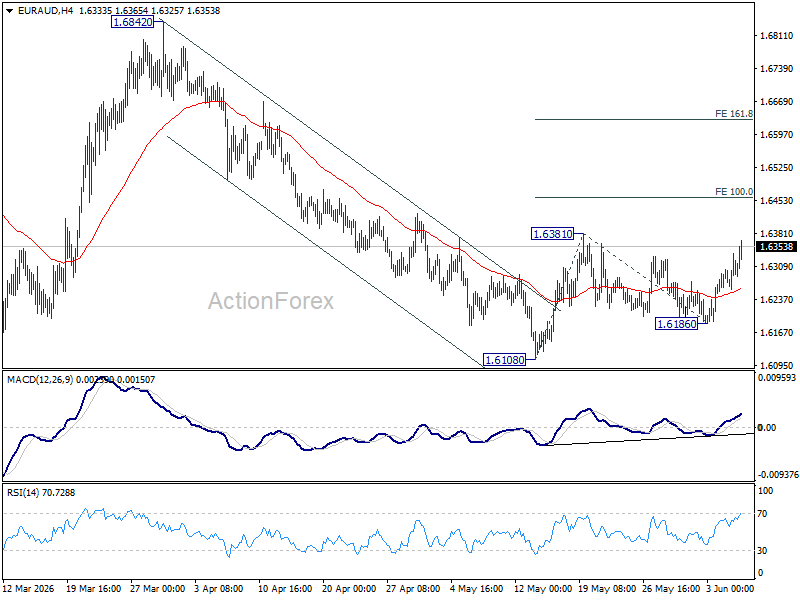
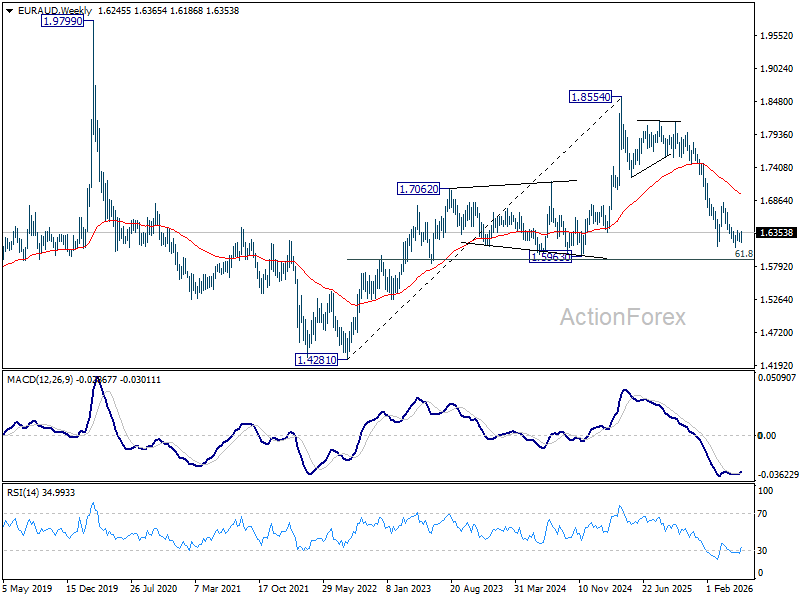
In the bigger picture, outlook will stay bearish as long as 1.6842 resistance holds. Fall from 1.8554 (2025 high) is expected to continue to 61.8% retracement of 1.4281 to 1.8554 at 1.5913. Decisive break there will pave the way back to 1.4281 (2022 low). However, firm break of 1.6842 should confirm medium term bottoming, and bring stronger rally.
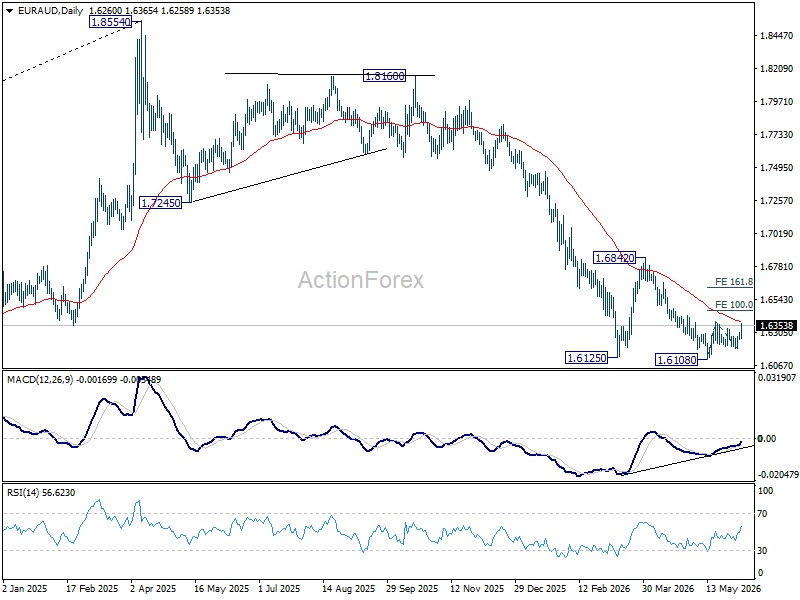
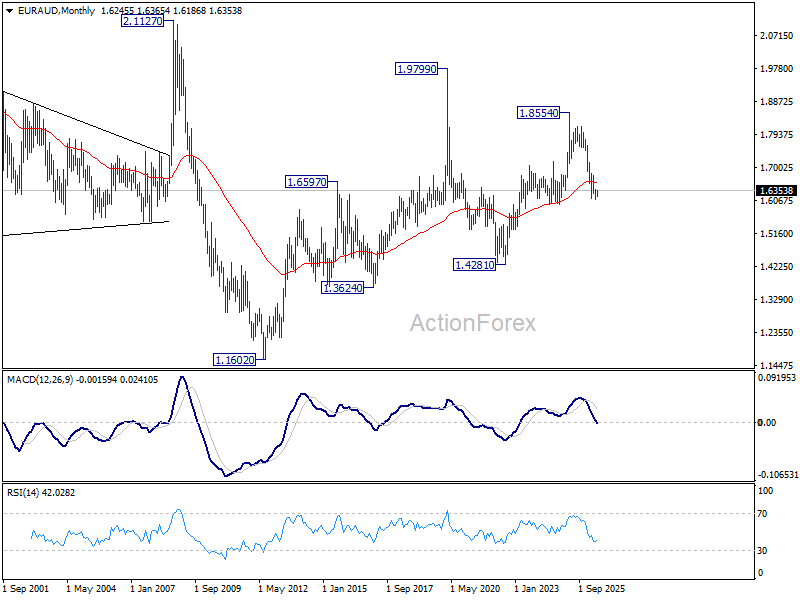
In the longer term picture, fall from 1.8554 is seen as the third leg of the pattern from 1.9799 (2020 high), which is part of the pattern from 2.1127 (2008 high). Sustained trading below 55 M EMA (now at 1.6569) will confirm this bearish case, and pave the way back towards 1.4281.
EUR/CHF Weekly Outlook
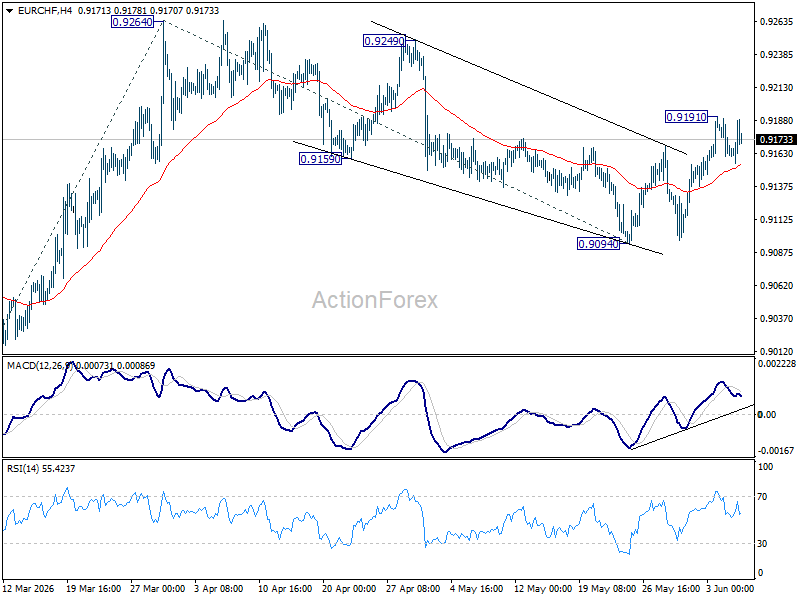
EUR/CHF's extended rebound last week suggests that corrective fall from 0.9264 has completed at 0.9094. But as a temporary top was formed at 0.9191 and initial bias is turned neutral first. Risk will stay on the upside as long as 0.9094 holds. Above 0.9191 will target a test on 0.9264 resistance. Firm break there will resume the rally from 0.8979 to 100% projection of 0.8979 to 0.9264 from 0.9094 at 0.9379.
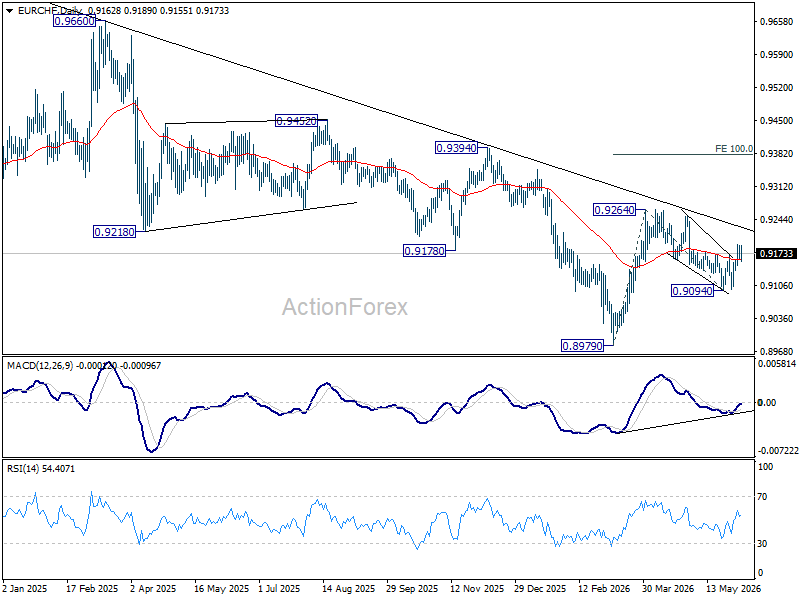
In the bigger picture, as long as 0.9394 resistance holds, down trend from 0.9928 (2024 high) should still be in progress. Firm break of 0.8979 will confirm down trend resumption. However, decisive break of 0.9394 will be an important sign of medium term bullish reversal.
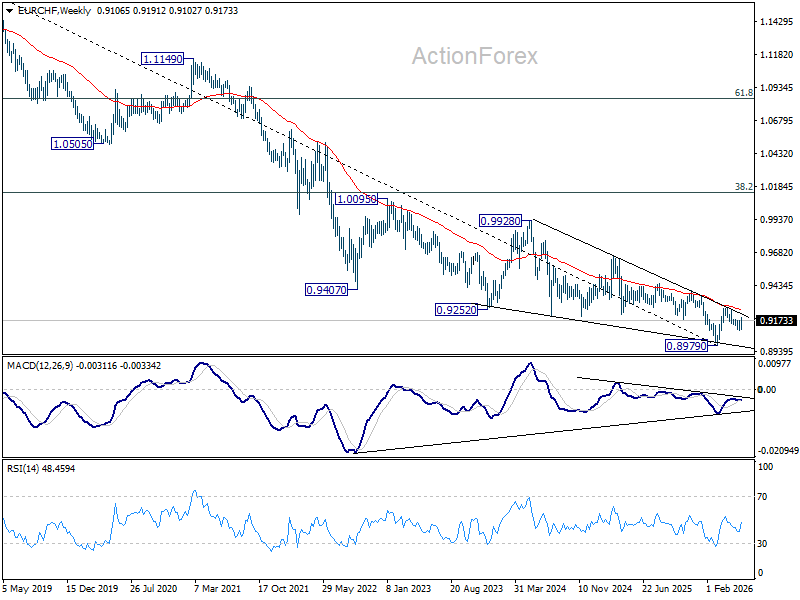
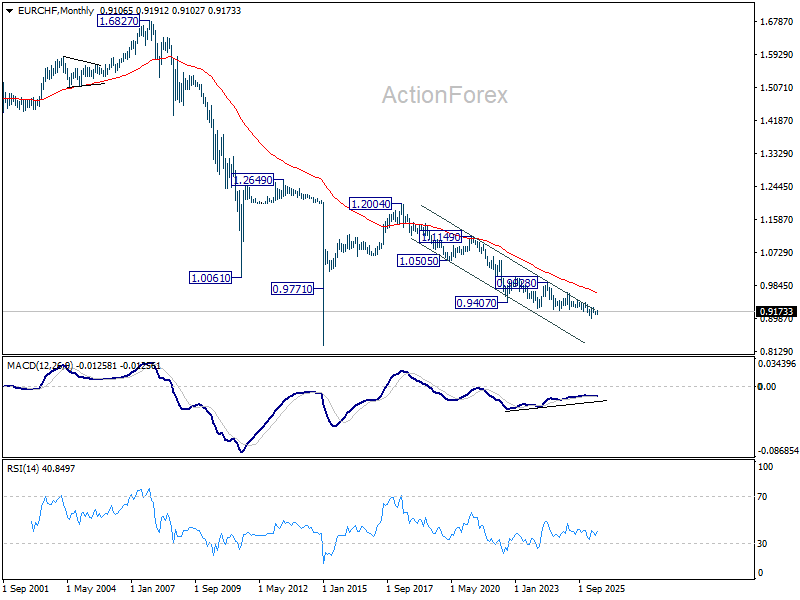
In the long term picture, outlook will stay bearish as long as 0.9407 support turned resistance (2022 low) holds. However, firm break of 0.9407 will argue that the down trend from 1.2004 (2018 high) has completed with five waves down to 0.8979. Stronger rebound should then be seen to 38.2% retracement of 1.2004 to 0.8979 at 1.0135 in the medium term.
The Weekly Bottom Line: Canada’s Economy Stalls Ahead of Trade Negotiations
Canadian Highlights
- Markets swung on hopes of a Middle East truce, but the outlook remains fragile.
- Canada’s economy has stalled out over the past two quarters, with weak domestic demand and patchy investment pointing to subdued momentum.
- The upcoming CUSMA review is now central, as Canada looks to pair greater trade clarity with an energy led investment strategy.
U.S. Highlights
- Renewed hopes of a U.S.-Iran ceasefire extension pushed WTI prices 9% lower this week to $88 per barrel.
- Consumer spending remained resilient in April, amid rising inflationary pressures and dwindling household savings.
- More Fed officials are joining the chorus of sounding increasingly hawkish, with Fed futures 60% priced for a rate hike by year-end.
Canada – Canada’s Economy Stalls Ahead of Trade Negotiations
Hope for a peace deal to end the conflict between Iran and the U.S. and open the Strait of Hormuz dominated markets this week. While optimism around a possible 60-day truce has pushed oil prices sharply lower (down roughly nine percent relative to late last week), volatility remains elevated. Markets continue to respond quickly to shifting headlines, underscoring the fragility of the outlook. For Canada, this volatility comes at a time when market access to the U.S. remains an open question and continues to weigh on domestic activity.
The first quarter GDP report showed the economy effectively stalled (-0.1% quarter-on-quarter annualized, q/q), undershooting expectations. The weakness was broad-based. Strong import growth dragged down the top line figure, but final domestic demand declined again (-0.4% q/q), and continues to proceed in fits and starts (Chart 1). Looking through the volatility final domestic demand is up 1.3% year-on-year (y/y), but this is still a below-trend figure, and consistent with an economy operating below capacity.
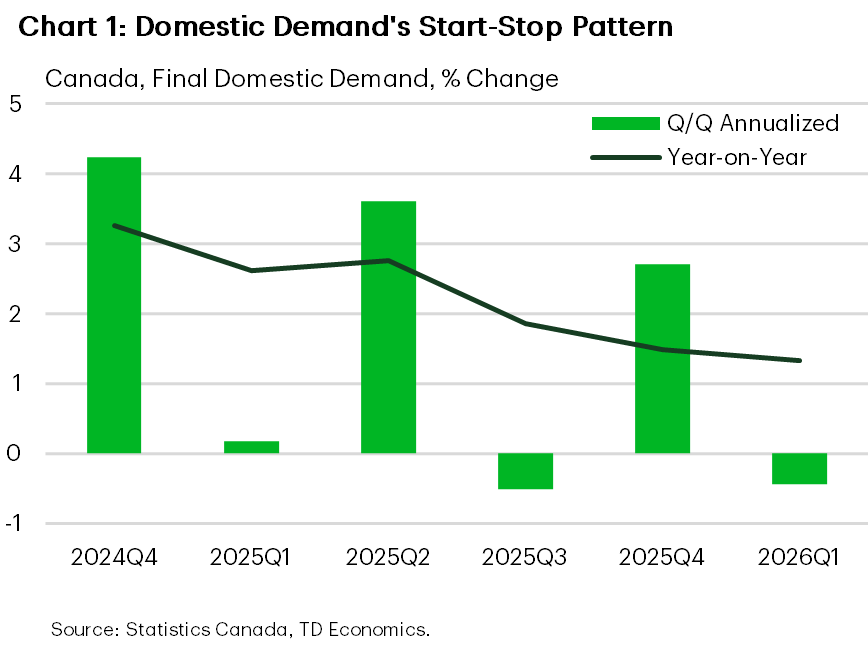
Household spending grew 1.5% q/q, supported by services, but momentum eased from Q4. On the investment side, good growth in machinery, equipment and intellectual property products were offset by another large contraction in residential investment (-7.9% q/q) and weaker outlays on engineering structures. Government investment also reversed after gains in late 2025.
Overall, the economy continues to muddle along with limited forward momentum. While early Q2 indicators suggest some rebound (with April GDP tracking higher), the broader trend still points to slack in the economy and subdued growth.
Canada’s lackluster growth performance puts the focus squarely on the upcoming CUSMA review. The economy has operated under the cloud of uncertain U.S. market access ever since the first tranche of tariffs were announced last year. On Monday the three countries are due to notify each other of what changes they want in the agreement, with discussions to follow. The United States and Mexico have already scheduled formal negotiating rounds. Minister for U.S.-Canada Trade Dominic Leblanc is expected to travel to Washington next week, but the timelines for negotiations remain unclear.
To find some insights on the negotiations, Prime Minister Mark Carney’s speech in New York this week highlighted Canada’s strategy. He called for a “new partnership” with the United States, while simultaneously positioning Canada’s goal to establish itself as “an energy superpower”.
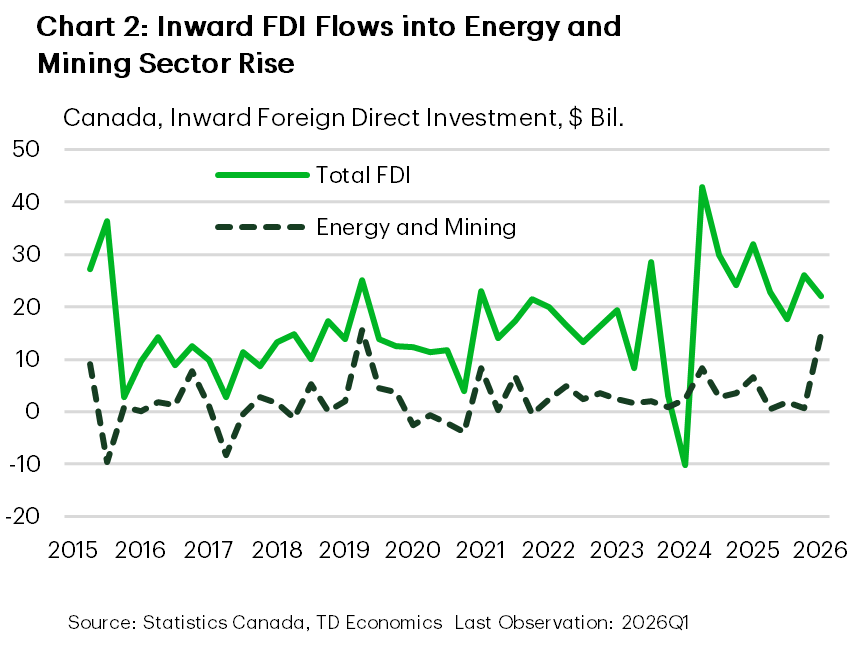
Recent foreign direct investment data suggest there might be something to the strategy. First quarter inflows were reported at $22 billion ($4 billion less than in Q4), and investments in the energy and mining sector were $14.7 billion in the quarter (Chart 2). While these data are volatile, they align with Canada’s strategy to leverage its resource base and attract long-term capital.
The Canadian economy continues to muddle along under a cloud of trade uncertainty. The hope is that in the coming months, clarity and stability on the trade relationship with the U.S. emerges. Increased economic certainty, together with the push to attract global capital to invest in Canada, can lay the foundation for productivity-powered economic growth.
U.S. – Makings of a Deal
It’s been three months since the U.S. and Israel launched the initial attack on Iran. Hopes for a longer-term peace resolution rose this week following President Trump’s comments that a peace deal had been “largely negotiated”. Oil prices fell sharply on the news, though renewed attacks from both sides by mid-week briefly faded the optimism. But by Thursday evening, news outlines were reporting that the two sides had reached an agreement on a 60-day memorandum of understanding to extend the ceasefire, pending President Trump’s approval. Oil prices traded 9% lower on the week and the WTI benchmark currently sits at $88 per barrel. Meanwhile, economic data out this week reinforced a more cautious but still resilient consumer amid renewed inflationary pressures. The S&P 500 edged 1.3% higher on the week, while the 10-Year Treasury yield drifted lower by 12 basis points and currently sits at 4.44%.
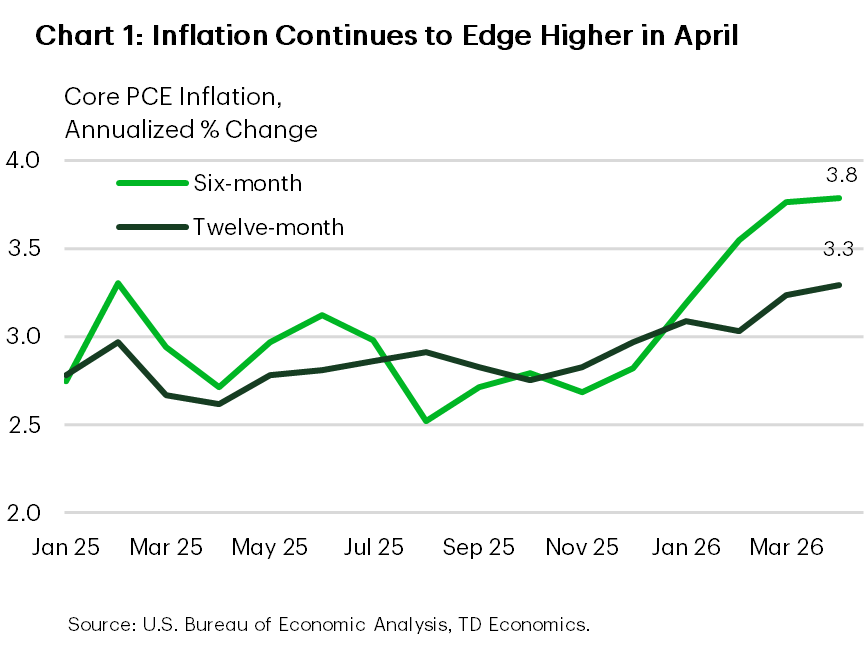
This week’s release of the April personal income & spending data offered a fresh dose of reality on the pain being inflicted on American households because of the energy shock. PCE inflation rose to a three-year high of 3.8% year-on-year and is likely to push north of 4% in May alongside a continued rise in gasoline prices. The picture didn’t look much better once the effects of food & energy were removed, with core PCE inflation edging up to 3.3%. Three-and-six-month measures are even hotter, each up 3.8% (Chart 1).
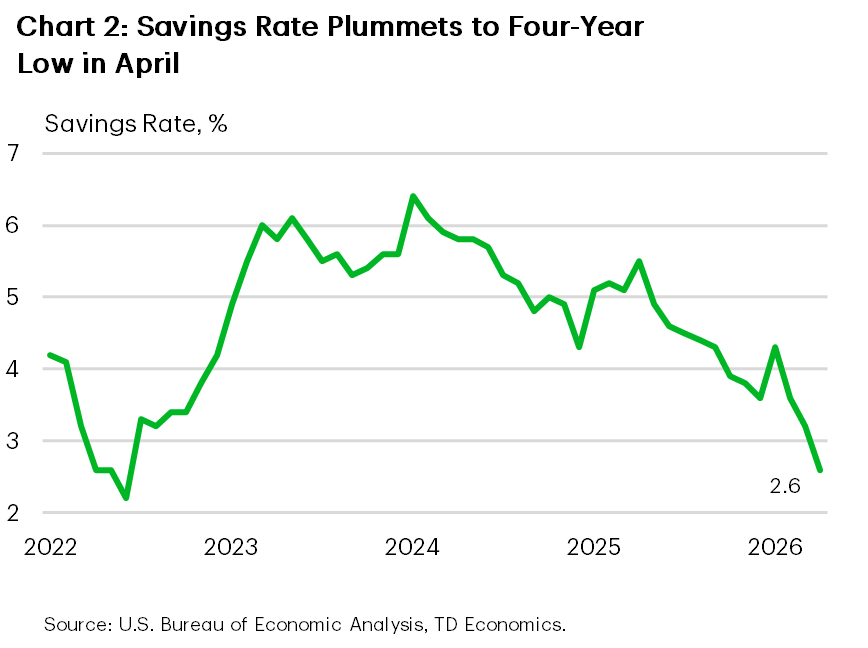
Despite the rise in inflation, the consumer has remained reasonably resilient. Nominal spending rose 0.5% m/m in April, following a stronger gain of 1% in March. After accounting for inflation, April’s gain looked less stellar, but still edged higher by 0.1% m/m. Hotter inflation is also working to erode consumer purchasing power, with real disposable income declining for a third consecutive month. This has left households increasingly reliant on savings to fuel spending. But with the savings rate having slipped to a four-year low, the buffer is looking increasingly thin.
According to a recent survey conducted by the Conference Board, households are reporting softer spending intentions in the months ahead. Fewer households are planning to purchase big-ticket items while two-thirds of consumers plan to reduce overall spending due to higher prices. While the survey metrics have been a less reliable predictor of actual spending post-pandemic, we can’t completely disregard the signal. The energy shock has further strained affordability for lower-and-middle income households, who have not benefited to the same degree from past year’s gains in home and equity prices.
And there’s an increasing risk that affordability pressures could worsen if the energy shock is sustained much longer. A growing chorus of Fed officials are sounding increasingly hawkish amid rising inflationary pressures. Board member Lisa Cook said this week that if disinflation doesn’t soon resume, she would be “prepared to raise rates”. Meanwhile, Fed President Kashkari reiterated that the inflation fight takes priority as the labor market now appears to be in decent shape. This suggests next week’s employment report will play second fiddle to the May CPI numbers due on June 10th. Fed futures are now 60% priced for a rate hike by year-end, but a hotter inflation report could pull forward expectations for a rate hike.
Bitcoin Deepens Losses as Crypto Market Comes Under Pressure
- Bitcoin is under strong selling pressure, falling over 17% in a week and dropping below USD 60,000. The decline was intensified by USD 532 million in long liquidations on Binance, which triggered additional forced selling.
- Market sentiment worsened after Strategy sold part of its bitcoin holdings. Although the sale was small — 32 BTC for USD 2.5 million — it raised concerns that the largest corporate bitcoin holder could make further sales in the future.
- The broader crypto market is weak due to macro and demand concerns. Strong U.S. labor data reduced hopes for rate cuts, retail investors are shifting toward AI-related tech stocks, ETF inflows remain too small to support prices, and security concerns after the Zcash vulnerability further damaged trust.
Bitcoin has come under heavy selling pressure and has already lost more than 17 percent since the beginning of the week. On Friday, its price fell below the psychological barrier of USD 60,000, increasing investor concerns about a further deepening of the correction. Bitcoin has fallen below its 200-week SMA for the first time in three years. From its all-time high near USD 126,000, the leading cryptocurrency has already lost more than half of its value.
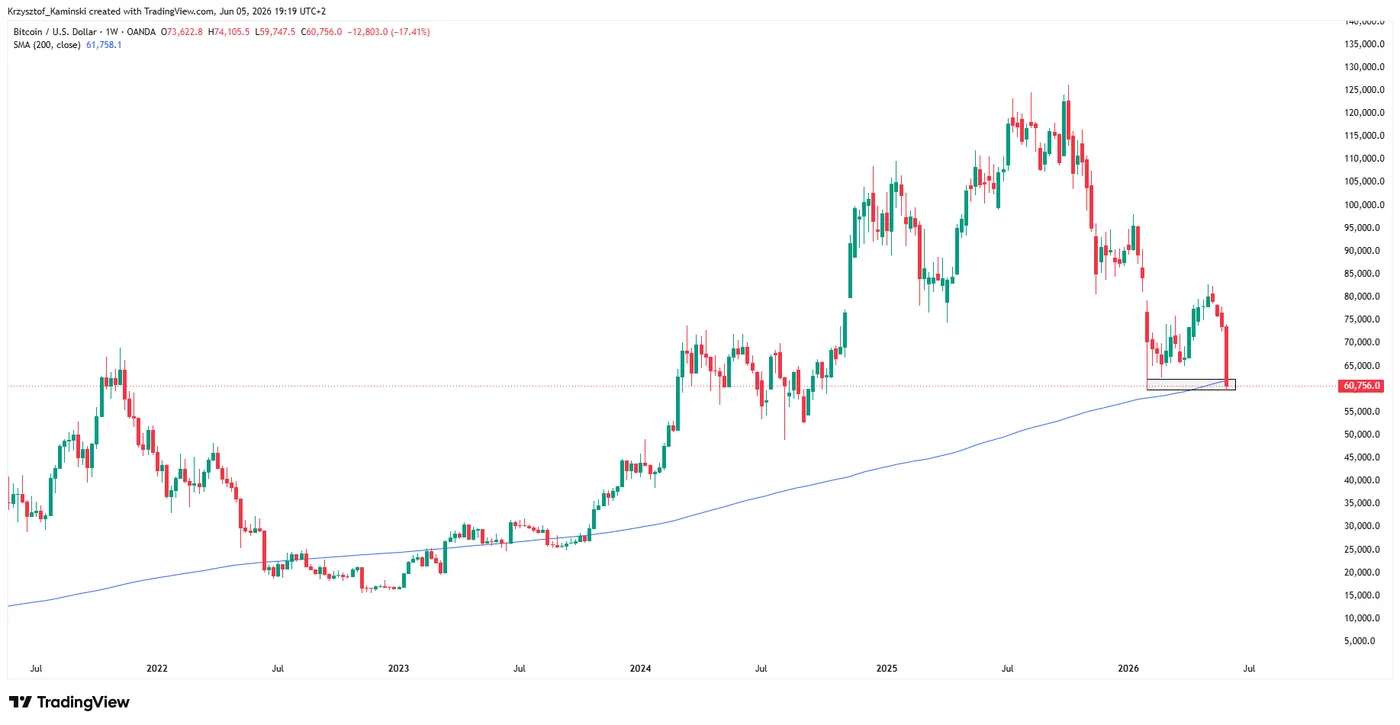
Weekly timeframe of Bitcoin, source: TradingView
Long liquidations increase pressure on the market
The scale of the declines was amplified by the forced closure of leveraged positions. Over the past 24 hours, long positions worth USD 532 million were liquidated on the Binance exchange. Such a large wave of liquidations shows that many investors betting on a bitcoin rebound were forced to close their positions, which further increased selling pressure in the market.
This mechanism often deepens declines, as automatic liquidations lead to further sell orders. As a result, the market can move more sharply than would be implied solely by incoming macroeconomic data or the decisions of the largest investors.
Strategy’s Bitcoin sale weighed on sentiment
One of the factors worsening sentiment was the news that Strategy, the largest corporate holder of bitcoin and a company associated with Michael Saylor, had sold part of its bitcoin holdings. The company sold 32 bitcoins for USD 2.5 million. Although the transaction was small compared with the company’s overall portfolio, it carried significant symbolic weight.
It was only Strategy’s second bitcoin sale since it began making purchases in 2020. The company explained the decision as necessary to pay coupons to holders of preferred shares, but investors interpreted it as a possible weakening of the long-standing narrative of holding bitcoin indefinitely.
The market is primarily concerned that this small sale could foreshadow further, larger transactions in the future. This risk was highlighted by Peter Schiff, a well-known bitcoin critic, who stressed that the problem is not the scale of the current sale itself, but its potential consequences for investor confidence. Before this transaction, Strategy had reportedly purchased a total of 843,738 BTC for nearly USD 64 billion, which is why any change in the company’s strategy is being closely watched by the market.
Declines spread across the entire cryptocurrency market
Selling pressure was not limited to bitcoin. Ethereum fell by around 23 percent over the week to USD 1,555, while Solana lost about 22 percent, dropping to USD 63.75. Weakness was also visible in shares of companies linked to cryptocurrencies. Strategy’s stock fell by almost 10 percent, while Coinbase shares declined by 8.4 percent.
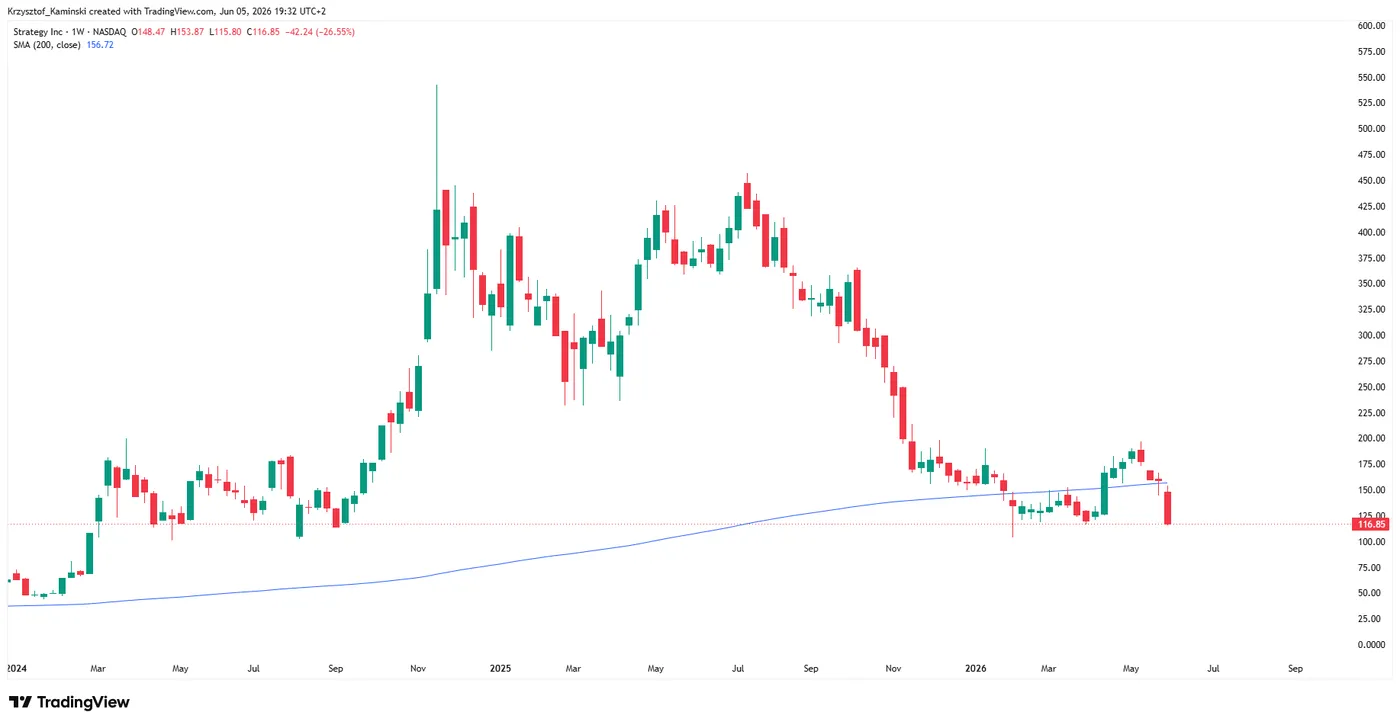
Weekly timeframe of Strategy (MSTR), source: TradingView
A modest positive signal came from inflows into U.S. spot bitcoin ETFs yesterday after 13 days of outflows. However, the scale of these inflows, amounting to just over USD 3 million, was too small to change the overall market picture. In practice, this means that institutional demand remains too weak to effectively stop the current sell-off.
Strong U.S. Data reduces hopes for rate cuts
Sentiment was also hurt by strong data from the U.S. labor market. Nonfarm payrolls rose by 172,000 in May, clearly above expectations. Such data reduces the likelihood of swift interest rate cuts in the United States, which is unfavorable for risk assets, including cryptocurrencies.
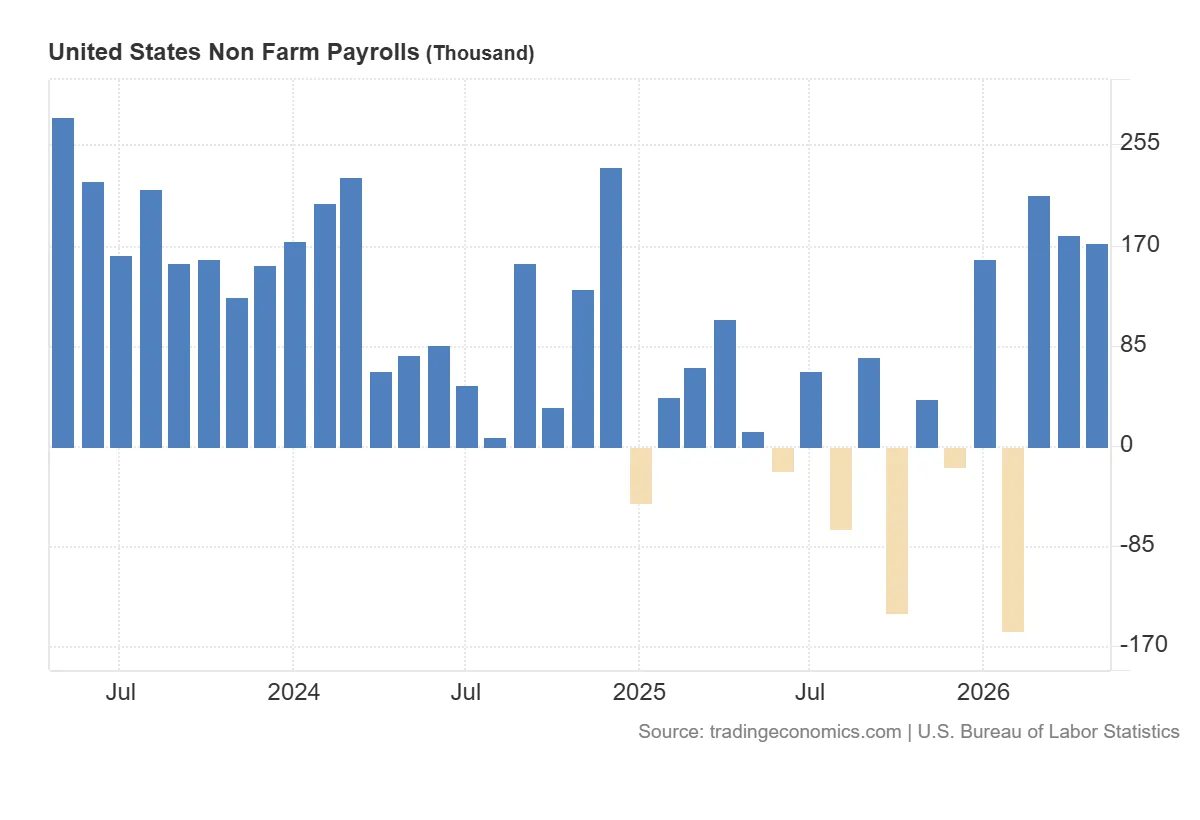
Monthly change in United States Non Farm Payrolls, source: Trading Economics
The strong labor market report weakened the narrative of imminent monetary policy easing, while bitcoin currently lacks a clear macroeconomic catalyst that could support a rebound.
Retail investors shift their attention to tech stocks
An additional problem for the crypto market is the outflow of some retail investors toward technology stocks, especially companies linked to artificial intelligence. Retail investors have largely left the cryptocurrency market and returned to equities, making it difficult to identify new sources of demand for bitcoin.
In an environment of weakening interest and a lack of fresh capital, every negative piece of news can trigger a stronger price reaction. This applies both to macroeconomic data and to decisions by major entities holding significant bitcoin reserves.
Security issues weaken trust in Crypto
The cryptocurrency market is also struggling with concerns over trust in the security of blockchain technology. Investors paid particular attention to a vulnerability in the Zcash network, after which the cryptocurrency’s price fell by more than 40 percent in a single day. Developers fixed the bug, but they were unable to clearly determine whether it had been exploited to create additional tokens.
This situation increased concerns that increasingly advanced artificial intelligence models may in the future help detect similar vulnerabilities in other cryptocurrency projects. For a market already under downward pressure, such information further worsens sentiment.
Lack of new sources of demand makes a rebound difficult
The current sell-off in bitcoin is the result of several negative factors overlapping: strong U.S. economic data, reduced expectations for interest rate cuts, investors shifting toward technology stocks, concerns about Strategy’s future actions, trust issues related to the security of some crypto projects, and the large scale of long liquidations in the leveraged instruments market.
Bitcoin remains under pressure, and the lack of clear new sources of demand means that a quick and sustained rebound may be difficult. The market appears weakened, and investors are watching increasingly closely to see whether the drop below USD 60,000 proves to be only a brief breach of an important level or a continuation of the downward trend that began in October 2025.
Economics Week Ahead
U.S. inflation is showing renewed upward pressure, with our expectations for May CPI to rise 0.5% and the year‑over‑year rate pushing to 4.2%, largely driven by an 8% surge in energy goods and firmer food prices. We believe core inflation will be 0.2% as goods stabilize and services stay broadly steady outside of pockets like airfares. In the Eurozone, inflation is broadening more decisively, with high three‑month annualized rates and firming pressures across both services and goods likely prompting the ECB to begin a tightening cycle, starting with a 25bp hike and maintaining a hawkish bias. In Canada, the Bank of Canada is likely to hold rates at 2.25% in the near term, balancing softer recent growth and core inflation against still supportive commodity dynamics and tight labor supply, leaving the policy path tilted toward gradual future hikes. In Brazil, inflation is moving further above target, with our expectations for headline nearing 4.7% as price pressures shift from energy toward food, complicating the outlook and raising the likelihood that easing gives way to a pause as inflation risks intensify.
United States:
- CPI (Wednesday)
G10 Economies:
- ECB Policy Rate (Thursday), Bank of Canada Policy Rate (Wednesday)
Emerging Markets:
- Brazil CPI (Friday)
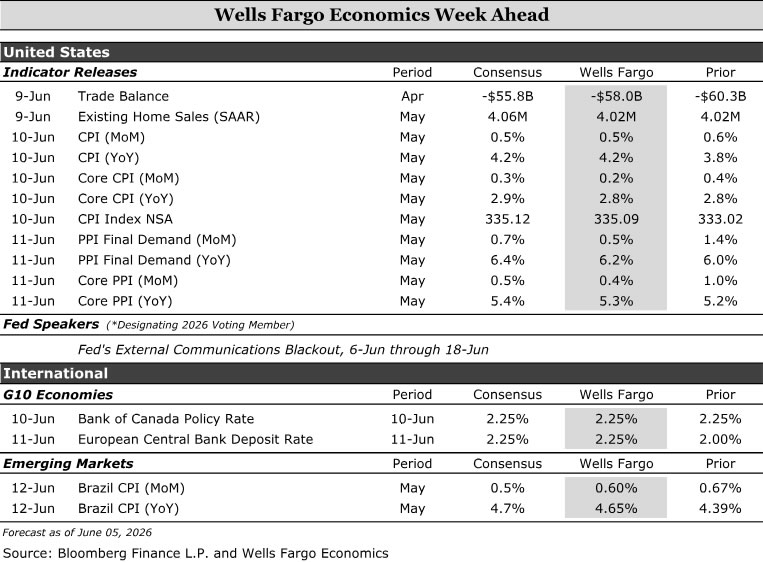
U.S. Week Ahead
CPI • Wednesday
The inflationary effects of the Iran conflict continue to ripple through consumer prices. We estimate the Consumer Price Index rose 0.52% in May, which would push the year-over-year rate up to a three-year high of 4.2%. Higher costs of necessities continue to pinch consumers. We estimate energy goods (primarily gasoline) rose 8% in May, while food prices advanced 0.3%.
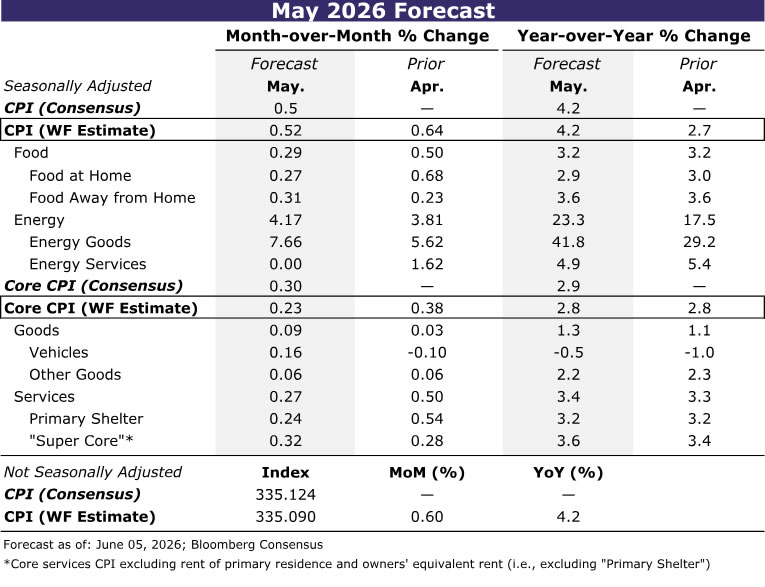
Excluding food and energy, we estimate prices rose a more moderate 0.23%. Core good prices look set for a modest pickup in May thanks to a lift from used autos, as the CPI index has yet to reflect the pickup in wholesale auction prices since the start of the year. Inflation among other goods, however, is likely to have eased slightly as tariff-related price hikes ebb and the Iran conflict's second-round effects on costs for transportation, packaging, etc. are slow to filter into retail prices.
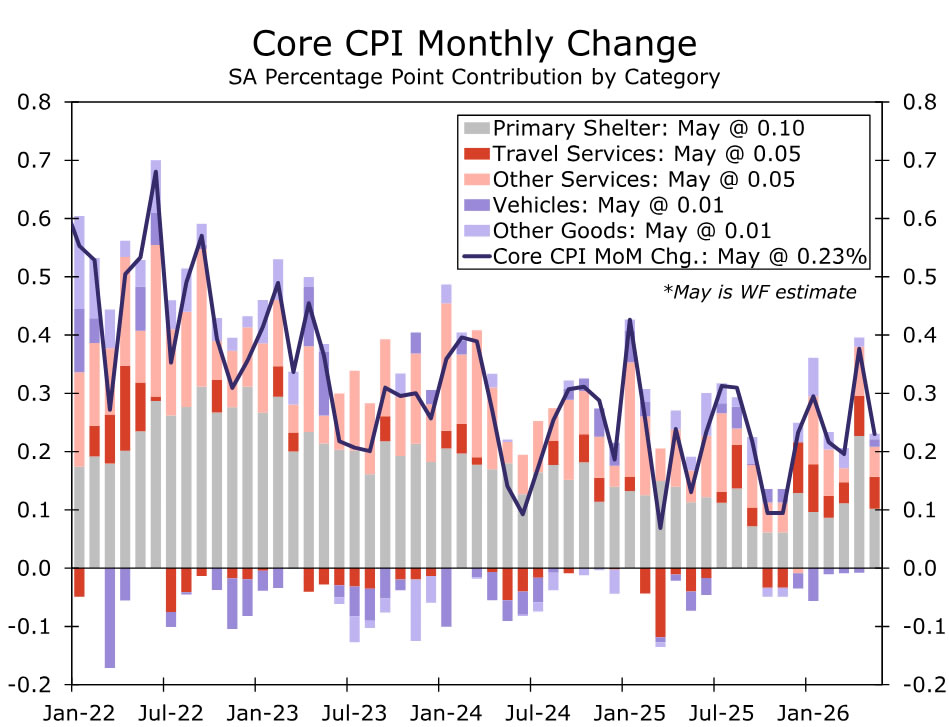
One area of the core in which the impact of the Iran conflict should be readily apparent though is airline fares. The surge in jet fuel costs since early March along with the bankruptcy of Spirit Airline's set the stage for another solid rise (we've penciled in an increase of 3%). But we do not expect to see a broad re-acceleration in price growth across remaining services. Primary shelter looks to set to revert to its 0.2-0.3% monthly pace following April's "catch up" reading that was a lingering quirk of the government not collecting data last October during the shutdown. Meantime, a rebound in medical care is likely to be mostly offset by weakness in motor vehicle insurance and personal services, keeping the six-month pace of core services ex-shelter and travel unchanged at 2.5% and in line with its pre-COVID pace.
G10 Week Ahead
ECB Monetary Policy Meeting • Thursday
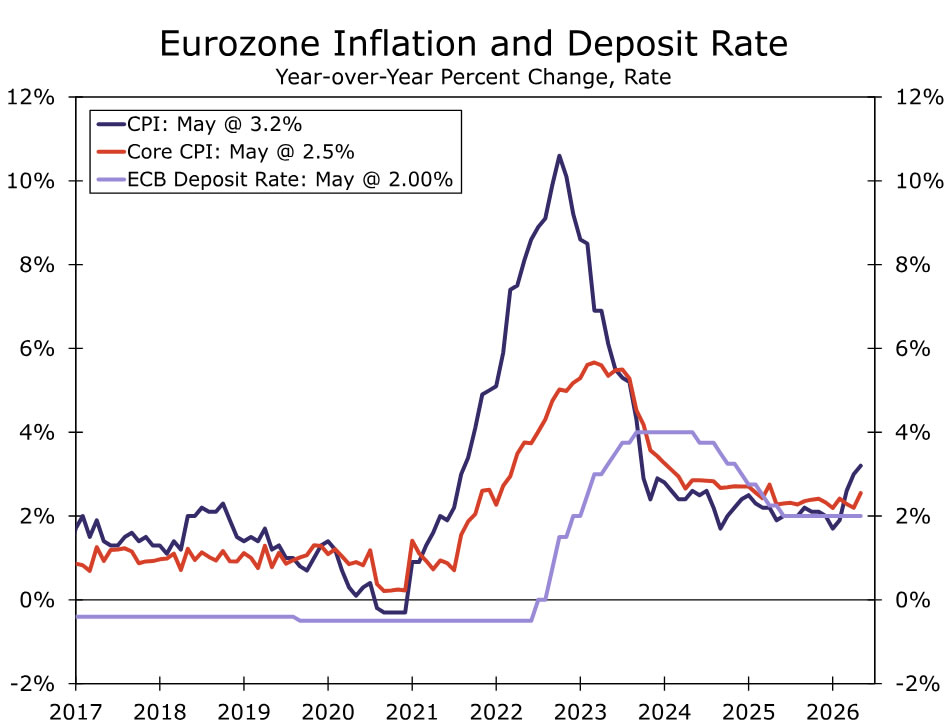
We expect the ECB to hike rates by 25bp next week, taking the deposit rate to 2.25% and the main refinancing rate to 2.40%. The macro backdrop has evolved broadly in line with the ECB’s March adverse scenario. Shipping disruptions persist, energy inventories are being drawn down, and prices remain elevated despite ongoing volatility. The May flash CPI reinforces the inflation story, pointing to both acceleration and broadening pressures. Three‑month annualized headline and core inflation now stand at 9.6% and 8%, respectively, well above the 3.2% and 2.5% year‑over‑year rates. Beyond energy, price pressures have firmed across services and non‑energy industrial goods over the past 3 months.
Against this backdrop, we expect a hawkish signal from the ECB, emphasizing the need to cool demand to limit second‑round effects. This should be reflected in updated staff projections and refreshed scenario analysis, likely incorporating more severe assumptions given that the previous adverse scenario now resembles the baseline. June should mark the start of the hiking cycle, with at least one additional move in Q3, likely in July.
Bank of Canada Monetary Policy Meeting • Wednesday
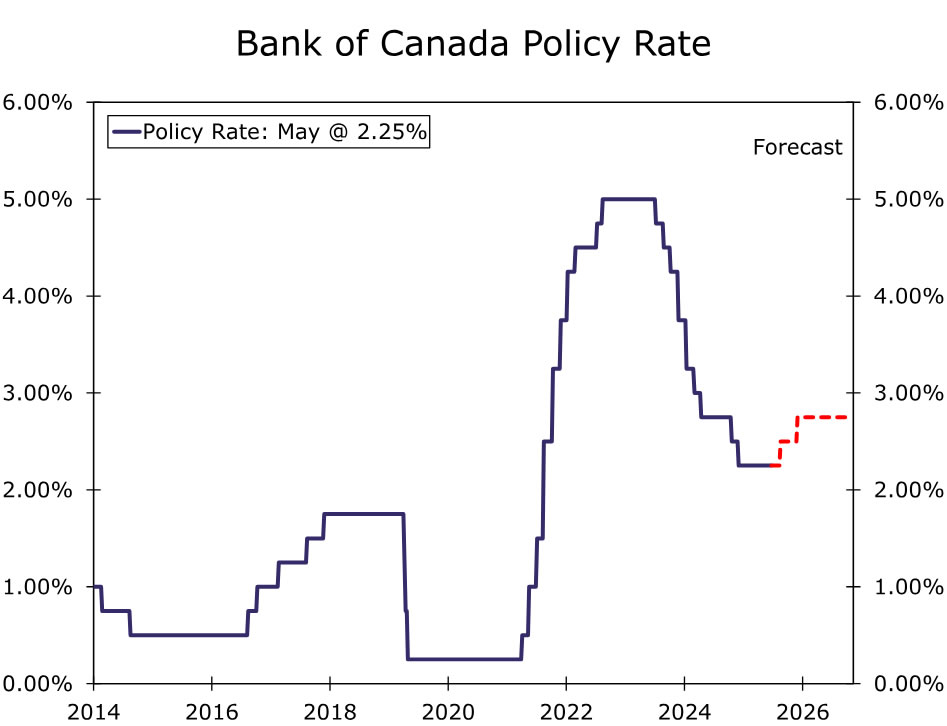
We expect the BoC to remain on hold next week, keeping the policy rate at 2.25%. Our baseline expectation remains for a July hike, although our conviction has declined with the weaker‑than‑expected Q1 GDP print and near‑term softness in core inflation. We continue to expect an additional hike in Q4, leaving the policy path biased toward higher rates over the coming months.
Elevated energy and commodity prices should act as an inflationary tailwind for Canada, supporting both consumer demand and labor markets through resource‑linked activity. At the same time, labor supply constraints remain binding. An aging workforce and softer immigration flows continue to weigh on participation, likely keeping the unemployment rate low and underpinning wage growth. In this context, we see core inflation as having bottomed, with risks tilted to the upside.
The July 1 USMCA review looms large. Our baseline assumes a shift to an annual review process within the existing framework. This extends medium‑term uncertainty and may weigh on business investment, but preserves low‑tariff access and limits the near‑term economic impact.
EM Week Ahead
Brazil May CPI • Friday
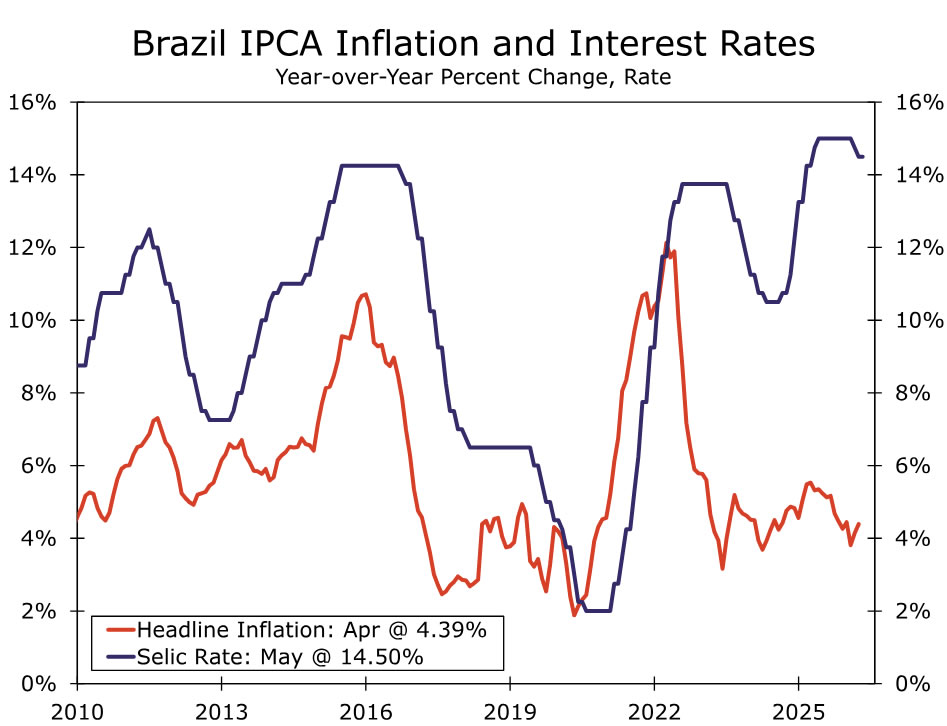
We look for May IPCA inflation to accelerate to 4.65% y/y from 4.39%, moving above the upper bound of the BCB’s 4.5% target band. While m/m inflation likely moderates to 0.6% from 0.67%, the broader inflation outlook remains firmly skewed to the upside.
Global supply chain disruptions are set to persist, with price pressures likely rotating from energy toward food in the coming months. This is particularly relevant for Brazil, where food carries a higher weight in the CPI basket than in advanced economies. At the same time, we expect fiscal policy to continue supporting demand, partially offsetting the drag from eroding real incomes and tighter monetary conditions. The policy mix is likely to remain pro‑growth, especially in an election year.
Rising US‑Brazil tensions may further bolster Lula’s political support, potentially providing cover for additional populist measures. Against this backdrop, while we expect the BCB to deliver a rate cut in June, we see scope for a pause in Q3 as inflation dynamics deteriorate and external and domestic pressures intensify.
Bank of Canada to Hold Interest Rates as Prices Rise But Economy Wobbles
We have some key data releases in the week ahead, but the focus will be on the Bank of Canada’s decision on interest rates on Wednesday where we expect a fifth consecutive hold.
The surge in oil prices has sent inflation back above the central bank’s 2% target. But, there is nothing the BoC can do about global oil prices, and there’s little evidence so far that higher energy prices are filtering into broader measures of underlying inflation. The BoC’s preferred core inflation measures surprised broadly to the downside in April.
And, growth has also surprised in the same direction. Gross Domestic Product marked a second consecutive quarterly decline, edging down 0.1% annualized in Q1—well below the BoC’s April estimate for a 1.5% increase, building on a 1% decline in Q4.
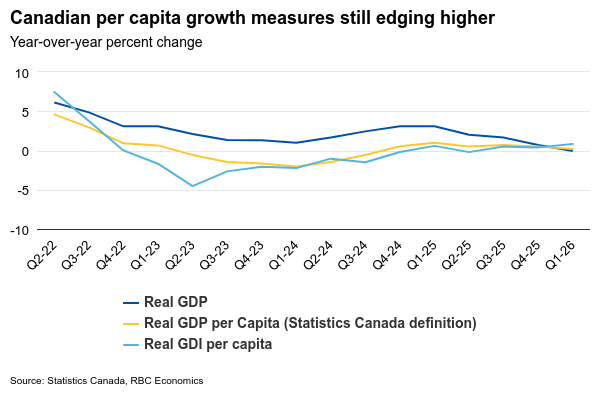
We continue to think the broader Canadian growth backdrop is more resilient than implied by headline GDP readings. Controlling for a sharp slowing in population, per-capita GDP increased in Q1, and overall consumer spending advanced a solid 1.5%.
Higher oil prices are raising consumer costs, but they are also increasing revenue flowing into the economy. During past periods of large changes in oil prices, the BoC put more emphasis on real gross domestic income—essentially the amount of goods/services that can be purchased with domestic production. That measure rose 2.7% in Q1, because a spike in oil prices means a larger quantity of imports can be purchased with the same quantity of exports.
The unemployment rate in May was 6.6%, down from 6.9% in April but still elevated. Critically, layoffs have continued to decline, but hiring demand has been soft with new labour market entrants still struggling to find work. Hours worked rose 0.6% in May after remaining flat in April, suggesting labour market conditions are improving gradually rather than deteriorating.
That said, there have been enough cracks in growth and labour market data for the BoC to remain cautious about changing policy rates too quickly in one direction or another. We continue to expect the BoC to remain on hold for the rest of 2026 with our current base case forecast expecting the next move to be a hike, but not until 2027 and contingent on growth and the labour market improving into year end.
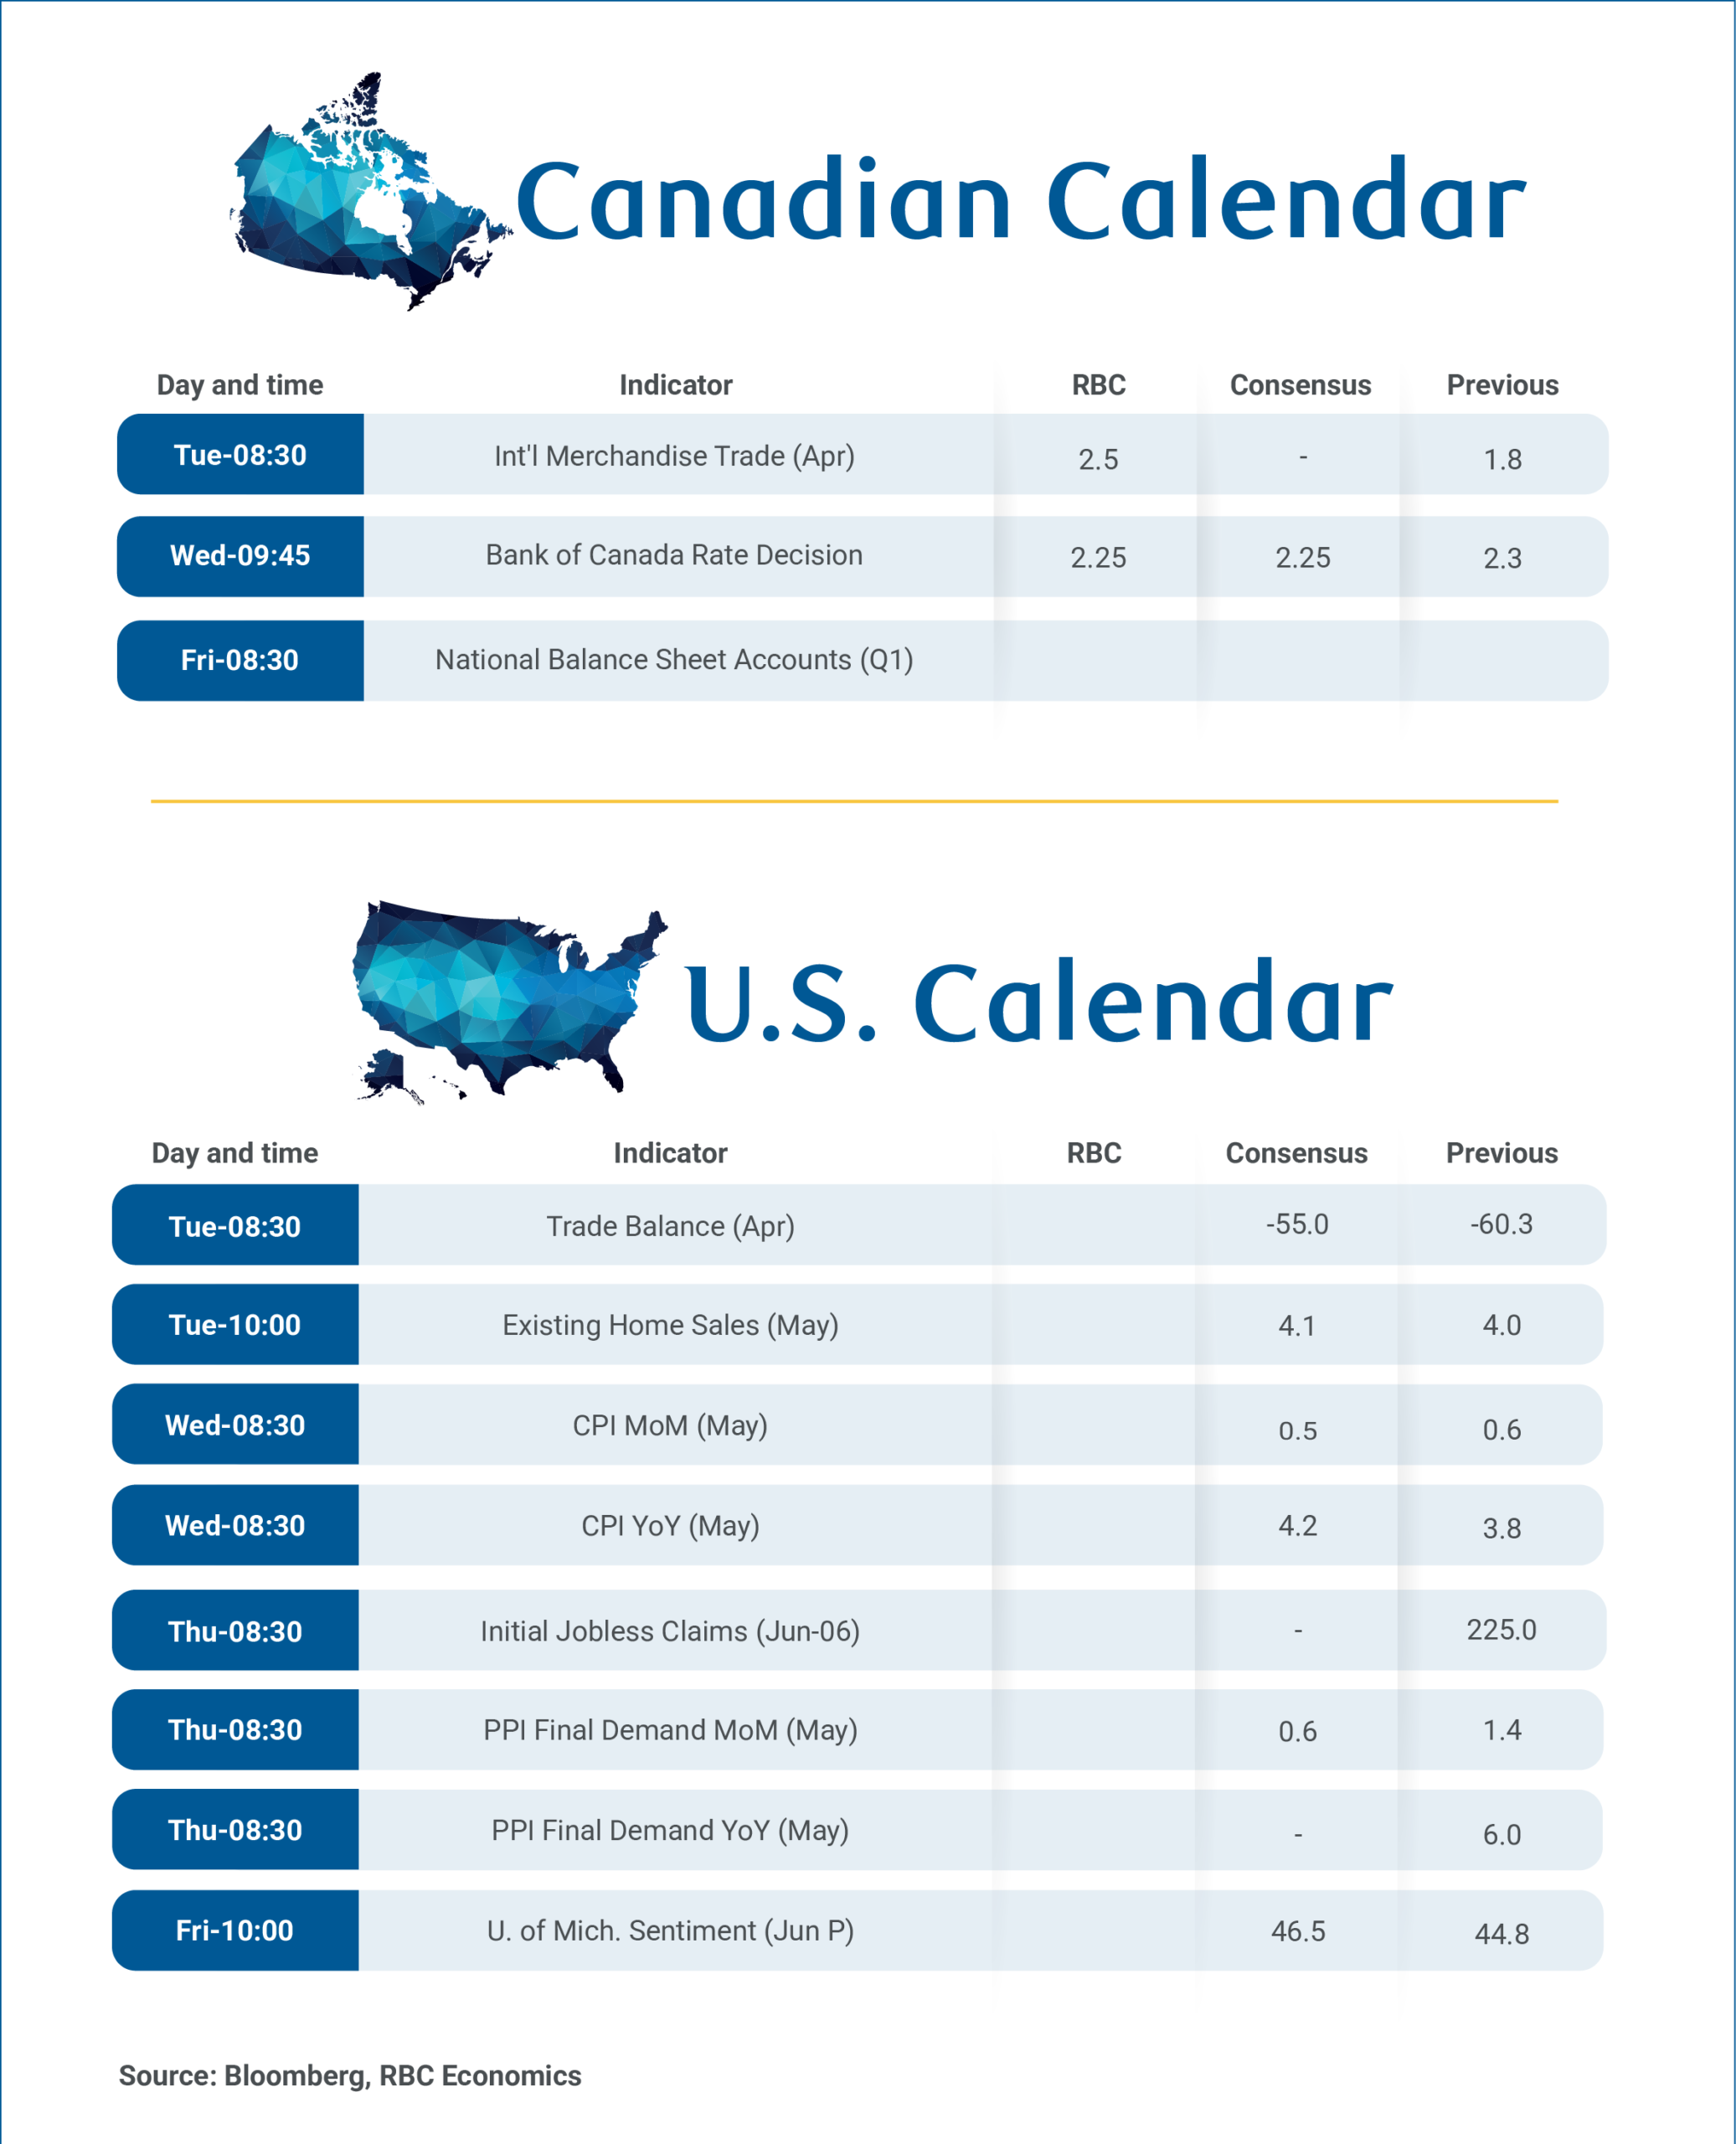
Canada’s trade report for April on Tuesday is expected to show exports rising 1.1%, while imports remain unchanged, widening the overall surplus to $2.5 billion. Oil prices climbed more than 7% from the prior month, boosting the energy trade balance. Vehicle shipments are also expected to increase, consistent with seasonally adjusted car and truck production data.
Canadian household net worth growth likely remained positive in Q1 2026, though the pace likely slowed from prior quarters in the National Balance Sheet Accounts next Friday. We look for a moderate increase in asset values, supported by a similar rebound in housing values. The CREA Home Price Index rose 0.7% in Q1 (not seasonally adjusted) following three consecutive quarterly declines. Financial asset growth likely paused after robust gains in prior quarters as the S&P 500 declined in Q1 while the S&P/TSX Composite continued to outperform. For liabilities, debt is expected to have grown at a similar pace to Q4, offsetting some asset gains. The debt service ratio is expected to edge slightly higher as debt payments rise and interest income declines alongside lower interest rates.
Headline U.S. CPI growth likely continued to edge higher as prices at the pump continued to increase into May -- potentially rising to above a 4% rate for the first time in 3 years. Core will be watched closely given April's 0.4% m/m jump was driven by a mechanical spike in housing costs related to the government shutdown, though underlying core services inflation (excluding shelter) showed signs of continued acceleration.
Summary 6/8 – 6/12
Monday, Jun 8, 2026
| GMT | Ccy | Events | Cons | Prev |
|---|---|---|---|---|
| 23:50 | JPY | Bank Lending Y/Y May | 5.60% | 5.40% |
| 23:50 | JPY | GDP Q/Q F | 0.30% | 0.50% |
| 23:50 | JPY | GDP Deflator Y/Y Q1 F | 3.40% | 3.40% |
| 23:50 | JPY | Current Account (JPY) Apr | 3.26T | 3.90T |
| 05:00 | JPY | Eco Watchers Survey: Current May | 41.9 | 40.8 |
| 06:00 | EUR | Germany Factory Orders M/M Apr | -2.20% | 5.00% |
| 08:30 | EUR | Eurozone Sentix Investor Confidence Jun | -13.8 | -16.4 |
| 23:50 | JPY |
| Bank Lending Y/Y May | |
| Consensus | 5.60% |
| Previous | 5.40% |
| 23:50 | JPY |
| GDP Q/Q F | |
| Consensus | 0.30% |
| Previous | 0.50% |
| 23:50 | JPY |
| GDP Deflator Y/Y Q1 F | |
| Consensus | 3.40% |
| Previous | 3.40% |
| 23:50 | JPY |
| Current Account (JPY) Apr | |
| Consensus | 3.26T |
| Previous | 3.90T |
| 05:00 | JPY |
| Eco Watchers Survey: Current May | |
| Consensus | 41.9 |
| Previous | 40.8 |
| 06:00 | EUR |
| Germany Factory Orders M/M Apr | |
| Consensus | -2.20% |
| Previous | 5.00% |
| 08:30 | EUR |
| Eurozone Sentix Investor Confidence Jun | |
| Consensus | -13.8 |
| Previous | -16.4 |
Tuesday, Jun 9, 2026
| GMT | Ccy | Events | Cons | Prev |
|---|---|---|---|---|
| 22:45 | NZD | Manufacturingles Q1 | -0.50% | |
| 23:01 | GBP | BRC Like-For-Like Retail Sales Y/Y May | -3.40% | |
| 23:50 | JPY | Money Supply M2+CD Y/Y May | 2.30% | |
| 00:30 | AUD | Westpac Consumer Confidence Jun | 3.50% | |
| 01:30 | AUD | NAB Business Confidence May | -24 | |
| 01:30 | AUD | NAB Business Conditions May | 3 | |
| 03:00 | CNY | Trade Balance (USD) May | 88.7B | 84.8B |
| 06:00 | EUR | Germany Industrial Production M/M Apr | 0.50% | -0.70% |
| 06:00 | EUR | Germany Trade Balance (EUR) Apr | 15.4B | 14.3B |
| 10:00 | USD | NFIB Business Optimism Index May | 96 | 95.9 |
| 12:30 | CAD | Trade Balance (CAD) Apr | 2.5B | 1.8B |
| 12:30 | USD | Trade Balance (USD) Apr | -55.5B | -60.3B |
| 14:00 | USD | Existing Home Sales May | 4.05M | 4.02M |
| 22:45 | NZD |
| Manufacturingles Q1 | |
| Consensus | |
| Previous | -0.50% |
| 23:01 | GBP |
| BRC Like-For-Like Retail Sales Y/Y May | |
| Consensus | |
| Previous | -3.40% |
| 23:50 | JPY |
| Money Supply M2+CD Y/Y May | |
| Consensus | |
| Previous | 2.30% |
| 00:30 | AUD |
| Westpac Consumer Confidence Jun | |
| Consensus | |
| Previous | 3.50% |
| 01:30 | AUD |
| NAB Business Confidence May | |
| Consensus | |
| Previous | -24 |
| 01:30 | AUD |
| NAB Business Conditions May | |
| Consensus | |
| Previous | 3 |
| 03:00 | CNY |
| Trade Balance (USD) May | |
| Consensus | 88.7B |
| Previous | 84.8B |
| 06:00 | EUR |
| Germany Industrial Production M/M Apr | |
| Consensus | 0.50% |
| Previous | -0.70% |
| 06:00 | EUR |
| Germany Trade Balance (EUR) Apr | |
| Consensus | 15.4B |
| Previous | 14.3B |
| 10:00 | USD |
| NFIB Business Optimism Index May | |
| Consensus | 96 |
| Previous | 95.9 |
| 12:30 | CAD |
| Trade Balance (CAD) Apr | |
| Consensus | 2.5B |
| Previous | 1.8B |
| 12:30 | USD |
| Trade Balance (USD) Apr | |
| Consensus | -55.5B |
| Previous | -60.3B |
| 14:00 | USD |
| Existing Home Sales May | |
| Consensus | 4.05M |
| Previous | 4.02M |
Wednesday, Jun 10, 2026
| GMT | Ccy | Events | Cons | Prev |
|---|---|---|---|---|
| 23:50 | JPY | PPI Y/Y May | 5.50% | 4.90% |
| 01:30 | CNY | CPI Y/Y May | 1.30% | 1.20% |
| 01:30 | CNY | PPI Y/Y May | 3.90% | 2.80% |
| 12:30 | USD | CPI M/M May | 0.50% | 0.60% |
| 12:30 | USD | CPI Y/Y May | 4.20% | 3.80% |
| 12:30 | USD | CPI Core M/M May | 0.30% | 0.40% |
| 12:30 | USD | CPI Core Y/Y May | 2.90% | 2.80% |
| 13:45 | CAD | BoC Interest Rate Decision | 2.25% | 2.25% |
| 14:30 | CAD | BoC Press Conference | ||
| 14:30 | USD | Crude Oil Inventories (Jun 5) | -3.0M | -8.0M |
| 23:50 | JPY |
| PPI Y/Y May | |
| Consensus | 5.50% |
| Previous | 4.90% |
| 01:30 | CNY |
| CPI Y/Y May | |
| Consensus | 1.30% |
| Previous | 1.20% |
| 01:30 | CNY |
| PPI Y/Y May | |
| Consensus | 3.90% |
| Previous | 2.80% |
| 12:30 | USD |
| CPI M/M May | |
| Consensus | 0.50% |
| Previous | 0.60% |
| 12:30 | USD |
| CPI Y/Y May | |
| Consensus | 4.20% |
| Previous | 3.80% |
| 12:30 | USD |
| CPI Core M/M May | |
| Consensus | 0.30% |
| Previous | 0.40% |
| 12:30 | USD |
| CPI Core Y/Y May | |
| Consensus | 2.90% |
| Previous | 2.80% |
| 13:45 | CAD |
| BoC Interest Rate Decision | |
| Consensus | 2.25% |
| Previous | 2.25% |
| 14:30 | CAD |
| BoC Press Conference | |
| Consensus | |
| Previous | |
| 14:30 | USD |
| Crude Oil Inventories (Jun 5) | |
| Consensus | -3.0M |
| Previous | -8.0M |
Thursday, Jun 11, 2026
| GMT | Ccy | Events | Cons | Prev |
|---|---|---|---|---|
| 23:01 | GBP | RICS Housing Price Balance May | -32% | -34% |
| 23:50 | JPY | BSI Large Manufacturing Q2 | 4.2 | 3.8 |
| 01:00 | AUD | Consumer Inflation Expectations Jun | 5.60% | |
| 12:15 | EUR | ECB Deposit Rate | 2.25% | 2.00% |
| 12:15 | EUR | ECB Main Refinancing Rate | 2.40% | 2.15% |
| 12:15 | EUR | ECB Monetary Policy Statement | ||
| 12:30 | CAD | Building Permits M/M Apr | -3.70% | 10.30% |
| 12:30 | USD | Initial Jobless Claims (Jun 5) | 225K | 225K |
| 12:30 | USD | PPI M/M May | 0.70% | 1.40% |
| 12:30 | USD | PPI Y/Y May | 6.40% | 6.00% |
| 12:30 | USD | PPI Core M/M May | 0.50% | 1.00% |
| 12:30 | USD | PPI Core Y/Y May | 5.40% | 5.20% |
| 12:45 | EUR | ECB Press Conference | ||
| 14:30 | USD | Natural Gas Storage (Jun 5) | 101B | 95B |
| 23:01 | GBP |
| RICS Housing Price Balance May | |
| Consensus | -32% |
| Previous | -34% |
| 23:50 | JPY |
| BSI Large Manufacturing Q2 | |
| Consensus | 4.2 |
| Previous | 3.8 |
| 01:00 | AUD |
| Consumer Inflation Expectations Jun | |
| Consensus | |
| Previous | 5.60% |
| 12:15 | EUR |
| ECB Deposit Rate | |
| Consensus | 2.25% |
| Previous | 2.00% |
| 12:15 | EUR |
| ECB Main Refinancing Rate | |
| Consensus | 2.40% |
| Previous | 2.15% |
| 12:15 | EUR |
| ECB Monetary Policy Statement | |
| Consensus | |
| Previous | |
| 12:30 | CAD |
| Building Permits M/M Apr | |
| Consensus | -3.70% |
| Previous | 10.30% |
| 12:30 | USD |
| Initial Jobless Claims (Jun 5) | |
| Consensus | 225K |
| Previous | 225K |
| 12:30 | USD |
| PPI M/M May | |
| Consensus | 0.70% |
| Previous | 1.40% |
| 12:30 | USD |
| PPI Y/Y May | |
| Consensus | 6.40% |
| Previous | 6.00% |
| 12:30 | USD |
| PPI Core M/M May | |
| Consensus | 0.50% |
| Previous | 1.00% |
| 12:30 | USD |
| PPI Core Y/Y May | |
| Consensus | 5.40% |
| Previous | 5.20% |
| 12:45 | EUR |
| ECB Press Conference | |
| Consensus | |
| Previous | |
| 14:30 | USD |
| Natural Gas Storage (Jun 5) | |
| Consensus | 101B |
| Previous | 95B |
Friday, Jun 12, 2026
| GMT | Ccy | Events | Cons | Prev |
|---|---|---|---|---|
| 22:30 | NZD | Business NZ PMI May | 50.5 | |
| 04:30 | JPY | Industrial Production M/M Apr F | 0.80% | 0.80% |
| 06:00 | EUR | Germany CPI M/M May F | -0.20% | -0.20% |
| 06:00 | EUR | Germany CPI Y/Y May F | 2.60% | 2.60% |
| 06:00 | GBP | GDP M/M Apr | -0.10% | 0.30% |
| 06:00 | GBP | Goods Trade Balance (GBP) Apr | -22.5B | -27.2B |
| 08:30 | GBP | Consumer Inflation Expectations | 3.20% | |
| 14:00 | USD | UoM Consumer Sentiment Jun P | 46 | 44.8 |
| 14:00 | USD | UoM 1-Yr Inflation Expectations Jun P | 4.80% |
| 22:30 | NZD |
| Business NZ PMI May | |
| Consensus | |
| Previous | 50.5 |
| 04:30 | JPY |
| Industrial Production M/M Apr F | |
| Consensus | 0.80% |
| Previous | 0.80% |
| 06:00 | EUR |
| Germany CPI M/M May F | |
| Consensus | -0.20% |
| Previous | -0.20% |
| 06:00 | EUR |
| Germany CPI Y/Y May F | |
| Consensus | 2.60% |
| Previous | 2.60% |
| 06:00 | GBP |
| GDP M/M Apr | |
| Consensus | -0.10% |
| Previous | 0.30% |
| 06:00 | GBP |
| Goods Trade Balance (GBP) Apr | |
| Consensus | -22.5B |
| Previous | -27.2B |
| 08:30 | GBP |
| Consumer Inflation Expectations | |
| Consensus | |
| Previous | 3.20% |
| 14:00 | USD |
| UoM Consumer Sentiment Jun P | |
| Consensus | 46 |
| Previous | 44.8 |
| 14:00 | USD |
| UoM 1-Yr Inflation Expectations Jun P | |
| Consensus | |
| Previous | 4.80% |