Sample Category Title
Week Ahead – Fed Countdown Begins Amid US Inflation Data and Geopolitical Risks
- Fed Chair Warsh’s first meeting approaches as key US inflation data could reshape expectations.
- Oil prices remain elevated as US-Iran talks continue; tariffs also return to the spotlight.
- ECB is expected to hike; will it be a one-off move or is July live?
- BoC to stand pat, aussie eyes Chinese CPI data, while the yen awaits the BoJ meeting.
- Strong US data could keep the dollar supported; euro may suffer if ECB adopts a balanced tone.
Fed meeting in sight but risk events linger
The countdown to the biggest event of the year so far, the first Fed meeting under Chair Warsh on June 17, has officially commenced. Next week’s key events could serve as the best appetizer for Warsh’s first press conference, although market participants will probably be distracted by developments elsewhere.
The fresh hostilities in the Middle East put a temporary pause on the prevailing optimism, but there is still lingering hope for an initial US-Iran deal, which addresses Iran’s nuclear future at a later date. Notably, US President Trump even allegedly disagreed with the Israeli PM Netanyahu as the latest Israeli operations in Lebanon threaten the agreement with Iran.
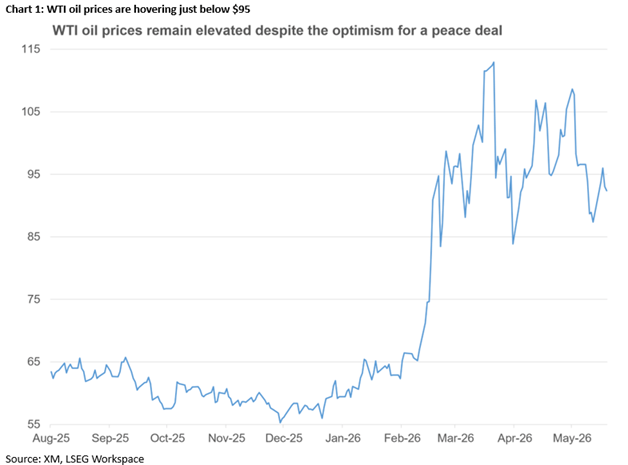
Oil prices remain elevated, but investors are reacting more calmly to headlines. That said, hopes for a swift drop in oil prices look baseless as it would require a full normalization of oil supply routes that could take months to achieve even if an agreement is announced today.
Meanwhile, the US administration has announced its intention to replace the 10% global tariff imposed under Section 122, which expires in July, with new Section 301 tariffs. The new levies will vary between 10%-12.5%, with China, India, Japan and South Korea facing the higher proposed rate. These levies are expected to commence during July, following a country-by-country review.
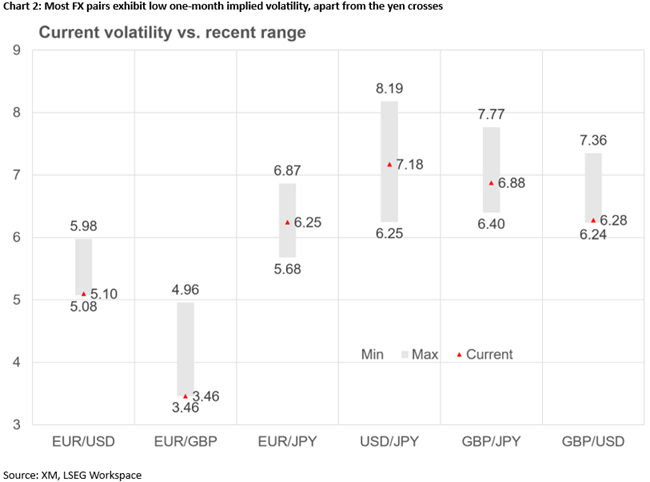
Surprisingly, market volatility remains relatively subdued across the asset classes. In particular, the one-month implied volatility for both euro/dollar and gold has crashed to the lowest level since mid-January, while the S&P 500 volatility has also been edging lower, almost reaching February’s levels. On the other hand, yen pairs and the Nikkei 225 index are experiencing increased volatility ahead of the critical BoJ meeting.
Pivotal US data releases
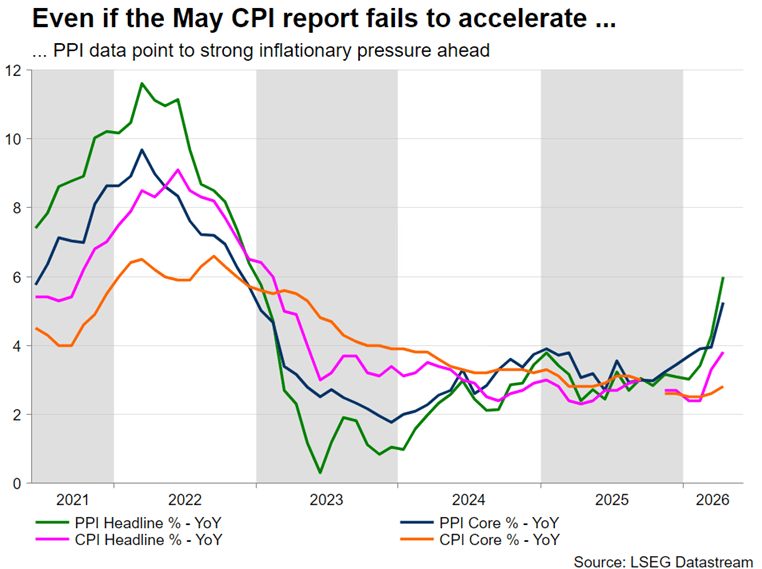
This calmer volatility profile could materially change next week as the June CPI and PPI reports on Wednesday and Thursday respectively will be in the spotlight. Very early forecasts point to another acceleration in both the headline and core CPI indicators to 4.2% – the highest level since June 2023 – and 3% respectively, sending shockwaves across markets.
While an elevated inflation report could be seen as temporary by Fed doves, the producer price figures remain a real headache. The headline year-on-year indicator is seen jumping north of 6.5%, the highest level since January 2023, and likely opening the door to further CPI acceleration given the lag between the two reports. Notably, the likely stronger inflation prints might be followed by another record low reading in Friday’s preliminary University of Michigan Consumer Confidence index, causing alarms about consumer spending.
Confirmation of these early forecasts might not materially increase the chances of a hawkish meeting the following week, but it will surely seriously complicate Warsh’s first few weeks on the job. The new Chair was selected by Trump due to his dovish credentials, but it will be difficult for Warsh to ignore the ballooning inflationary pressures. At his May confirmation hearings, he insisted on the need to restore Fed credibility and shrink the balance sheet, raising questions about his true colours.
The US dollar has been the protagonist of the week. With Trump apparently opting for a muted tariff strategy, the dollar might yet prove more resilient than forecast. A US-Iran resolution would push euro/dollar higher, but the favourable yield spread, the continued equity inflows and the strong economy could shield the dollar from posting significant losses. If the Fed opts for a more hawkish stance, on the back of strong inflation prints, then the dollar might enjoy a strong June.
ECB to hike but will it remain hawkish?
Alongside the US data, Thursday’s ECB meeting could increase expectations for a more hawkish Fed meeting. President Lagarde et al. are widely seen announcing the first rate hike since September 2023, essentially acknowledging that the adverse scenario is materializing. An agreement reopening the Strait of Hormuz would be welcomed by ECB members but will not be sufficient to pause Wednesday’s rate hike.
Additionally, based on the ongoing commentary from ECB officials, the discussion at the ECB tower in Frankfurt will also evolve around the severe scenario, which, in principle, could justify a series of rate hikes. A July rate hike will not be pre-announced, but Lagarde can easily guide expectations if the hawks demand such action, while a similar message could also be conveyed by the staff forecasts, if the 2026 headline and core CPI figures are revised aggressively higher. Consequently, the usual press conference will attract market interest, increasing the pressure on Lagarde to minimize her usual mistakes.
Despite the more hawkish ECB stance, the euro has been failing to rally aggressively against the dollar. A rate hike on Thursday might cause a brief euro appreciation only if it is accompanied by hawkish commentary. But even then, growth concerns could eventually dent euro appetite. What could materially change the euro’s outlook would be the end of the Ukraine-Russia war and the normalization of EU-Russia trade relations.
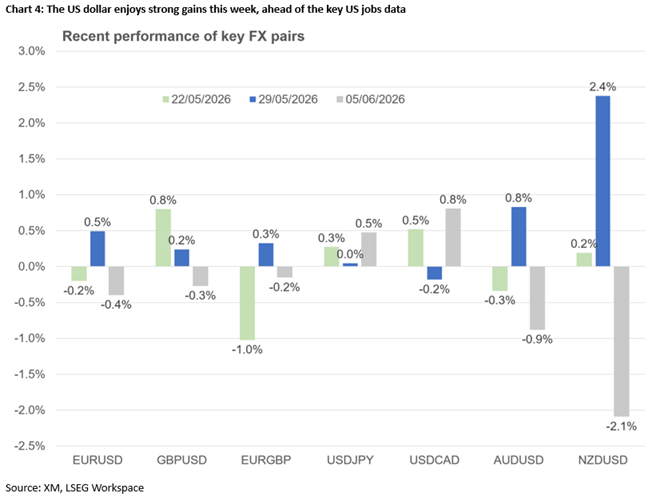
BoC meets, Aussie eye key Chinese data and the Yen hopes for a miracle
On Wednesday, the Bank of Canada is expected to stand pat, as the council is very worried about the weakening labour market and waning growth. The weaker April CPI report and the Q1 GDP figures cancelled any hawkish thoughts. The BoC’s mind will also be on the challenging US-Canada trade relationship in light of the USMCA review in July and the latest headlines about the US imposing a 10% tariff on certain imports from Canada.
There is also a busy schedule for the aussie, but only the June Westpac consumer sentiment survey could attract market interest. That said, disappointing CPI and PPI data from China on Wednesday could also prove market-moving. Both the loonie and the aussie could be on the wrong foot next week, adding to the decent losses already recorded.
Meanwhile, with dollar/yen hovering just below 160, it looks like the Japanese Finance Ministry has opted to wait until the BoJ meeting on June 16. If markets are not content with the expected BoJ rate hike and overall rhetoric, then the BoJ will be forced to intervene aggressively.
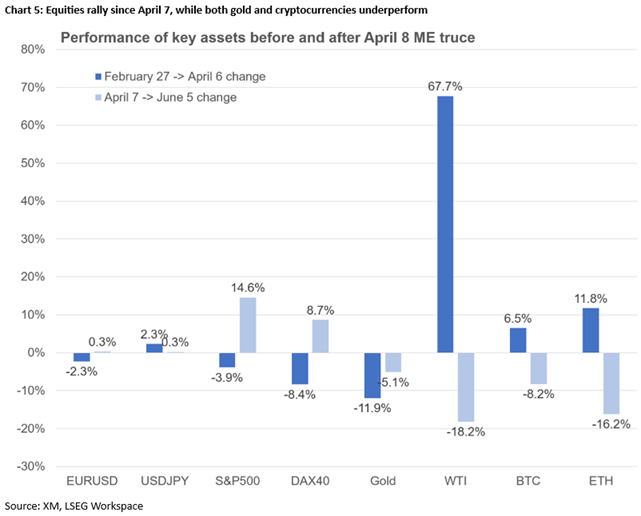
Equities pumped up, crypto market in disarray, gold shows some signs of life
US equity indices continue to monopolize market flows and remain near their record highs. The AI frenzy has taken a small hit from Broadcom earnings, but it will take more than a mediocre report to dent appetite. That said, next week’s earnings announcements from both Oracle and Adobe, and the SpaceX IPO might add fuel to current concerns, with investors remembering overstretched valuations. From a trading perspective, the pace of the rally since late March has been exponential, rising 20% in just over two months. Hence, a correction might be necessary to strengthen the foundation of the current upleg. But are investors going to react maturely to a 5% drop towards the 7,000 area?
Finally, the situation is less rosy for gold. The precious metal remains almost exclusively driven by the US dollar, while also being marred by continued selling from countries aiming to support their currencies and/or replenish their lost oil revenues. An upside surprise in next week’s US data releases could support the dollar and materially undermine the current tentative signs of stabilization.
Sunset Market Commentary
Markets
US payrolls delivered. Net job growth topped all forecasts and beat consensus by a wide margin in May (172k vs 88k) and was accompanied by a combined positive 93k net revision to March & April numbers. That’s a 177k positive surprise. The 188k 3-month average points to the best momentum since March 2024 and suggests that the weak H2 2025 (“no hire, no fire”) is definitively behind us. Leisure and hospitality added 70k jobs, the most in more than three years and probably linked to the World Cup soccer which kicks off next week. The unemployment rate and labor force participation rate both stabilized, at 4.3% and 61.8% respectively. Average wage growth printed in line with consensus as well at 0.3% M/M and 3.4% Y/Y. US Treasuries sold off after the BLS report with the curve bear flattening. Daily changes range between +4 bps (30-yr) and +10 bps (2-yr). The US 2-yr yield tests the YTD high at 4.14%. The US 30-yr yield is back above 5% which makes for an interesting set-up going into next week’s mid-month refinancing operation (including 30-yr bond auction). On a weekly basis, the bear flattening is even more outspoken given strong ISM surveys, JOLTS and ADP reports earlier this week. US money markets currently fully discount a 25 bps Fed rate hike by the December policy meeting. At the end of last week, the market implied probability stood at 57% with a hike discounted by mid-2027. We’d err on the side of the repositioning to continue next week with May US inflation numbers expected to deliver the first 4%-outcome since April 2023. Underlying core CPI is on the verge of moving back above the 3%-threshold. Against the background of decent growth and a strengthening labour market, this could prompt more hawkish comments from the US central bank. Higher US yields boost the dollar. EUR/USD drops below the 1.16-handle and tests EUR/USD 1.1576 support, the final hurdle before a return towards the 1.14 area. USD/JPY changes hands at the psychological 160-mark and could be the driver of more USD gains if markets test Japanese officials readiness to walk their intervention talk. US equity markets already traded on the soft (correction) side with higher yields adding damage. Key gauges open up to 1% lower (Nasdaq).
The ECB is set to deliver its first rate hike since September 2023 next week. The eurozone economy shows resilience so far while inflationary pressures are broadening and risk unanchoring inflation expectations. April ECB Minutes showed that some ECB members back then wouldn’t have opposed a rate hike. In the meantime, support for some tightening grew with plenty ECB governors even saying that an interim US-Iran deal wouldn’t derail that decision. How things stand right now, the latter doesn’t seem to be in sight any time soon. We therefore err on the side of back-to-back ECB rate hikes as the energy supply shock persists and call for a measured adjustment of policy. A potential trigger to expect more ECB tightening could come from a new upleg in oil prices for example in case we move to a situation of physical shortages as reserves are depleted at stealth pace.
News & Views
Firms in the Bank of England’s May Decision Maker Panel survey said their realized own-price growth was 3.8% in the three months to May, up 0.1 ppt from the April edition. For the year ahead, firms said they expected their own prices to rise by 4%, or 0.2 ppt higher than previously. Year-ahead expectations for the broader CPI indicator increased to 3.7%, while the three-year gauge matched April’s 2.8%. The surveyed firms reported annual wage growth in the three months to May at 4.2%, down 0.1 ppt, and annual employment over the same period at -0.3%. Year-ahead measures for both came in at 3.4% (unchanged) and -0.3% respectively. The DMP since April is also polling the way firms expect the recent energy shock to affect their business over the next 12 months. Higher prices and lower profit margins continue to be the most common forms of adjustment in the May survey. 57% reported an expected price increase while 68% foresee shrinking profit margins.
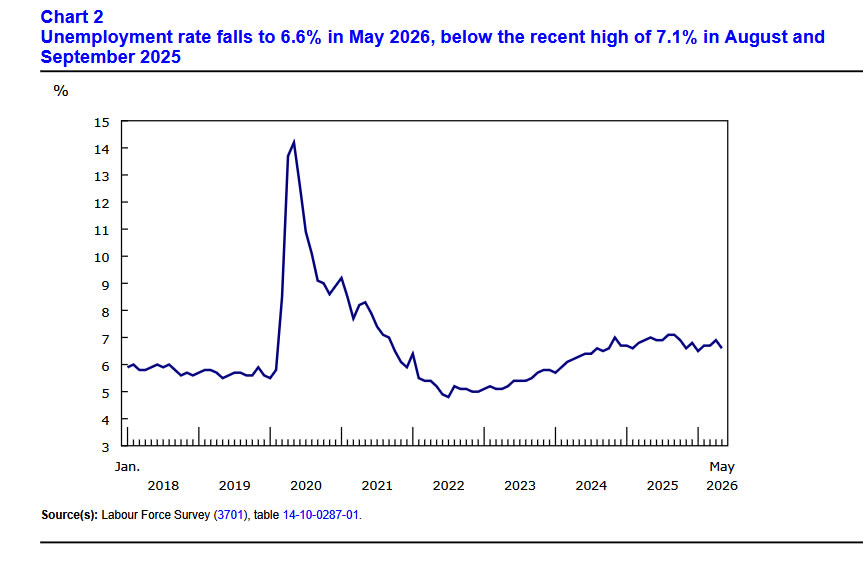
Canadian payrolls in May crushed estimates with a net job growth of 87.8k vs 10k expected. It’s the largest single-month increase since December 2024. Employment rose most notably in construction (+27k), information, culture and recreation (+19k), transportation and warehousing (+19k) and accommodation and food services (+17k). Full-time jobs rose by 154k, compensating a 66k drop in part-time employment. The unemployment rate unexpectedly fell 0.3 ppts to 6.6% while the participation rate steadied at 65%. The employment rate rose for the first time since December 2025, adding 0.2 ppts to 60.7%. Despite the large uptick in employment, the hourly wage rate of permanent workers fell from 4.8% to 3.2%, the joint-slowest in more than four years. The Canadian dollar kept earlier gains against the strong American counterpart. USD/CAD hovers around 1.388. Money market bets for a rate hike by the Bank of Canada grew with a year-end move more than priced in.
AUD/USD Daily Report
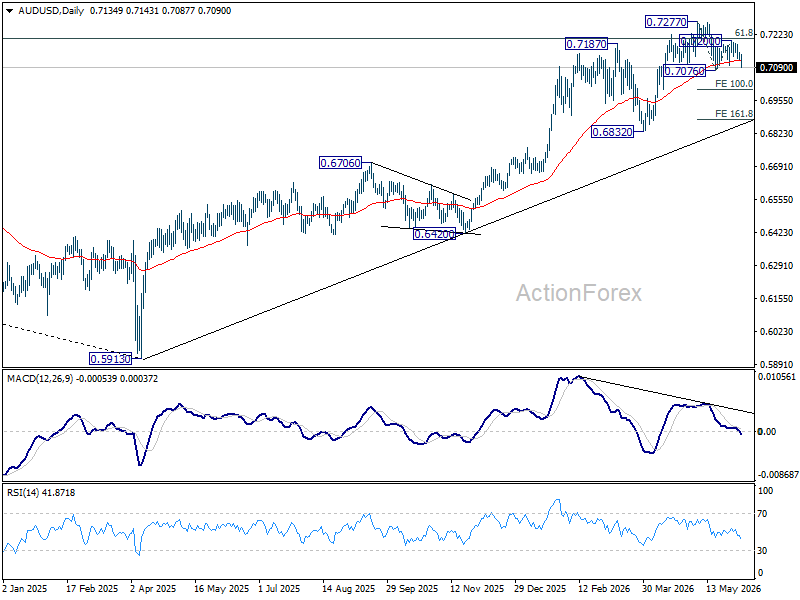
AUD/USD falls notably today but stays above 0.7076 support. Intraday bias stays neutral first. On the downside, firm break of 0.7076 will resume the decline from 0.7277. Next target is 100% projection of 0.7277 to 0.7076 from 0.7200 at 0.6999. On the upside, above 0.7200 will bring stronger rebound back to retest 0.7277 high.
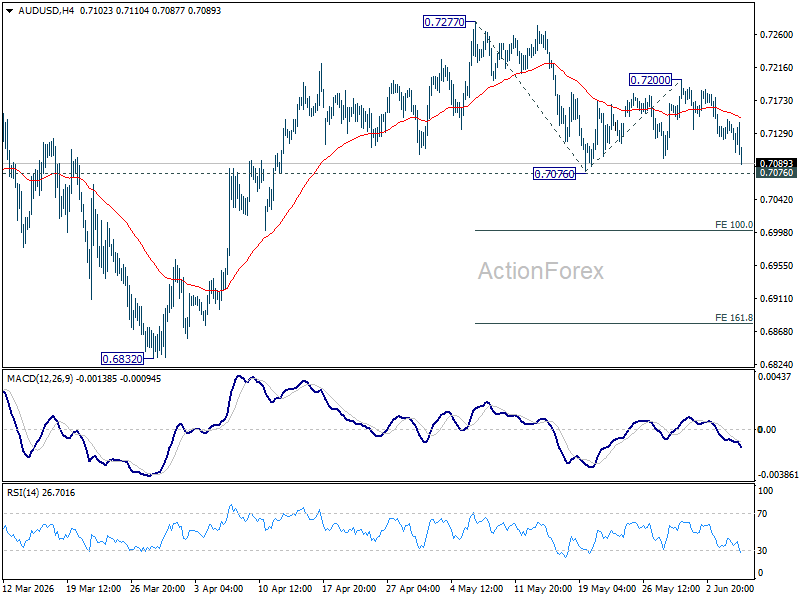
In the bigger picture, rise from 0.5913 (2024 low) is still in progress. Decisive break of 61.8% retracement of 0.8006 to 0.5913 at 0.7206 will solidify the case that it's already reversing the down trend from 0.8006 (2021 high). Further rally should then be seen to retest 0.8006. For now, outlook will remain bullish as long as 0.6832 support holds, in case of pullback.
USD/CAD Daily Outlook
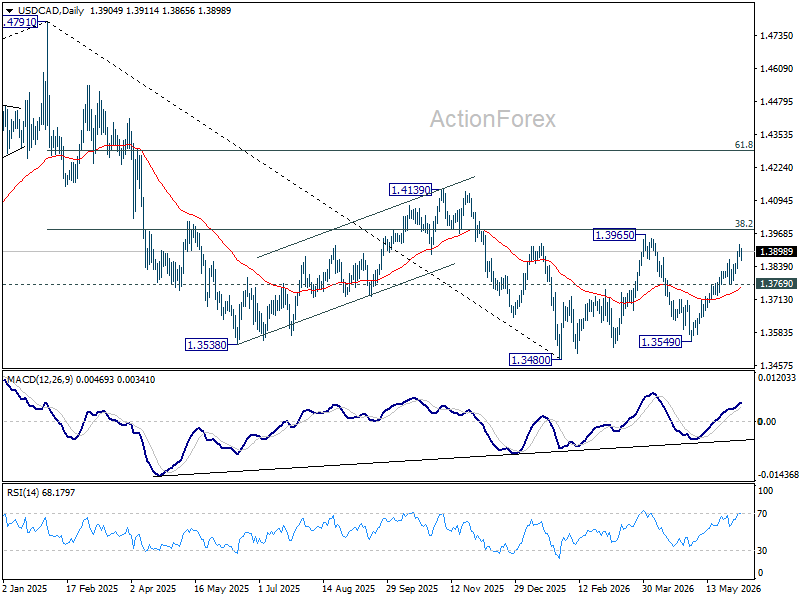
Intraday bias in USD/CAD is turned neutral with current retreat and some consolidations would be seen. Further rally will remains in favor as long as 1.3769 support holds. Above 1.3924 will resume the rise from 1.3549 to 1.3965 resistance next.
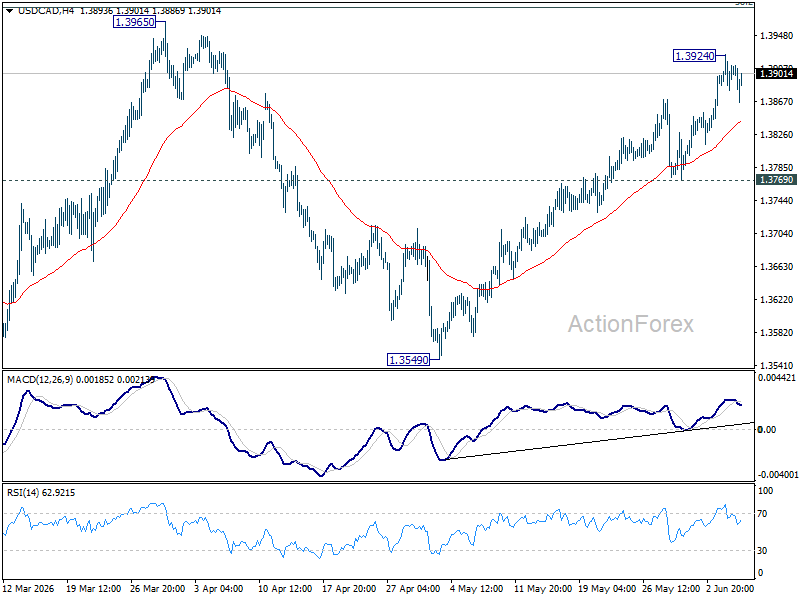
In the bigger picture, price actions from 1.4791 are seen as a corrective pattern to the whole up trend from 1.2005 (2021 low). Deeper fall could be seen, as the pattern extends, to 61.8% retracement of 1.2005 to 1.4791 at 1.3069. However, decisive break of 38.2% retracement of 1.4791 to 1.3480 at 1.3981 will argue that the correction has completed with three waves down to 1.3480 already.
EUR/USD Daily Outlook
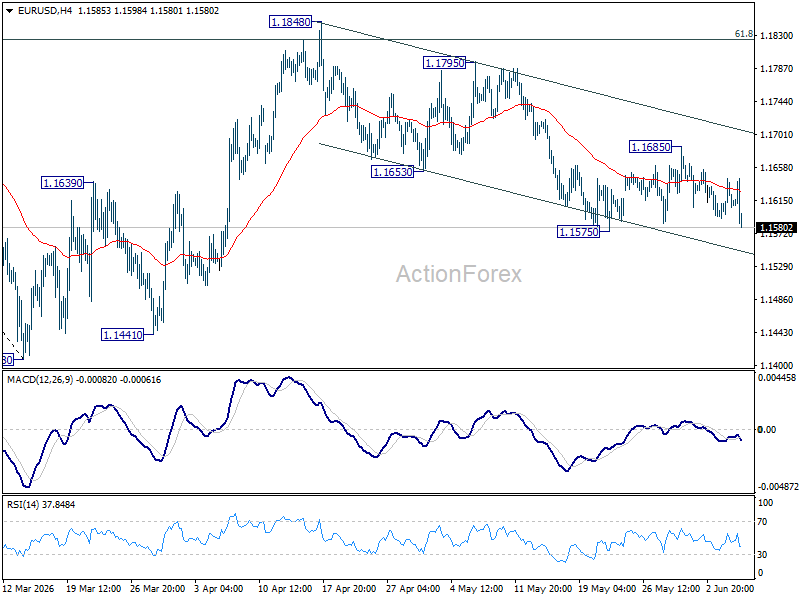
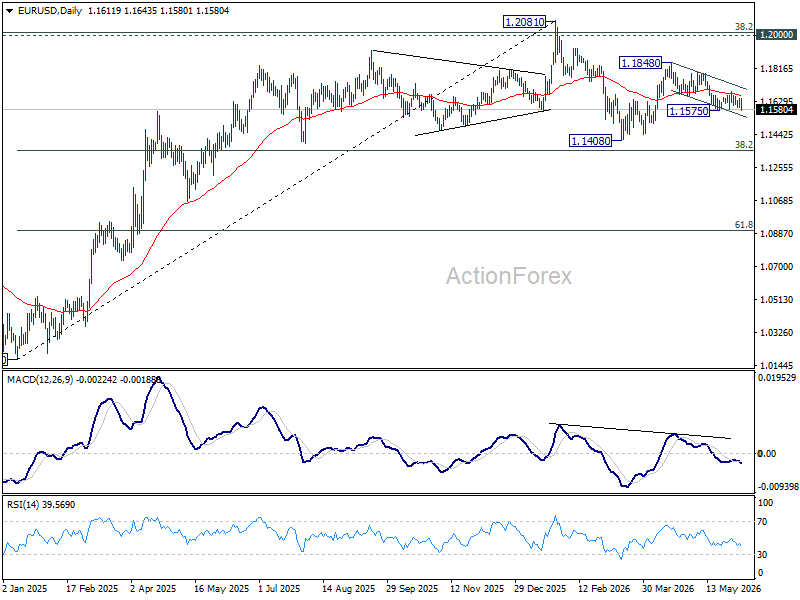
EUR/USD weakens notably today but stays above 1.1575 support. Intraday bias remains neutral first. On the downside, break of 1.1575 support will resume the fall from 1.1848 to retest 1.1408 low. Above 1.1865 will target 1.1795 resistance. Firm break there will argue that rise from 1.1408 is ready to resume through 1.1848.
In the bigger picture, the strong support from 38.2% retracement of 1.0176 to 1.2081 at 1.1353 suggests that the pullback from 1.2081 is more likely a corrective move. Strong support was also found in 55 W EMA (now at 1.1542). Focus is back on 1.2 key cluster resistance level. Decisive break there will carry long term bullish implications. Nevertheless, break of 1.1408 support will revive the case of medium term bearish trend reversal.
GBP/USD Daily Outlook
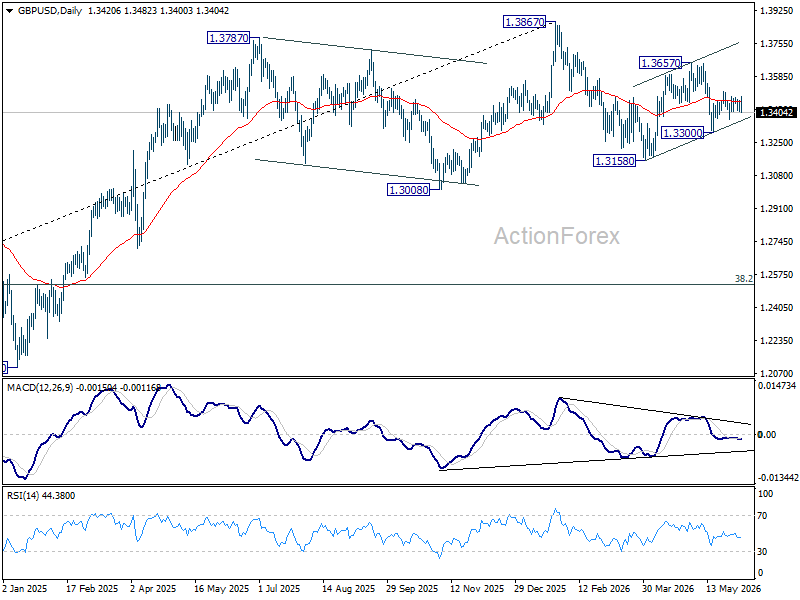
GBP/USD dips mildly today but stays in range of 1.3300/3508. Intraday bias remains neutral at this point. On the upside, above 1.3508 will extend the rebound from 1.3300 to 1.3657 resistance first. On the downside, below 1.3300 will bring deeper fall back to 1.3158 support instead.
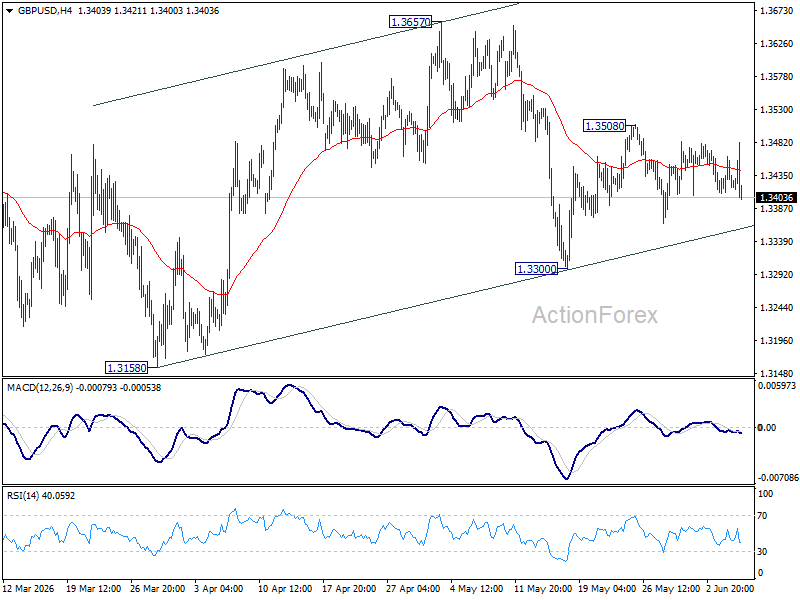
In the bigger picture, price actions from 1.3867 are a corrective pattern within the broader up trend from 1.0351 (2022 low). With 1.3008 support intact, medium term bullishness is maintained and break of 1.3867 is in favor for a later stage, towards 1.4248 key resistance (2021 high). However, firm break of 1.3008 will at least bring deeper fall to 38.2% retracement of 1.0351 to 1.3867 at 1.2524, with increased risk of bearish reversal.
USD/CHF Daily Outlook
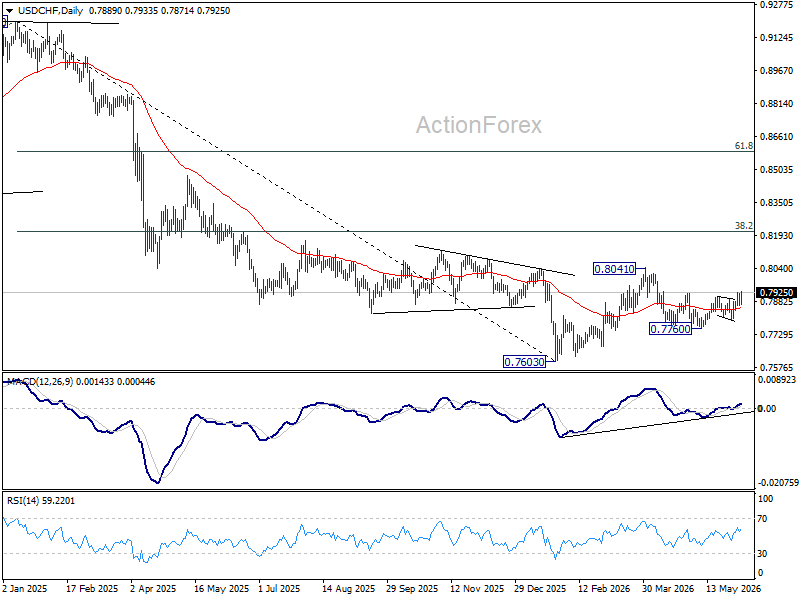
USD/CHF's rise from 0.7760 resumed by breaking through 0.7926 and intraday bias is back on the upside. Fall from 0.8041 should have completed at 0.7760. Further rally should be seen to retest 0.8041 next. On the downside, below 0.7867 minor support will turn intraday bias neutral first.
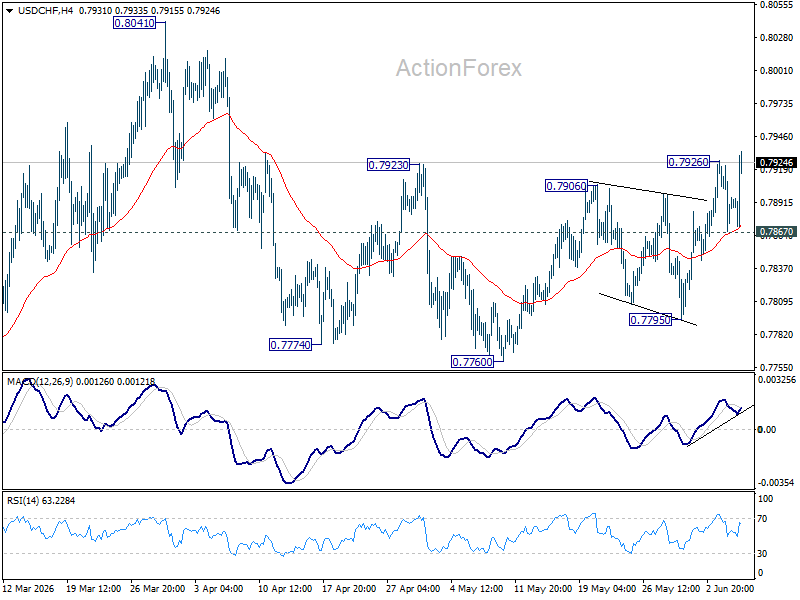
In the bigger picture, as long as 55 W EMA (now at 0.8028) holds, fall from 0.9200 is expected to continue, as part of the larger down trend. Firm break of 0.7603 will target 100% projection of 1.0146 (2022 high) to 0.8332 from 0.9200 at 0.7382.
USD/JPY Daily Outlook
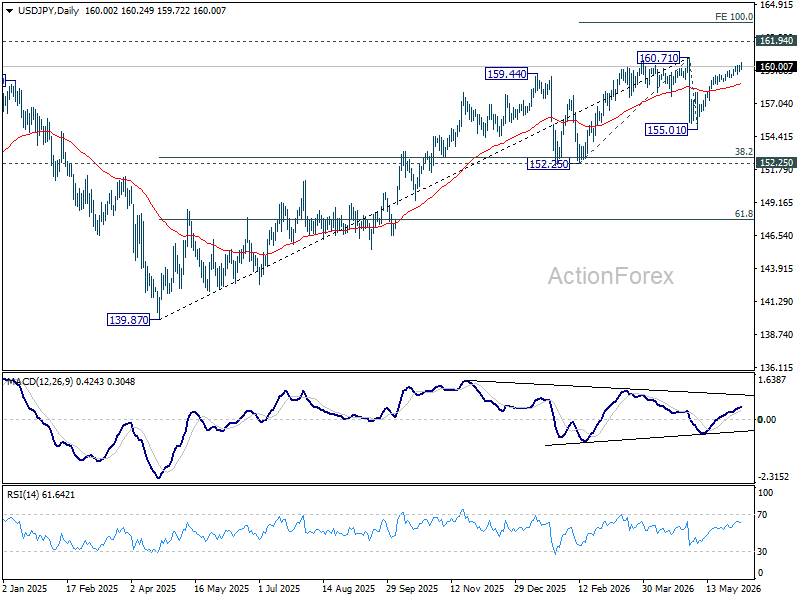
USD/JPY's rally from 155.01 is still in progress and intraday bias stays on the upside. As this rise is viewed as the second leg of the corrective pattern from 160.71, strong resistance should emerge there to cap upside. Break of 159.08 minor support will turn bias back to the downside for 55 D EMA (now at 158.56) and below. However, decisive break of 160.71 will confirm up trend resumption. That should push USD/JPY through 161.94 to 100% projection of 152.25 to 160.71 from 155.01 at 163.47 next.
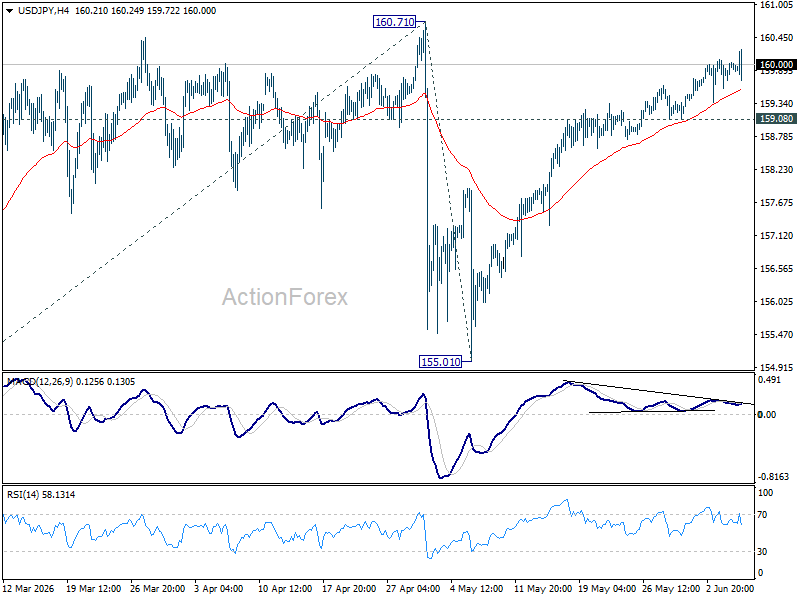
In the bigger picture, for now, corrective pattern from 161.94 (2024 high) is still seen as completed at 139.87. Rise from there is seen as resuming the long term up trend. So, break of 161.94 is expected at a later stage to resume the long term up trend. However, sustained break of 55 W EMA (now at 154.55) will dampen this view and bring deeper fall back towards 139.87 to extend the pattern from 161.94.
Dollar Rises as Strong Payrolls Reinforce Fed Patience, USD/JPY Clears 160
Dollar strengthened broadly in early US session after a much stronger-than-expected US employment report reinforced confidence in the resilience of the labor market. Non-farm payrolls rose 172k in May, nearly double expectations, while April's gain was revised sharply higher to 179k. Unemployment held steady at 4.3%, and wage growth remained contained, with average hourly earnings rising 0.3% mom and annual growth slowing from 3.6% yoy to 3.4% yoy. The combination of strong hiring and moderating wage pressures is likely to be welcomed by Federal Reserve officials.
Importantly, the report does not fundamentally change the Fed's current stance. Policymakers have increasingly shifted their focus away from labor-market concerns and toward inflation risks linked to elevated energy prices and the ongoing US-Iran conflict. Strong payroll growth confirms that employment remains resilient, while slower annual wage growth suggests there is still no clear evidence of a renewed wage-price spiral. For the Fed, the data provide additional room and time to assess how the oil shock is feeding through the broader economy before considering any policy response.
Markets interpreted the report as modestly supportive for the hawkish side of the policy debate. Pricing for a 25bps Fed rate hike by year-end rose to around 60% following the release. Yet the increase in tightening expectations was measured rather than dramatic, reflecting the view that one employment report is unlikely to force the Fed away from its wait-and-see approach. Instead, the data mainly strengthen the argument that policymakers can afford to remain patient while monitoring inflation developments.
The move in Treasury yields may prove just as important as the payrolls report itself. US 10-year yields climbed back above 4.5% level, providing Dollar with an additional tailwind. If yields continue to rise in coming hours, the greenback could find broader support beyond the initial post-NFP reaction. Attention is now turning to whether Dollar can break decisively higher against Euro before the weekly close and signal a more sustained bullish momentum.
Meanwhile, strong market reaction was also seen against Yen. USD/JPY surged above the psychologically important 160 level following the payrolls release, pushing back through Japan's unofficial intervention red line. The move came despite continued warnings from Japanese officials. Earlier on Friday, reserve data showed Japan's foreign reserves fell by around USD 75 billion in May, broadly matching the Ministry of Finance's disclosure that roughly USD 73.4 billion was spent on intervention operations during the Golden Week period.
Finance Minister Satsuki Katayama reiterated that authorities would respond "appropriately at any time when necessary" and retained the right to take "decisive action" against excessive volatility. She also emphasized that Tokyo remains in close communication with Washington regarding currency developments. With USD/JPY once again above 160, markets are now focused on whether Japan will step back into the market or tolerate a fresh leg higher in the pair.
For the week so far, Dollar stands as the strongest major currency, followed by Sterling and Euro. At the other end of the table, Kiwi is the weakest performer, followed by Swiss Franc and Aussie. Loonie and Yen are positioned in the middle, reflecting support from stronger domestic data in Canada and ongoing intervention concerns in Japan.
US Non Farm Payrolls Crush Expectations with 172k Growth
The May payrolls report delivered exactly the outcome the Fed wanted to see: strong hiring, stable unemployment, and no major wage surprise. Payroll growth nearly doubled expectations, while April's figure was revised sharply higher. The result does not guarantee another rate hike, but it gives policymakers greater freedom to focus on inflation risks rather than labor-market weakness. Read More.
Canada Employment Surges 87.8K, Unemployment Falls to 6.6%
Canada's labor market delivered a surprise comeback in May. Employment surged by 87,800, unemployment fell to 6.6%, and full-time hiring jumped by 154,000. After losing 112,000 jobs during the first four months of the year, the report suggests the labor market may be far more resilient than recent data had implied. Read More.
Eurozone Economy Contracts -0.2% qoq in Q1 as Trade and Investment Drag Growth Lower
The Eurozone economy contracted in the first quarter of 2026 as trade and investment weakened significantly. Household spending and government consumption continued to support activity, but not enough to offset falling capital expenditure and weaker external demand. Annual growth slowed to just 0.3%, underscoring the increasingly difficult balance facing the ECB as inflation remains elevated while economic momentum fades. Read More.
Japan Wage Growth Surges to 34-Year High Streak, Consumption Still Lags
Japan's long-awaited wage revival is gaining momentum. Real wages rose for a fourth consecutive month in April, while nominal wage growth exceeded 3% for a third straight month for the first time in more than three decades. The figures strengthen the case for further BoJ normalization, although household spending remains too weak to declare victory just yet. Read More.
USD/JPY Daily Outlook
USD/JPY's rally from 155.01 is still in progress and intraday bias stays on the upside. As this rise is viewed as the second leg of the corrective pattern from 160.71, strong resistance should emerge there to cap upside. Break of 159.08 minor support will turn bias back to the downside for 55 D EMA (now at 158.56) and below. However, decisive break of 160.71 will confirm up trend resumption. That should push USD/JPY through 161.94 to 100% projection of 152.25 to 160.71 from 155.01 at 163.47 next.
In the bigger picture, for now, corrective pattern from 161.94 (2024 high) is still seen as completed at 139.87. Rise from there is seen as resuming the long term up trend. So, break of 161.94 is expected at a later stage to resume the long term up trend. However, sustained break of 55 W EMA (now at 154.55) will dampen this view and bring deeper fall back towards 139.87 to extend the pattern from 161.94.
Canada Employment Surges 87.8K, Unemployment Falls to 6.6%
Canada's labor market delivered a much stronger-than-expected performance in May, with employment rising by 87.8k compared with expectations for a gain of just 10.2k. The increase marked the first significant monthly advance since November 2025 and followed a decline of -17.7k in April. While the result does not fully offset the weakness seen earlier this year, it represents a notable turnaround after cumulative job losses of -112k during the first four months of 2026.
The quality of hiring was particularly encouraging. Full-time employment surged by 154k, highlighting solid underlying labor demand rather than temporary or part-time hiring. As a result, the unemployment rate fell from 6.9% to 6.6%, beating expectations for an unchanged reading. The employment rate also improved by 0.2 percentage points to 60.7%, indicating broader labor-market participation and stronger workforce absorption.
Despite the sharp rebound in hiring, wage growth eased noticeably. Average hourly earnings increased 3.0% yoy in May, slowing from 4.5% yoy in April. That moderation should help alleviate concerns about wage-driven inflation pressures and may reduce any urgency for the Bank of Canada to consider tighter policy.
| Indicator | Previous | Latest | Expectation |
|---|---|---|---|
| Employment Change | -17.7k* | 87.8k | 10.2k |
| Unemployment Rate | 6.9% | 6.6% | 6.9% |
| Employment Rate | 60.5% | 60.7% | — |
| Avg. Hourly Wages Y/Y | 4.5% | 3.0% | — |
| Category | Change |
|---|---|
| Total Employment | +87.8k |
| Full-Time Employment | +154.0k |
| Part-Time Employment | -66.2k |