
Sample Category Title
EUR/USD Mid-Day Outlook
Daily Pivots: (S1) 1.1708; (P) 1.1750; (R1) 1.1785; More….
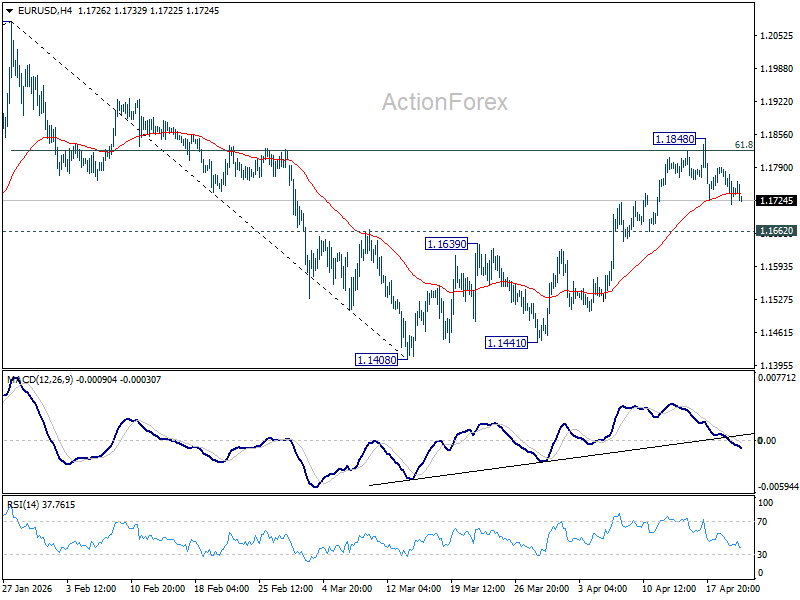
Intraday bias stays neutral in EUR/USD and more consolidations could be seen below 1.1848. With 1.1662 support intact, further rally is in favor. On the upside, sustained trading above 61.8% retracement of 1.2081 to 1.1408 at 1.1824 will pave the way to retest 1.2081 high. However, firm break of 1.1662 support will bring deeper decline back towards 1.1408 low instead.
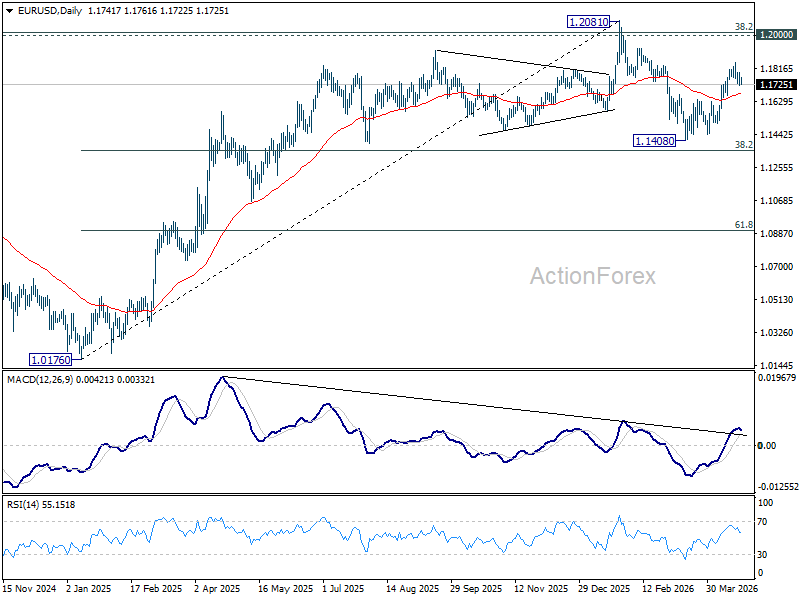
In the bigger picture, the strong support from 38.2% retracement of 1.0176 to 1.2081 at 1.1353 suggests that the pullback from 1.2081 is more likely a corrective move. Strong support was also found in 55 W EMA (now at 1.1507). Focus is back on 1.2 key cluster resistance level. Decisive break there will carry long term bullish implications. Nevertheless, break of 1.1408 support will revive the case of medium term bearish trend reversal.
GBP/USD Mid-Day Outlook
Daily Pivots: (S1) 1.3475; (P) 1.3508; (R1) 1.3542; More...
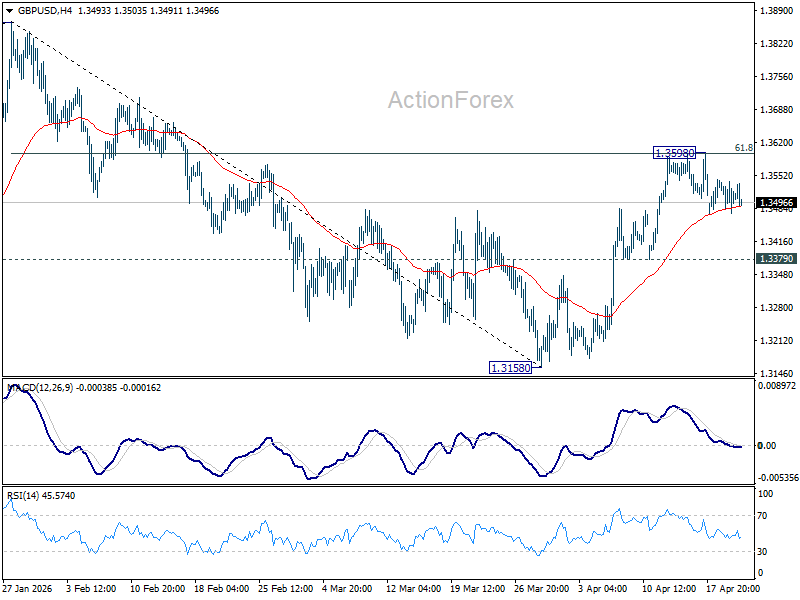
Intraday bias in GBP/USD remains neutral and more consolidations could be seen below 1.3598. With 1.3379 support intact, further rise is favor. On the upside, sustained break of 61.8% retracement of 1.3867 to 1.3158 at 1.3596 will pave the way to retest 1.3867 high. However, firm break of 1.3379 will bring deeper fall back to 1.3158 low instead.
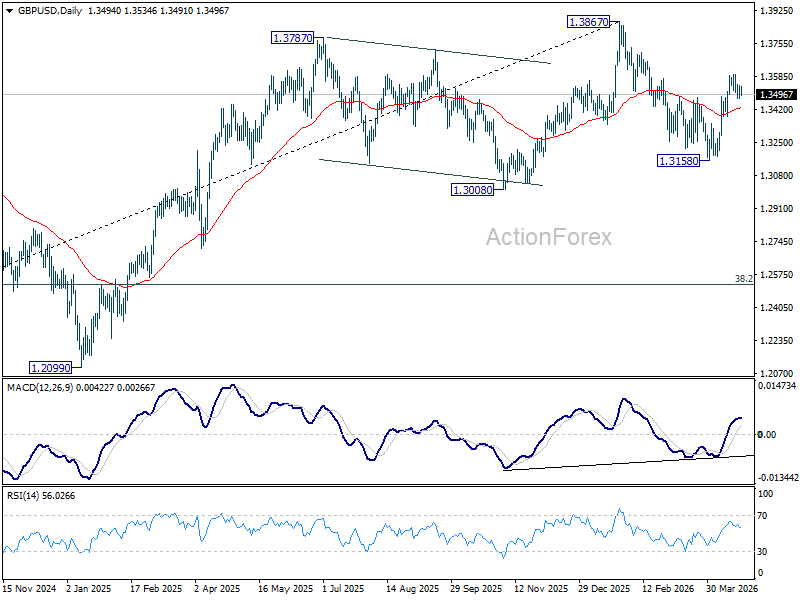
In the bigger picture, current development suggests that price actions from 1.3867 are merely a corrective pattern within the broader up trend from 1.0351 (2022 low). With 1.3008 support intact, medium term bullishness is maintained and break of 1.3867 is back in favor for a later stage, towards 1.4248 key resistance (2021 high).
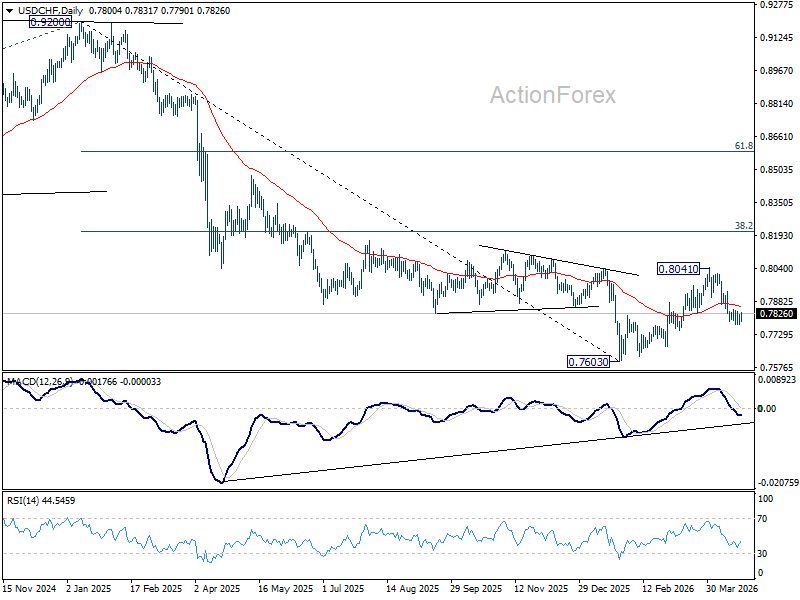
USD/CHF Mid-Day Outlook
Daily Pivots: (S1) 0.7782; (P) 0.7805; (R1) 0.7830; More….
Intraday bias in USD/CHF remains neutral as consolidations continue above 0.7774. Stronger recovery might be seen but upside should be limited below 0.7933 resistance to bring another fall. Sustained break of 61.8% retracement of 0.7603 to 0.8041 at 0.7770 will resume the decline from 0.8041 to retest 0.7603 low.
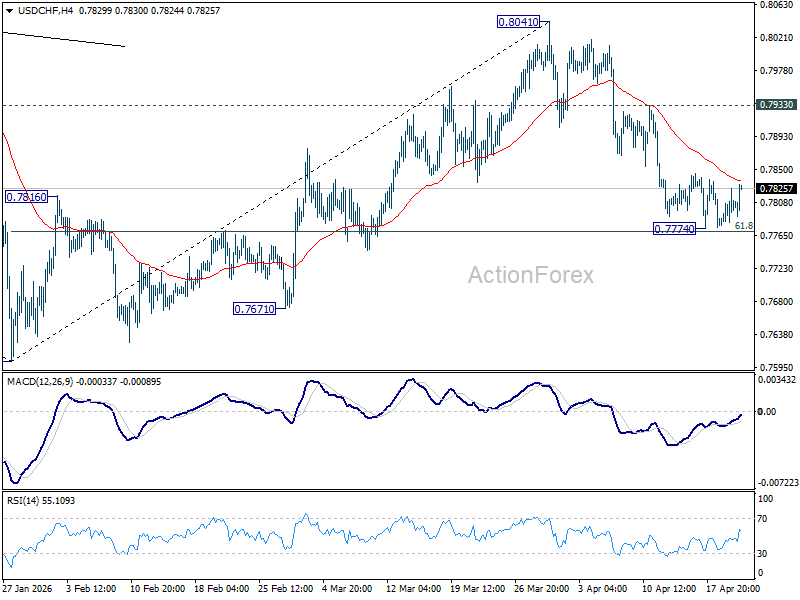
In the bigger picture, rebound from 0.7603 medium term bottom is seen as correcting the fall from 0.9200 only. Rejection by 55 W EMA (now at 0.8059) will affirm this bearish case, and setup down trend resumption to 100% projection of 1.0146 (2022 high) to 0.8332 from 0.9200 at 0.7382 at a later stage. Though, sustained break of 55 W EMA will suggest that it's probably correcting the larger scale down trend from 1.0146 (2022 high).
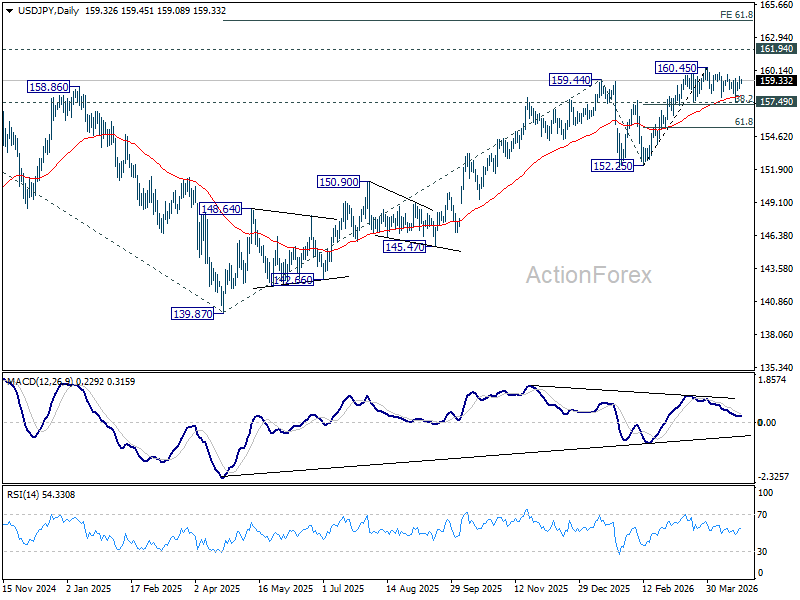
USD/JPY Mid-Day Outlook
Daily Pivots: (S1) 158.80; (P) 159.28; (R1) 159.87; More...
USD/JPY is still gyrating in range below 160.45 as consolidations continues. Intraday bias stays neutral for the moment. Further rise is expected with 157.49 cluster support (38.2% retracement of 152.25 to 160.45 at 157.31) intact. On the upside break of 160.45 will target a retest on 161.94 high. However, firm break of 157.31/49 will bring deeper fall back to 61.8% retracement at 155.38 next.
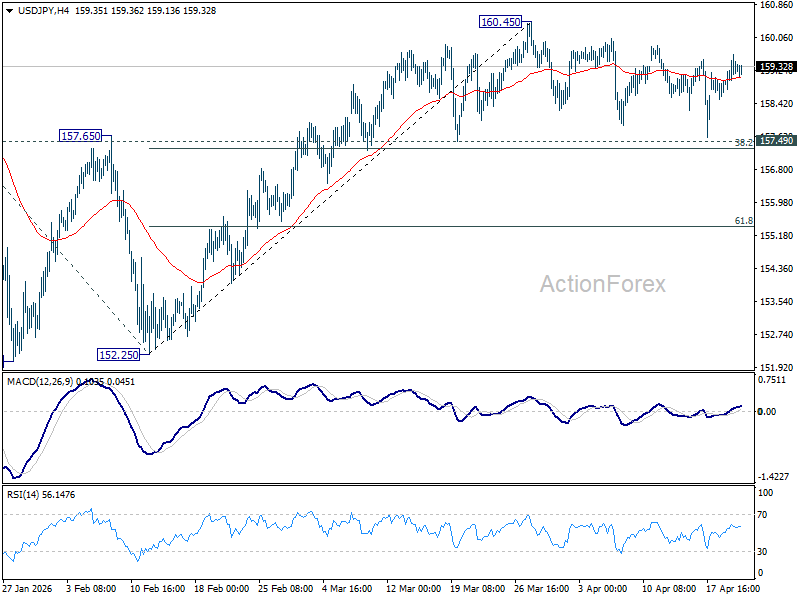
In the bigger picture, outlook is unchanged that corrective pattern from 161.94 (2024 high) should have completed with three waves at 139.87. Larger up trend from 102.58 (2021 low) could be ready to resume through 161.94. This will remain the favored case as long as 55 W EMA (now at 153.80) holds. Firm break of 161.94 will pave the way to 61.8% projection of 102.58 to 161.94 from 139.87 at 176.75.
Split Personality Markets: Stocks Up, Oil Warns, Dollar Torn
Markets are showing a clear "split personality" right now. Equities are pushing higher on the back of the extended US–Iran ceasefire, while oil continues to signal caution and Dollar is caught between opposing forces. The result is a fragmented picture where no single macro narrative is dominating.
US futures are trading higher after President Donald Trump announced an indefinite extension of the ceasefire. Despite stalled talks, the move has removed the immediate threat of escalation for now, allowing equities to lean risk-on. For the S&P 500 and NASDAQ, the extension is effectively a “yellow light”—not a full green signal, but enough to justify holding or adding exposure in the near term.
At the same time, equities are increasingly pivoting back to fundamentals. Strong Q1 earnings and the continued momentum of the AI-driven investment cycle are providing a more compelling narrative than the geopolitical stalemate. There is a clear effort to decouple from daily headlines, with investors focusing on earnings visibility rather than conflict risk.
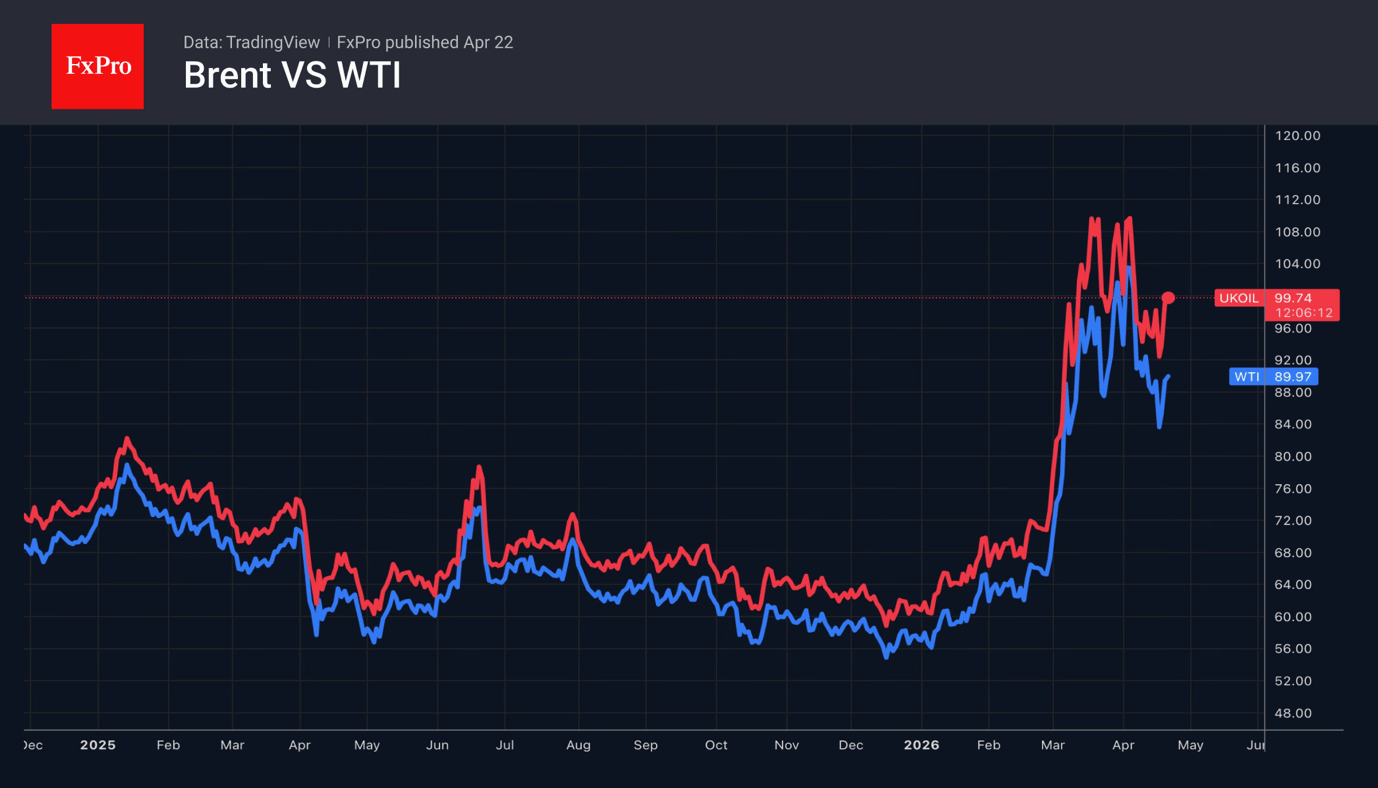
In contrast, energy markets are not looking through the situation. Brent may have cooled from peaks above $120, but it remains firmly anchored near $100. This suggests traders are pricing in prolonged disruption in the Strait of Hormuz, even without a full escalation scenario. Oil is effectively signaling that supply risks remain embedded in the system.
This divergence is feeding into the broader inflation outlook. Even without further escalation, the surge in energy costs has already reset the inflation floor. Higher fuel and transport costs are filtering through global supply chains, keeping price pressures elevated and complicating the monetary policy outlook.
Bond markets are reflecting this skepticism. Yields remain supported by the view that Fed cannot pivot quickly toward easing. The persistence of inflation risks means policy is likely to stay restrictive for longer than markets might otherwise expect, with some global central banks pivoting towards tightening.
Currency markets are where these conflicting forces are most visible. Dollar is being pulled in opposite directions. On one hand, the ceasefire extension reduces safe-haven demand. On the other, elevated yields continue to attract capital inflows. Commodity currencies such as the Canadian and Australian Dollars are also caught in this crosscurrent. Higher oil and gas prices are supportive, but the risk of a global slowdown linked to energy-driven inflation caps upside. The result is choppy, range-bound trading rather than directional moves.
This week’s FX performance reflects this lack of conviction. Kiwi is leading on domestic rate expectations, followed by Loonie and Dollar. Yen is the weakest, with Euro and Aussie also under pressure. Sterling and Swiss Franc are holding in the middle. There is no coherent global theme driving currencies.
The broader takeaway is that markets are no longer aligned. Equities are pricing stability, oil is pricing disruption, and bonds are pricing inflation persistence. Each asset class is telling a different story.
Until there is clarity on whether US–Iran talks resume or a decisive shift in geopolitical conditions, this split personality is likely to persist. Markets are not ignoring the risks—but they are no longer reacting to them in the same way.
In Europe, at the time of writing, FTSE is down -0.02%. DAX is down -0.01%. CAC is down -0.30%. UK 10-year yield is down -0.011 at 5.128. Germany 10-year yield up 0.002 at 3.006. Earlier in Asia, Nikkei rose 0.40%. Hong Kong HSI fell -1.22%. China Shanghai SSE rose 0.52%. Singapore Strait Times fell -0.24%. Japan 10-year JGB yield rose 0.013 to 2.399.
UK CPI Hits 3.3% as Fuel Costs Drive Inflation Higher, Pipeline Pressures Build
UK CPI rose to 3.3% in March as fuel costs pushed inflation higher. Core inflation eased slightly, but rising PPI and oil prices signal building pipeline pressures. Read more.
Japan's Exports Rise 11.7% in March, Trade Surplus Misses
Japan posted another solid month for exports, led by semiconductors and China demand. But the trade surplus still missed expectations as imports jumped on energy costs and a weaker Yen. Read More.
Australia Westpac Leading Index Turns Negative, Signals Below-Trend Growth Ahead.
Australia’s growth signal has turned negative. The Westpac Leading Index now points to below-trend growth, but rising energy costs and inflation risks keep RBA rate hikes firmly on the table. Read More.
Gold and Silver Recover as US Extends Iran Ceasefire, But Technical Weakness Emerges
Ceasefire relief helped stabilize Gold and Silver—but technical cracks are forming. The next move depends on whether support levels hold. Read More.
USD/JPY Mid-Day Outlook
Daily Pivots: (S1) 158.80; (P) 159.28; (R1) 159.87; More...
USD/JPY is still gyrating in range below 160.45 as consolidations continues. Intraday bias stays neutral for the moment. Further rise is expected with 157.49 cluster support (38.2% retracement of 152.25 to 160.45 at 157.31) intact. On the upside break of 160.45 will target a retest on 161.94 high. However, firm break of 157.31/49 will bring deeper fall back to 61.8% retracement at 155.38 next.
In the bigger picture, outlook is unchanged that corrective pattern from 161.94 (2024 high) should have completed with three waves at 139.87. Larger up trend from 102.58 (2021 low) could be ready to resume through 161.94. This will remain the favored case as long as 55 W EMA (now at 153.80) holds. Firm break of 161.94 will pave the way to 61.8% projection of 102.58 to 161.94 from 139.87 at 176.75.
Bulls Control Crude Oil
- The conflict in the Middle East has altered the dynamics of the oil market.
- The longer the Strait of Hormuz remains blocked, the higher the risks of a Brent rally.
Don’t expect things to return to normal. Before the conflict in the Middle East, the oil market was in the hands of the bears. Demand was falling due to the shift towards alternative energy sources, whilst supply was rising. OPEC+ was gradually increasing production to avoid losing market share and investors were talking about a record surplus. Today, the IEA estimates the loss of supply at 12 million barrels per day, which is more than during the Arab oil embargo of 1973–1974 and the Iranian Revolution of 1978–1979 combined. However, it would be rather naive to think that the end of the war will cause prices to plummet.
Even after the Strait of Hormuz reopens, it will take months to restore production in the damaged energy infrastructure of the Persian Gulf. At the same time, countries are seriously concerned about energy security and will work hard to boost oil demand. Interestingly, the current decline in demand is preventing Brent from soaring too high.
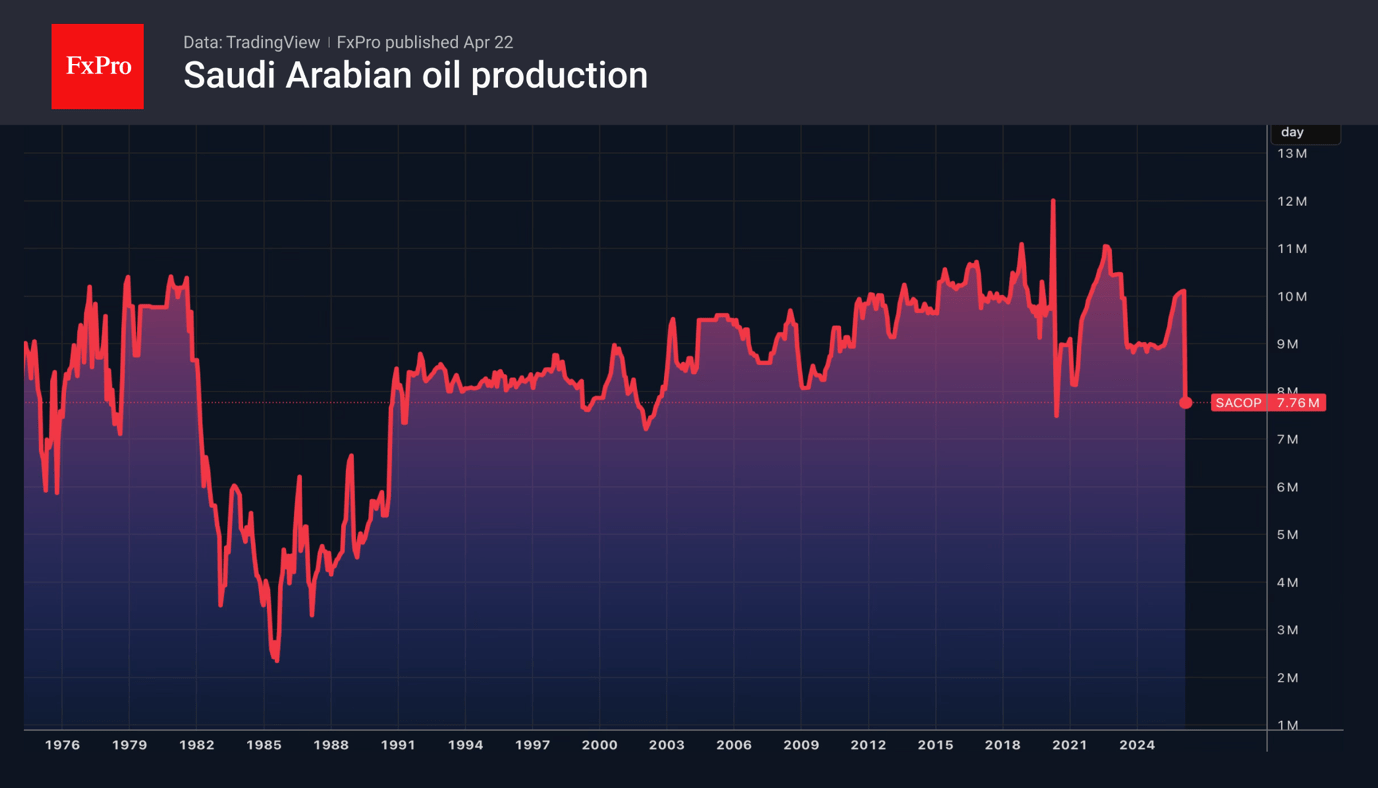
Vitol, a crude oil trader, estimates a demand loss of around 4 million barrels per day due to excessively high prices. If we add Saudi Arabia’s workarounds, the increase in US crude exports, and active purchases by China and India of Russian barrels stranded at sea, then the stabilisation of Brent near $100 starts to look logical. The math suggests that the actual deficit is closer to 5% than 10%.
The problem is that the crude on Russian tankers at sea is running out, the US’s ability to ramp up supply is limited by existing infrastructure, and a resumption of fire in the Middle East could lead to the Houthis blocking Saudi Arabia’s alternative routes. With this background, Citi’s forecast of Brent rising to $110 a barrel should the Strait of Hormuz be blocked for another month will seem far too modest.
The longer the US and Iran delay reaching a peace agreement, the more devastating the oil crisis risks being for the global economy. However, optimism has not yet faded. Investors are operating on the assumption that ‘it could be worse’. A fragile peace in the form of an indefinite ceasefire is better than war. The transit fee paid to Iran is seen as compensation for the bombing of its territory.
Republicans are Indirectly Backing a Tougher Fed Policy
- Congress is in no hurry to confirm Warsh.
- US-Iran talks have broken down.
The US dollar has launched a counter-offensive thanks to the breakdown of US-Iran talks and a 1.7% month-on-month rise in retail sales in March. The economy is strong, oil prices are high and could rise even further, whilst the futures market is pricing in a 64% probability that the key rate will remain at 3.75% until the end of the year. This is all the more so given that Congress intends to throw a spanner in the works for Fed chair nominee Kevin Warsh.
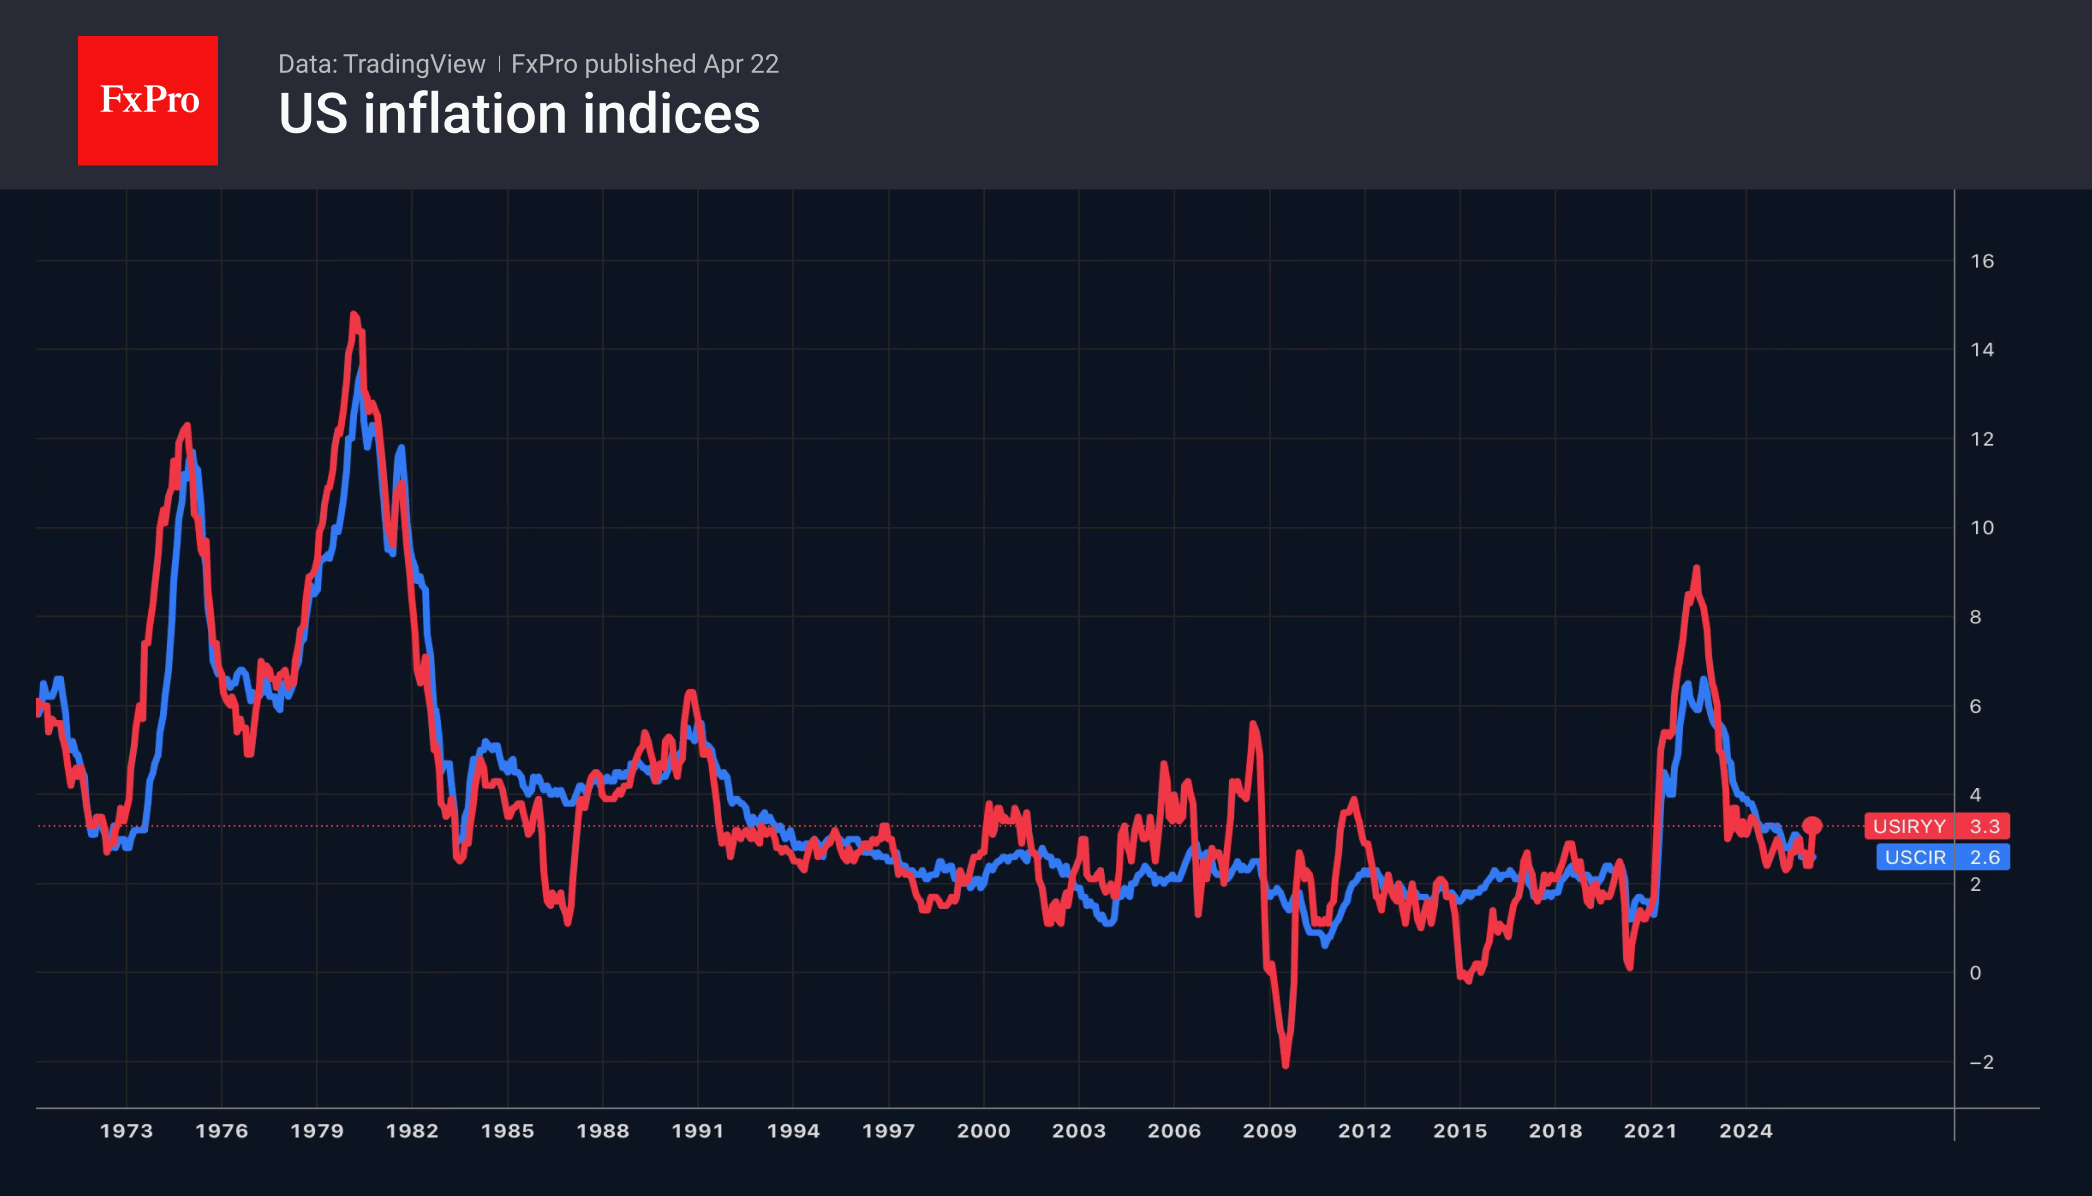
In his address to lawmakers, Donald Trump’s nominee stated that the Fed should focus on core inflation. Meanwhile, some trimmed indicators suggest that prices are approaching the 2% target, although they are not quite there yet. The issue of the Fed’s independence deserves special attention, and Kevin Warsh has promised to make interest rate decisions independently and has stated that the President has not asked him to cut rates.
The appointment of a new Fed Chair will depend on the judicial investigation into Jerome Powell. While this is ongoing, the Republicans are not prepared to vote for him. The Kalshi forecasting market estimates the chances of a change in the Fed chairmanship by 15 May at 24%, and by 30 June at 65%. As long as Powell remains in the chair, market expectations are drifting towards a tighter policy stance, playing into the US dollar’s hands.
EURUSD continues to react to movements in oil and US indices. The surge in Brent and the fall in the S&P 500 in response to news that Iran had broken off negotiations with the US forced the euro to retreat. The president smoothed over the negativity with a statement on the indefinite extension of the ceasefire, which investors interpreted as a manifestation of TACO, or ‘Trump Always Chickens Out’.
At the same time, the Strait of Hormuz remains closed, which threatens to trigger a renewed rise in Brent prices and exacerbate the eurozone’s problems. Nevertheless, the fear of missing out has driven traders to the point where they are ignoring bad news. How long will this last?
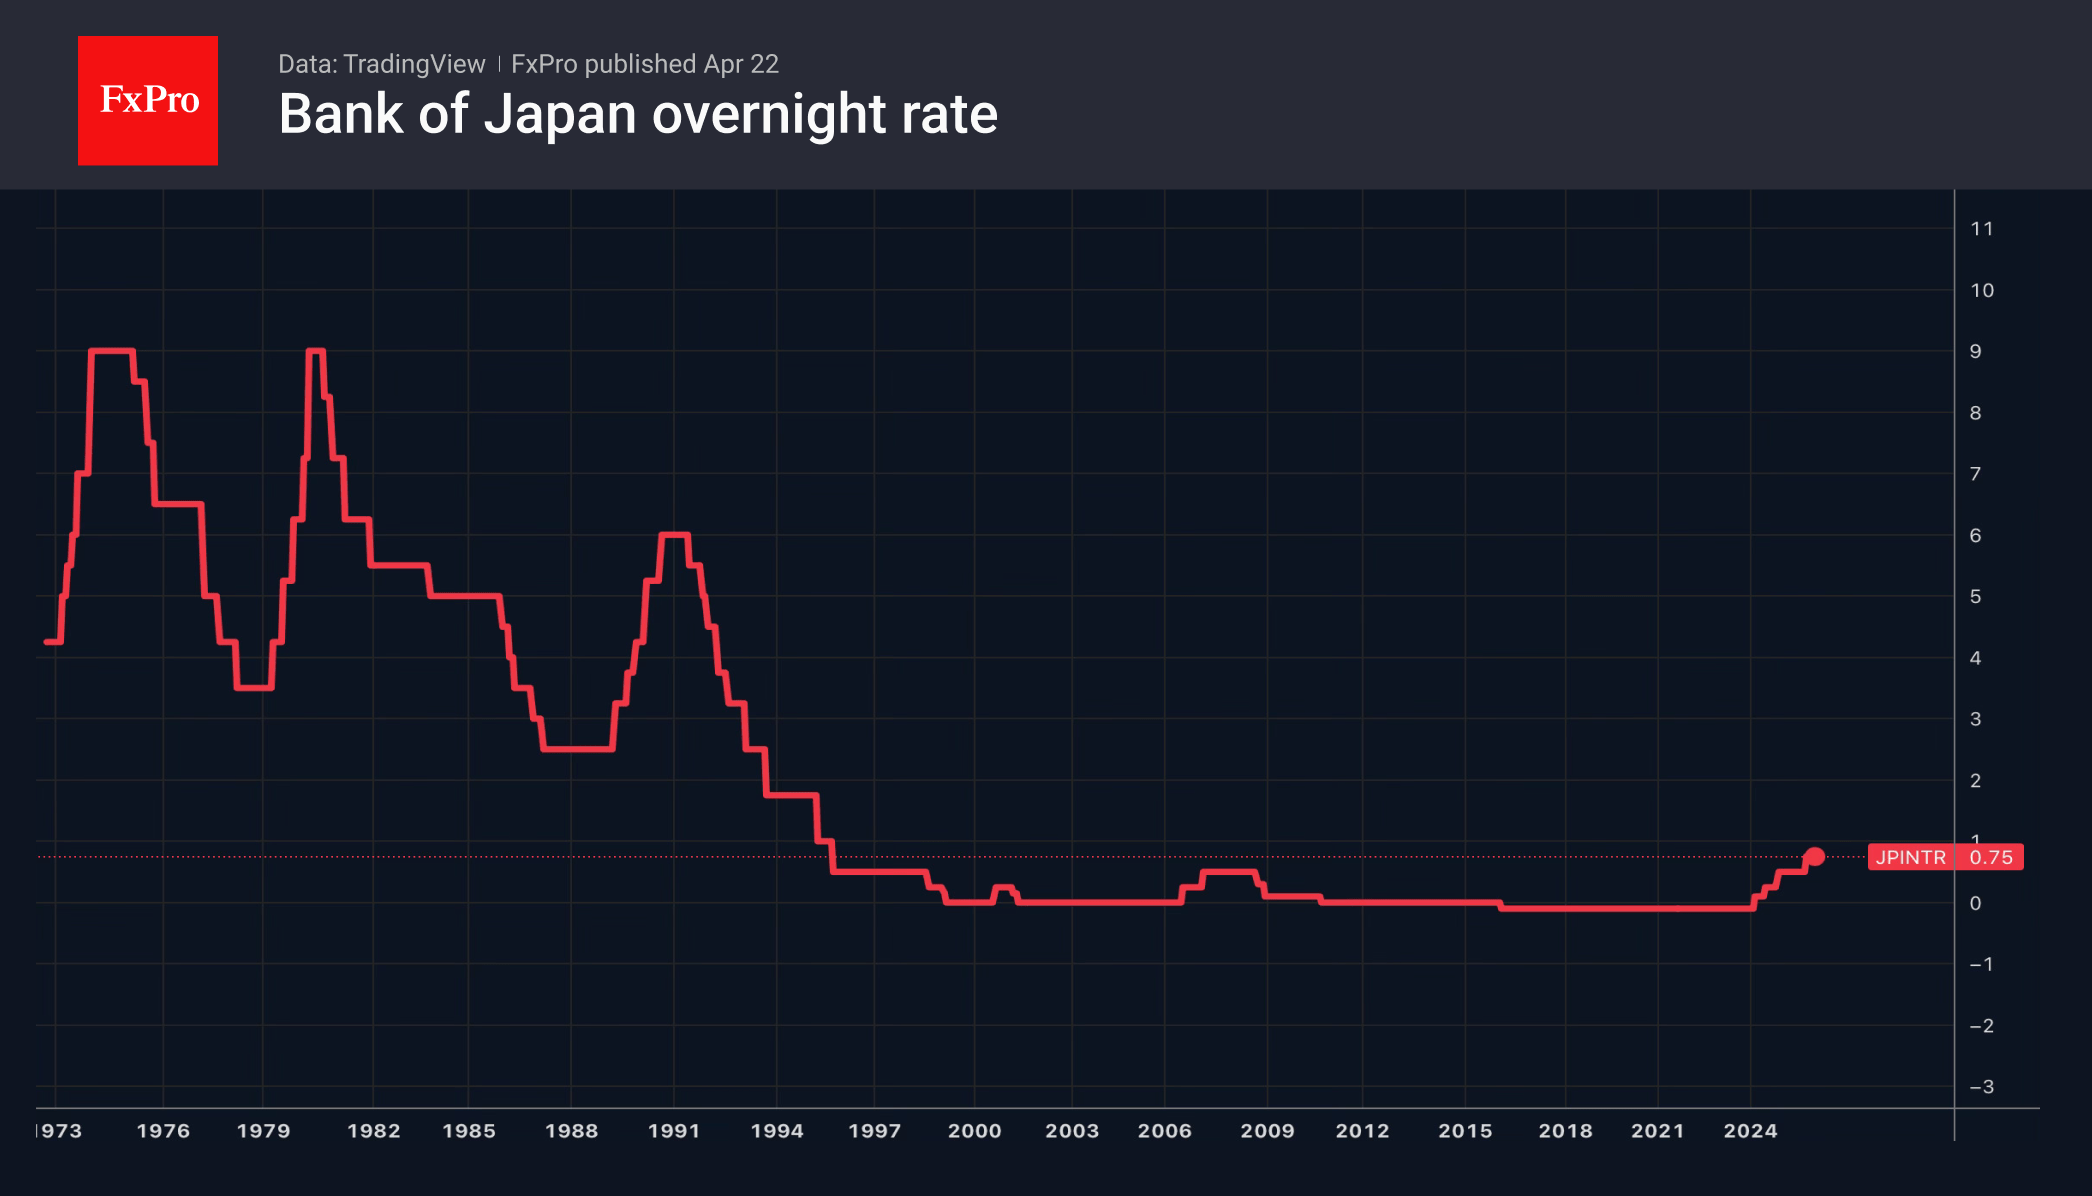
The breakdown of US-Iran talks, as well as the postponement of the Bank of Japan’s expected rate hike, has put the initiative back in the hands of the bulls on USDJPY. 80% of 51 Bloomberg experts predict that the BoJ will hold steady in April. This contrasts with the March survey, when 37% of respondents expected monetary policy to be tightened at the next Governing Board meeting.
USD/JPY Pulls Higher: Yen Doubts Bank of Japan
USD/JPY climbed to 159.36 mid-week, with the Japanese yen losing ground for a second consecutive day. The market is pricing in the Bank of Japan's policy outlook ahead of next week's meeting.
The regulator is likely to keep rates unchanged while continuing to analyse the impact of the Middle East conflict on the economy. At the same time, a signal to return to policy normalisation may emerge in June.
A revision to forecasts is also expected. Inflation data may be revised upward amid rising energy prices, while economic growth forecasts may be revised downward due to external risks.
On the positive side, Japan's exports grew for the seventh consecutive month, supported by demand from China and ASEAN countries.
Additional pressure on the yen is coming from a strengthening US dollar following the breakdown of the second round of US-Iran negotiations, although the ceasefire has been formally extended.
Technical Analysis
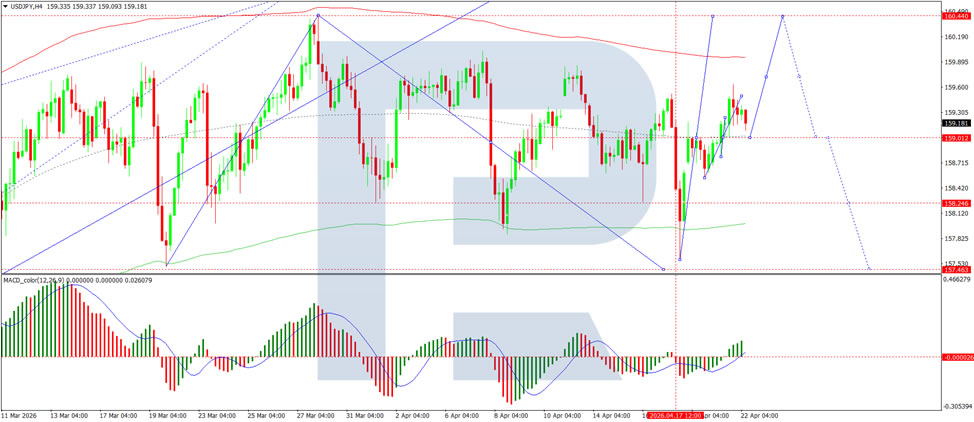
On the H4 chart, USD/JPY formed a consolidation range around the 159.02 level and broke higher to 159.62. A correction to 159.02 is likely, followed by a possible rise to 160.44. Subsequently, a move lower towards 157.70 may develop, with a potential extension to 156.00. Technically, this scenario is confirmed by the MACD indicator, with its signal line above the zero level and pointing firmly upwards, reflecting the potential for the upward move to continue.
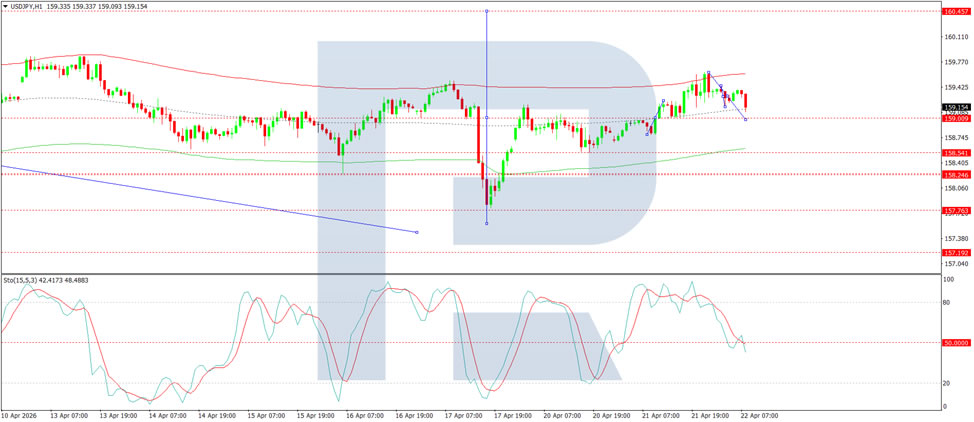
On the H1 chart, the market is forming the structure of a downward wave to 159.00. A move higher towards 160.44 is possible thereafter. The scenario is confirmed by the Stochastic oscillator, with its signal line below the 50 level and pointing firmly downwards towards 20, indicating that short-term downside potential remains.
Conclusion
USD/JPY continues to push higher as market doubts over the Bank of Japan's policy direction weigh on the yen. With the BoJ expected to hold rates steady at next week's meeting while assessing the impact of the Middle East conflict, a potential signal for policy normalisation may not come until June. Upward revisions to inflation forecasts and downward revisions to growth expectations add to the complex outlook. While stronger exports provide some positive news, pressure on the yen persists from a firmer dollar following the breakdown of US-Iran talks. Technically, further upside towards 160.44 appears likely before any sustained pullback, with the pair's direction hinging on next week's BoJ signals.
EURUSD Elliott Wave Forecast: Support Seen Near 1.165
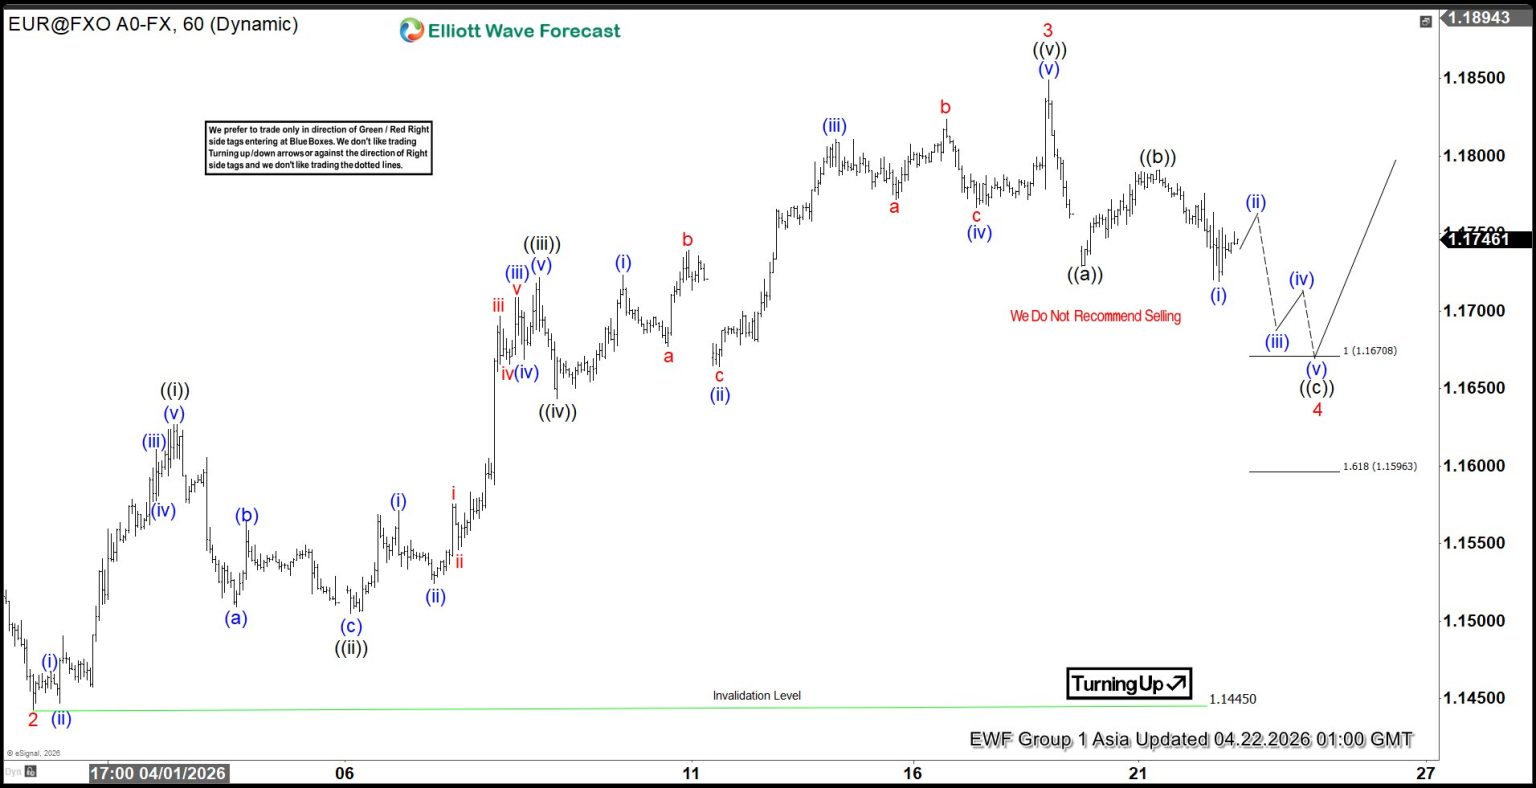
The rally in EURUSD from the March 14, 2026 low is unfolding as a clear five‑wave impulsive Elliott Wave structure. Wave 1 concluded at 1.164, followed by a corrective pullback in wave 2 that ended at 1.144. The advance in wave 3 reached 1.185, which aligns precisely with the 161.8% Fibonacci extension of wave 1. This measured extension reinforces the probability that another leg higher remains possible, ultimately completing wave 5 and confirming the impulsive sequence.
The internal subdivision of wave 3 developed as another impulsive structure of lesser degree. From the termination of wave 2, wave ((i)) ended at 1.1627, while the corrective dip in wave ((ii)) found support at 1.1505. The pair then extended higher in wave ((iii)) toward 1.172, before a modest pullback in wave ((iv)) concluded at 1.1643. The final leg, wave ((v)), carried prices to 1.185, thereby completing wave 3 in the higher degree count. This precise subdivision underscores the integrity of the impulsive structure and provides clarity for the ongoing correction.
Currently, the market is engaged in a wave 4 pullback, unfolding as a zigzag Elliott Wave structure. From the wave 3 peak, wave ((a)) ended at 1.1729, while wave ((b)) retraced higher to 1.179. The final leg, wave ((c)), is expected to terminate within the 1.159–1.167 zone. This area represents a typical corrective target and should attract buyers, setting the stage for renewed upside momentum. As long as the pivot at 1.144 remains intact, the broader outlook favors continuation higher once the correction completes, supporting the case for a sustained bullish trend.
EURUSD 60-Minute Elliott Wave Chart
EURUSD Elliott Wave Video:
https://www.youtube.com/watch?v=5NbqKaE72h8
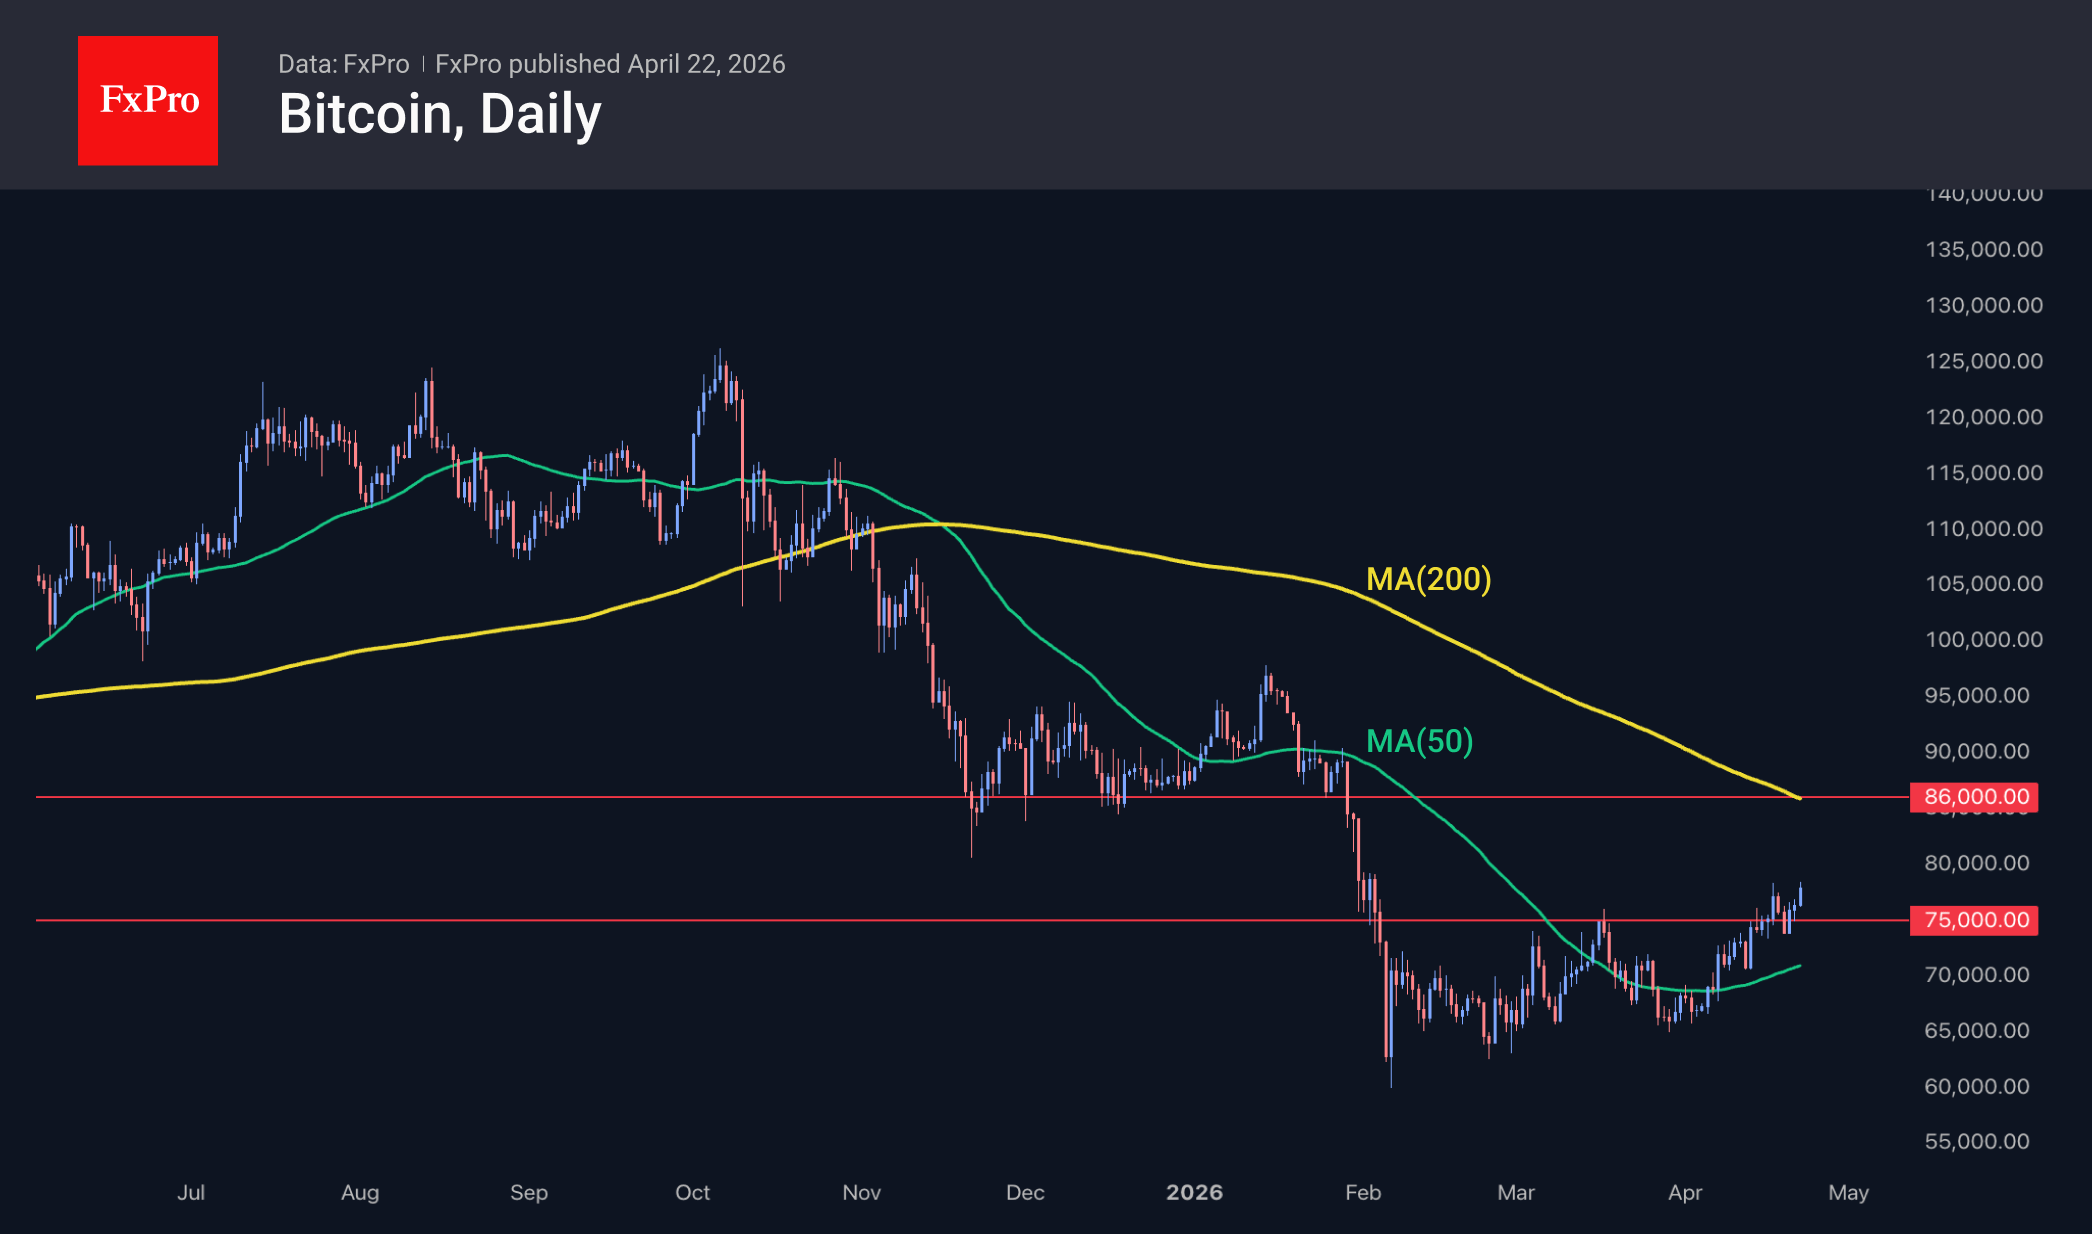
Bitcoin Should Have No Trouble Sising to $86K
Market Overview
The cryptocurrency market capitalisation stands at $2.61T, up 2.48% over the past 24 hours. Leading the gains are Dash (+7.9%), Cosmos (+6.5%) and Immutable (+5.9%), while laggards include Basic Attention Token (−0.2%), Aave (+0.1%) and Theta (+0.3%). The sentiment index fell by 1 point over the past day to 32, remaining in the fear zone.
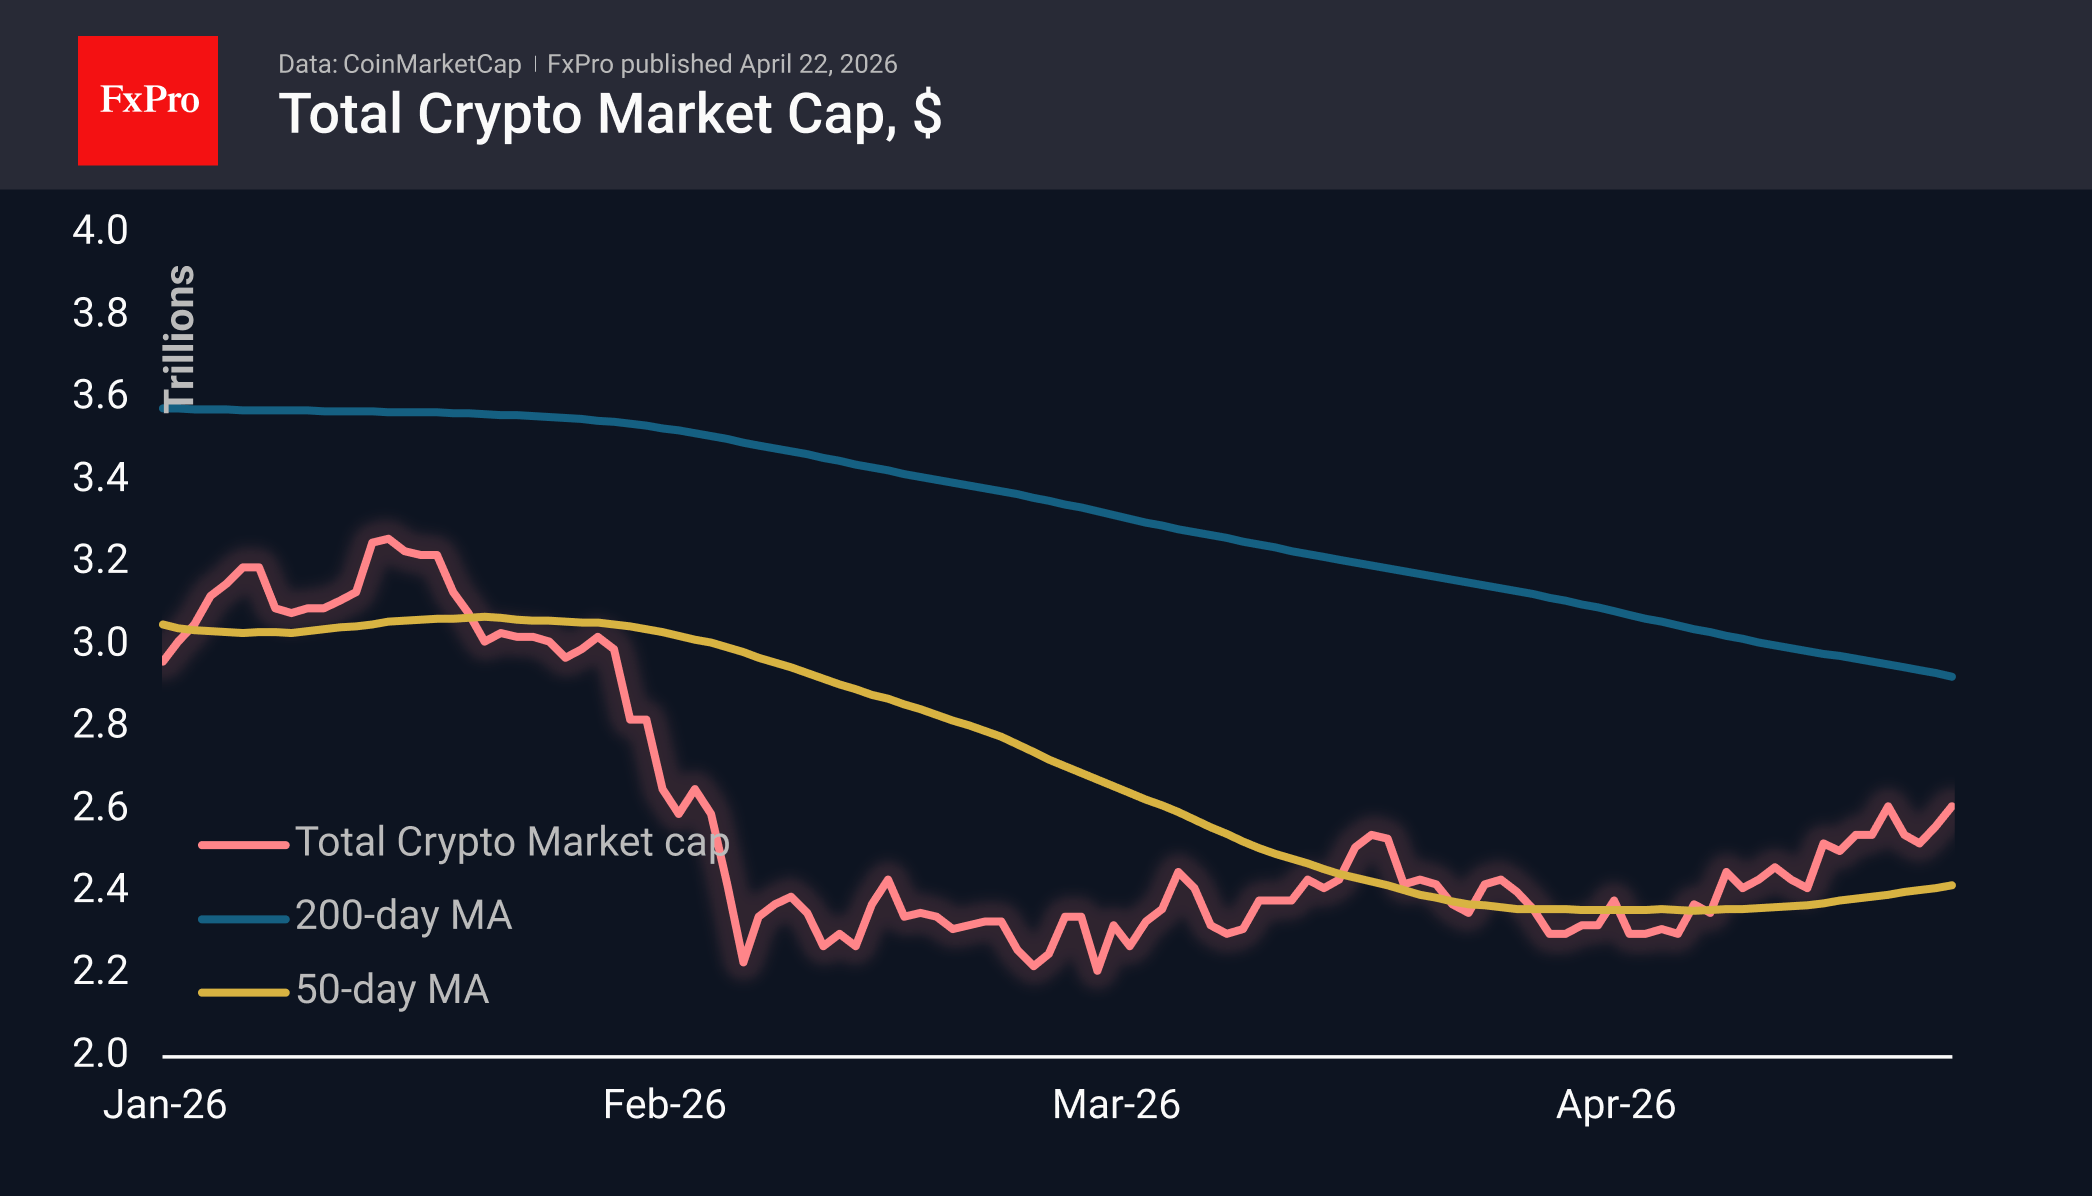
Bitcoin is rewriting 11-week highs, briefly slipping above $78.4K. This marks a continuation of the upward trend that has been in place since the start of the month. In our view, the $75–86K range is not saturated with strong resistance levels, and in the absence of significant negative factors, we anticipate a positive upward momentum. However, at $86K, the leading cryptocurrency will encounter the 200-day moving average, which is also near an important pivot zone. Breaking through this zone would signify much more than the current relatively quiet range.
News Background
Anthony Scaramucci, founder of investment firm SkyBridge Capital, compared Bitcoin to the dollar and stated that the leading cryptocurrency meets all the requirements of a monetary system. According to him, BTC is becoming part of the investment portfolios of both private individuals and institutions worldwide.
The first cryptocurrency could reach a new all-time high within 12 months, suggests Michael van de Poppe, founder of MN Trading. He notes that following deep corrections, Bitcoin typically rebounds by 30–60% within six months.
Consideration of the CLARITY Act, a bill to regulate the crypto market, may be postponed until May, said Senator Thom Tillis, who is leading negotiations between representatives of the crypto industry and the banking sector. The main obstacle remains the provision regarding fees for staking stablecoins.
A consortium of 12 European banks led by Qivalis has chosen the Fireblocks platform to launch a euro-pegged stablecoin. The project is being developed in accordance with MiCA.
The UK has unveiled a strategy for reforming the payments sector. The authorities plan to bring the regulation of traditional services, stablecoins and tokenised deposits under a single legal framework.