
Sample Category Title
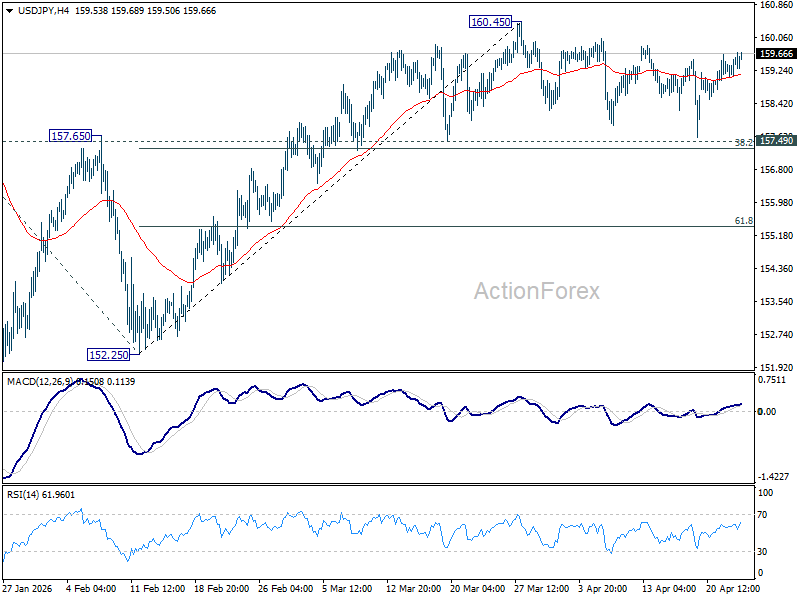
USD/JPY Daily Outlook
Daily Pivots: (S1) 159.20; (P) 159.38; (R1) 159.66; More...
Intraday bias in USD/JPY remains neutral and more consolidations could be seen. Further rise is expected with 157.49 cluster support (38.2% retracement of 152.25 to 160.45 at 157.31) intact. On the upside break of 160.45 will target a retest on 161.94 high. However, firm break of 157.31/49 will bring deeper fall back to 61.8% retracement at 155.38 next.
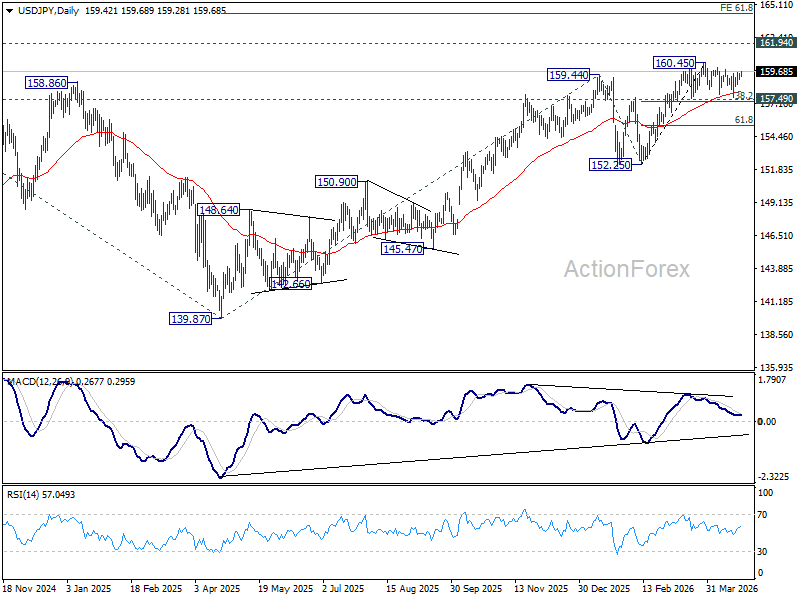
In the bigger picture, outlook is unchanged that corrective pattern from 161.94 (2024 high) should have completed with three waves at 139.87. Larger up trend from 102.58 (2021 low) could be ready to resume through 161.94. This will remain the favored case as long as 55 W EMA (now at 153.80) holds. Firm break of 161.94 will pave the way to 61.8% projection of 102.58 to 161.94 from 139.87 at 176.75.
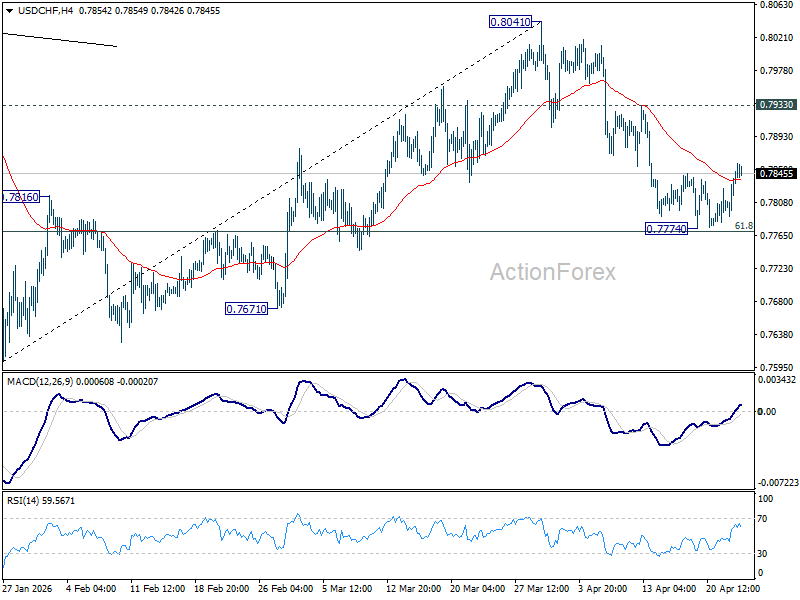
USD/CHF Daily Outlook
Daily Pivots: (S1) 0.7808; (P) 0.7830; (R1) 0.7867; More….
USD/CHF is staying inc consolidations above 0.7774 and intraday bias remains neutral. Stronger recovery might be seen but upside should be limited below 0.7933 resistance to bring another fall. Sustained break of 61.8% retracement of 0.7603 to 0.8041 at 0.7770 will resume the decline from 0.8041 to retest 0.7603 low.
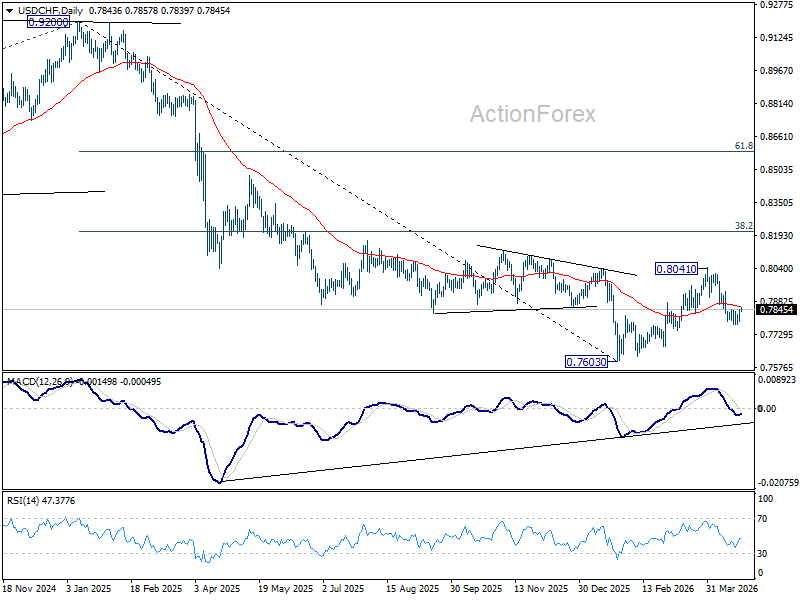
In the bigger picture, rebound from 0.7603 medium term bottom is seen as correcting the fall from 0.9200 only. Rejection by 55 W EMA (now at 0.8059) will affirm this bearish case, and setup down trend resumption to 100% projection of 1.0146 (2022 high) to 0.8332 from 0.9200 at 0.7382 at a later stage. Though, sustained break of 55 W EMA will suggest that it's probably correcting the larger scale down trend from 1.0146 (2022 high).
GBP/USD Daily Outlook
Daily Pivots: (S1) 1.3484; (P) 1.3511; (R1) 1.3529; More...
GBP/USD is still extending consolidations from 1.3598 and intraday bias remains neutral. With 1.3379 support intact, further rise is favor. On the upside, sustained break of 61.8% retracement of 1.3867 to 1.3158 at 1.3596 will pave the way to retest 1.3867 high. However, firm break of 1.3379 will bring deeper fall back to 1.3158 low instead.
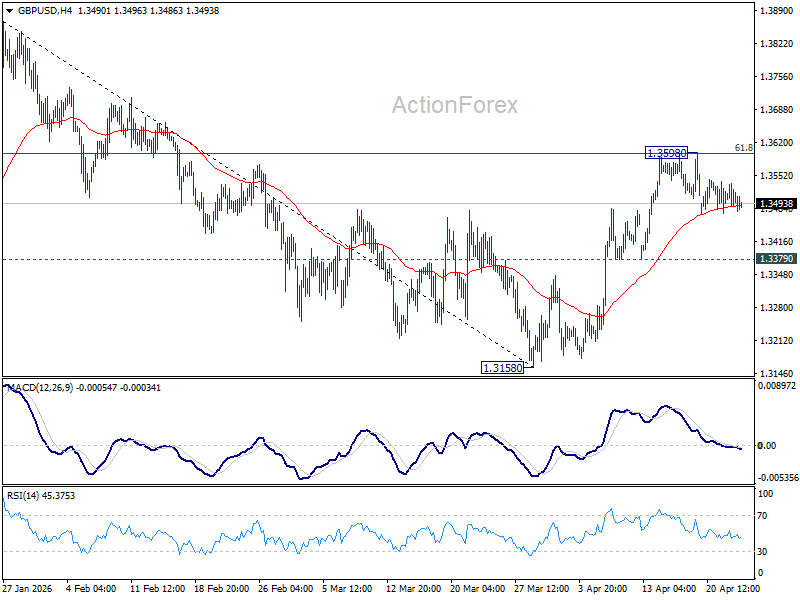
In the bigger picture, current development suggests that price actions from 1.3867 are merely a corrective pattern within the broader up trend from 1.0351 (2022 low). With 1.3008 support intact, medium term bullishness is maintained and break of 1.3867 is back in favor for a later stage, towards 1.4248 key resistance (2021 high).
Chart Alert: WTI Crude Oil at Risk of Mean Reversion Decline Below $102.25 after 5% Spike
Key takeaways
- False alarm-driven spike fades quickly: WTI crude surged 5% on unverified reports of an attack in Tehran but retraced most gains after confirmation it was a drill, highlighting headline-driven volatility amid a fragile US–Iran ceasefire.
- Market signals point to limited upside: Declining implied volatility and reduced backwardation suggest easing supply stress and cap near-term bullish momentum, reinforcing the view that the recent spike is largely “noise.”
- Technicals favour mean reversion decline: Oil is testing range resistance near the 20-day MA, with bearish momentum signals (RSI divergence) indicating downside risk toward $90.50 and potentially $86–82 unless $102.25 is decisively broken.
The US-Iran ceasefire agreement extension by US President Trump to an indefinite period is in a “fragile state”, as the US waits for Iran’s new proposal to kickstart another round of peace talks.
The US and Iran have continued to be locked in a battle for control of the Strait of Hormuz, a crucial chokepoint for global energy flows, with both sides blocking the waterway in a “game of poker” to gain leverage during the extended ceasefire.
On Wednesday, 22 April 2026, Iranian navy forces fired on commercial ships in the Strait of Hormuz while the US intercepted two Iranian-registered oil tankers.
WTI crude oil futures rallied 5% on a false alarm attack in Tehran
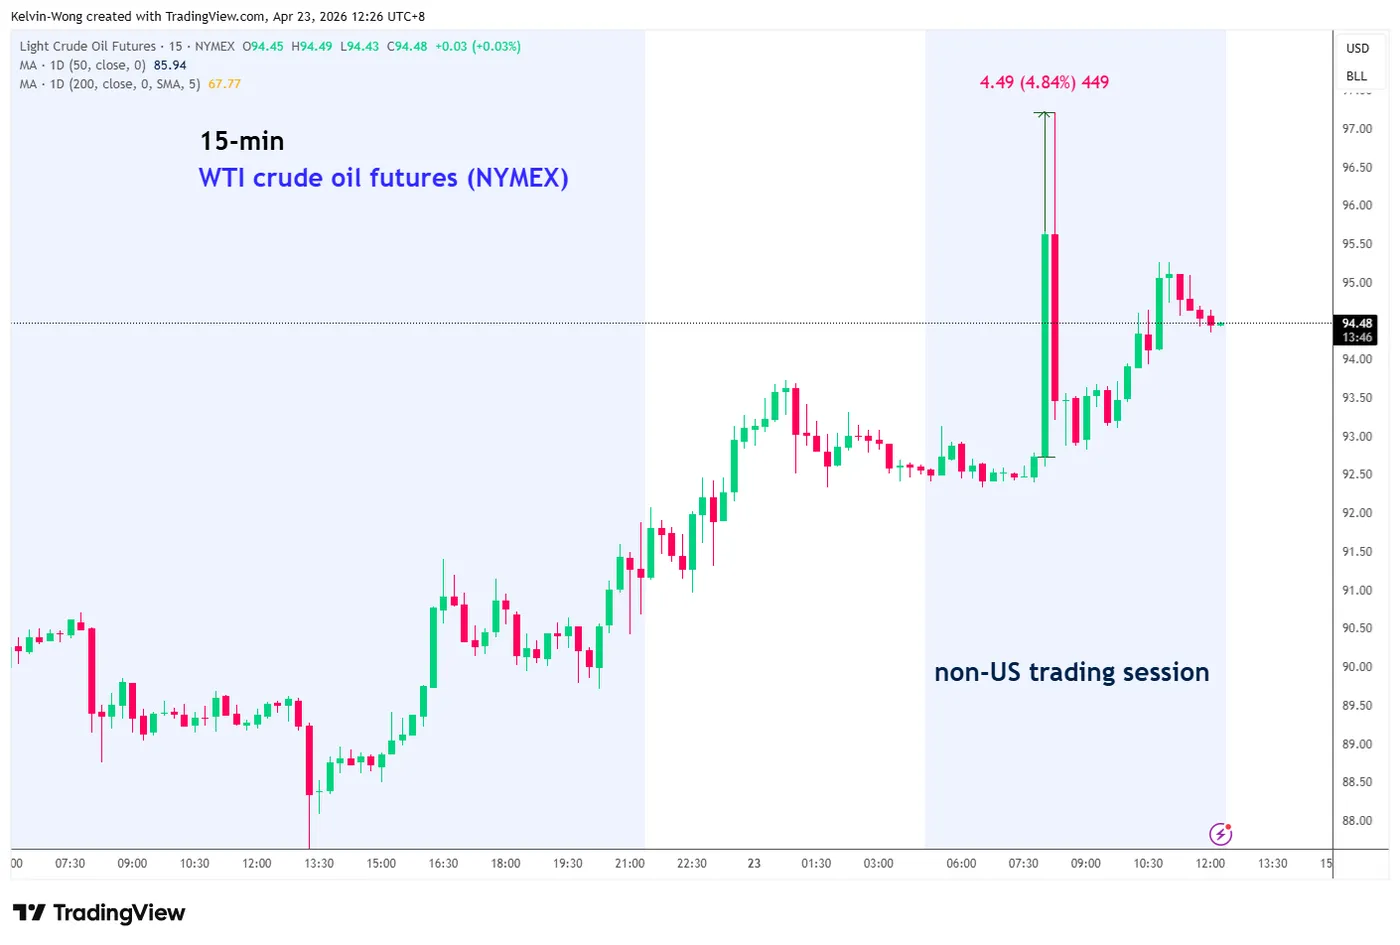
Fig. 1: West Texas crude oil futures minor trend as of 23 Apr 2026 (Source: TradingView).
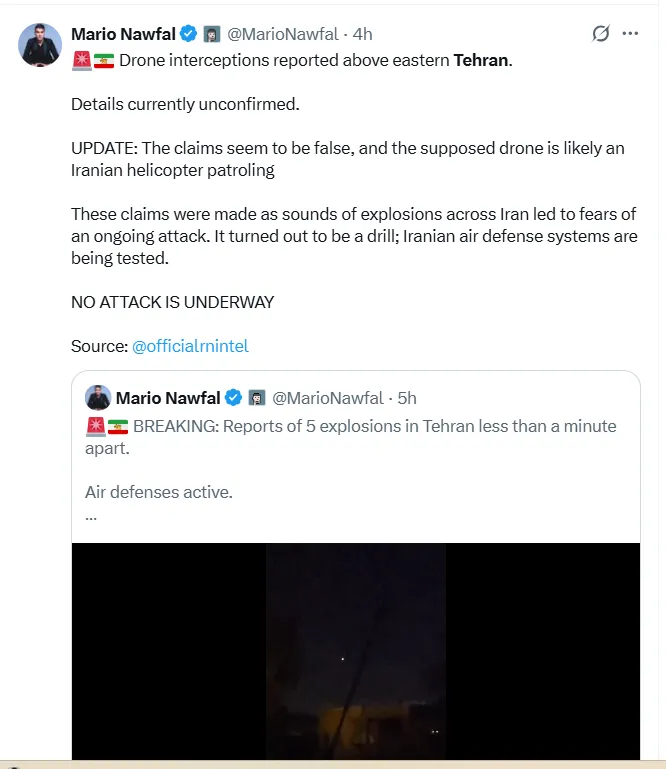
Fig. 2: Social media post on X that highlighted a false alarm attack in Tehran as of 23 Apr 2026 (Source: X).
In today's (Thursday, 23 April 2026) early Asian session at around 8.00 am Singapore time, there was an unconfirmed social media post on X that highlighted sounds of an explosion heard across Iran, leading to fears that the US-Iran extended ceasefire has ended (see Fig. 2).
West Texas crude oil futures traded on NYMEX spiked up almost 5% within 15 minutes to print an intraday high of $97.22/barrel (see Fig. 1), leading to minor risk-off activities in today’s Asian session; (S&P 500 E-mini futures -0.5%, Japan’s Nikkei 225 +0.4%, Hong Kong’s Hang Seng Index – 1.1%, AUD/USD -0.2%) at this time of writing.
Thereafter, a social post on X stated that the earlier explosions turned out to be a drill and a test on the Iranian air defence system, and there were no attacks in Tehran.
The price action of the West Texas crude oil futures has trimmed its intraday gains to 1.3% to trade at an intraday level of $94.27/barrel.
Technical analysis suggests that the current spike up in West Texas oil is more likely a “noise”, and the minor sideways range configuration since 14 April 2026 to 17 Apr 2026 remains intact.
Here are the key factors to support this narrative.
WTI crude implied volatility remains subdued, and backwardation has reduced
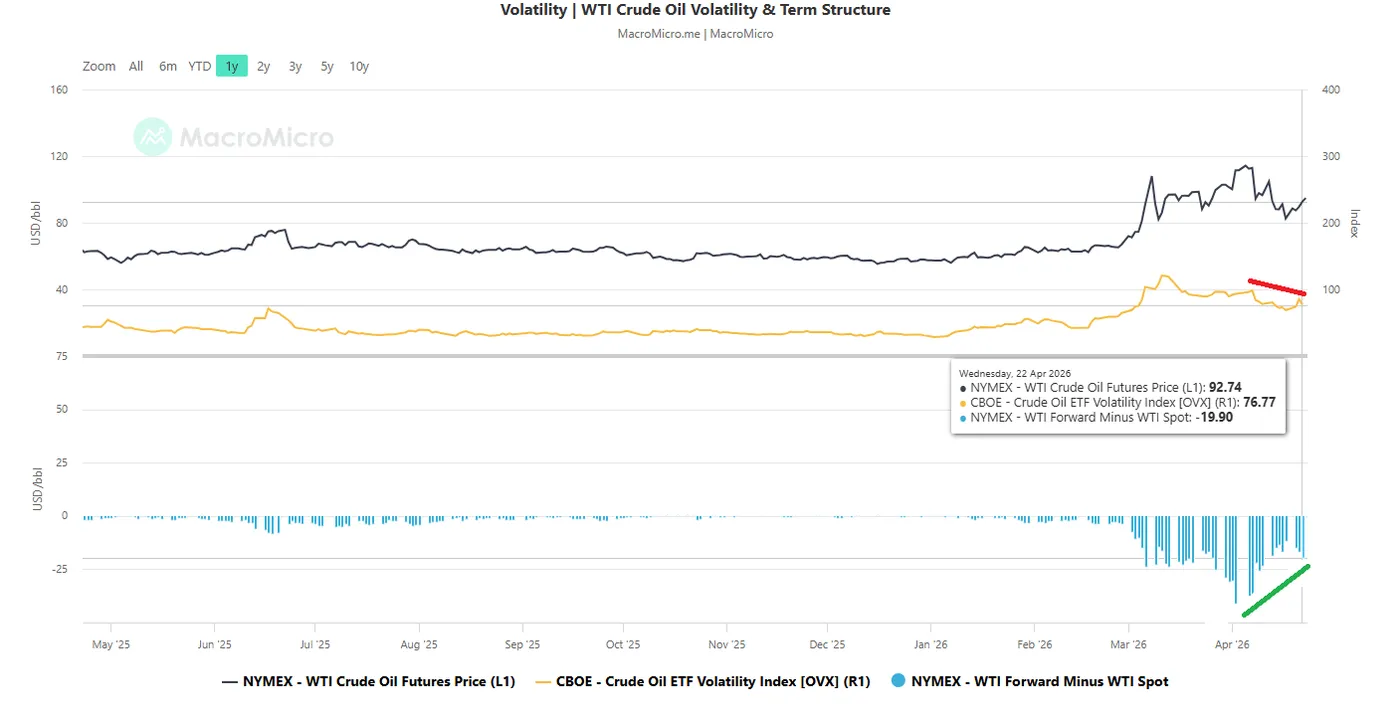
Fig. 3: WTI crude oil ETF volatility index & WTI calendar spread as of 22 Apr 2026 (Source: MacroMicro).
The WTI crude oil ETF volatility index (OVX) measures the market’s expected 30-day implied volatility in crude oil prices, derived from near-term USO ETF options.
So far, it has started to print a series of “lower highs” since the 7 April 2026 level of 98.79, towards a value of 76.77 as of 22 April 2026, putting a near-term ceiling on higher oil prices (see Fig. 3).
The recent steep rallies in oil prices seen during the onset of the US-Iran war have been accompanied by a negative WTI crude oil calendar spread, where the 12-month futures price is less than the spot price.
A negative spread (backwardation) signals perceived near-term supply shortages, where immediate demand is pushing spot prices above futures.
The backwardation (WTI 12-month futures minus spot) is now at -19.90 as of 22 April 2026, less than its recent peak backwardation level of -41.57, printed earlier on 2 April 2026 (see Fig. 2).
Let’s now focus on the potential short-term trajectory (1 to 3 days) of WTI crude oil.
WTI Crude Oil – Retested 20-day moving average resistance, at risk of mean reversion decline
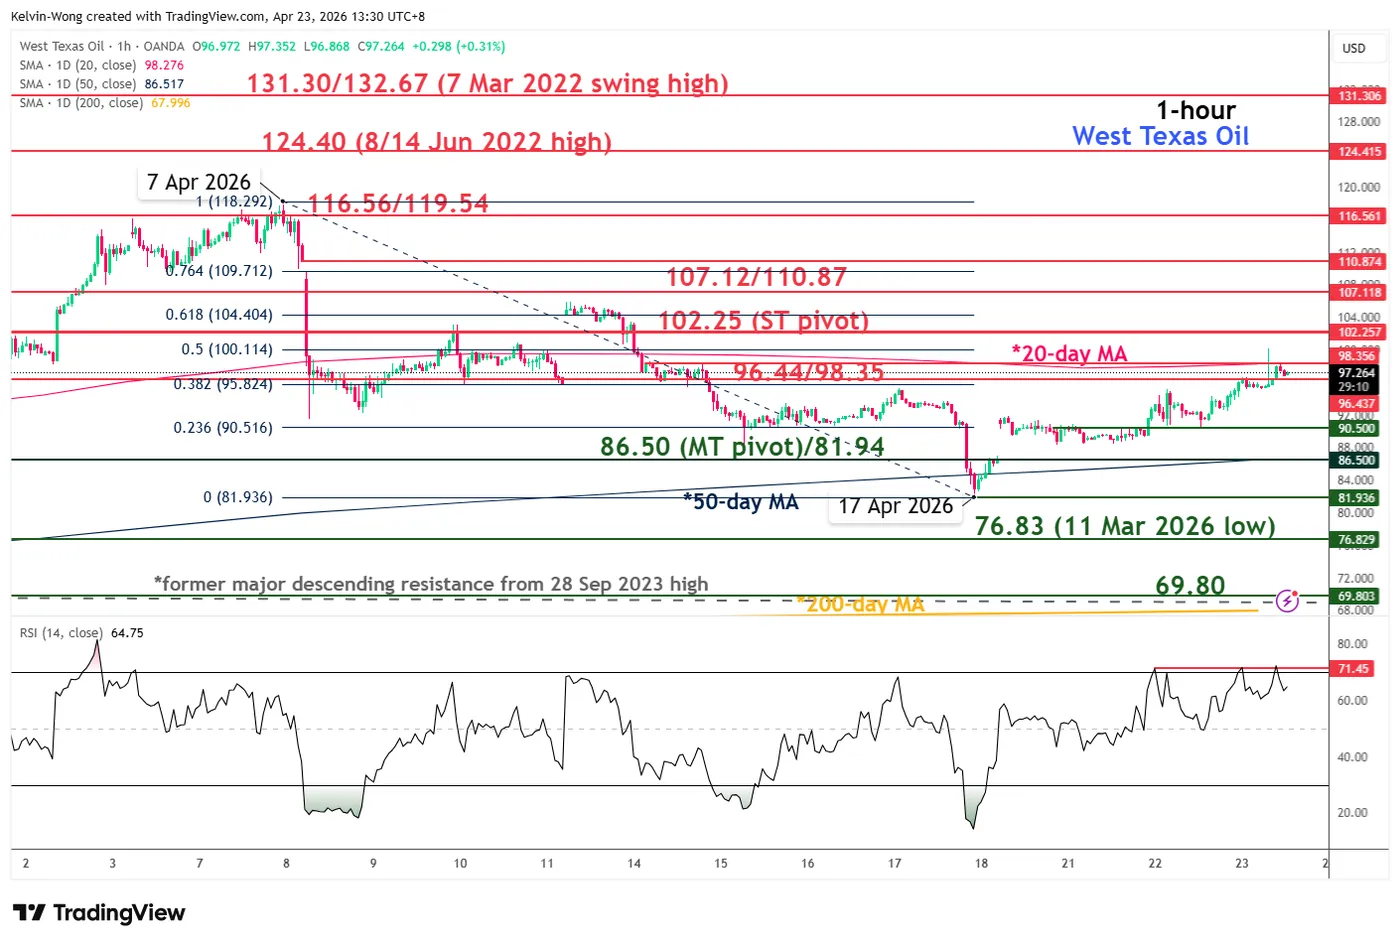
Fig. 4: West Texas oil CFD minor trend as of 23 Apr 2026 (Source: TradingView).
The recent push-up seen on the West Texas oil CFD (a proxy of the WTI crude oil futures) from its range support zone of $86.50/81.94 has reached its range resistance zone of $96.44/98.35 (also the 20-day moving average).
At risk of a mean reversion decline back towards the range bottom, watch the $102.25 short-term pivotal resistance at $102.25, and a break below $90.50 reinforces the minor mean reversion decline scenario to retest the range support zone of $86.50/81.94 (also the 50-day moving average) (see Fig. 4).
However, a clearance with an hourly close above $102.25 invalidates the bullish scenario for a squeeze up towards the next intermediate resistance at $107.12/110.87.
Key elements to support the near-term bearish bias on WTI crude oil
- The hourly RSI momentum indicator has flashed out a prior bearish divergence condition at its overbought zone (above the 70 level) and staged an exit below it.
- The 22% rally from its 17 April 2026 low of $81.94 has reached the 50% Fibonacci retracement of the prior down move from the 7 April 2026 high to 17 April 2026 low that confluences with the 20-day moving average resistance.
Dollar Regains Ground Amid Uncertainty Over US–Iran Talks
The US dollar is recovering after its previous decline, supported by ongoing uncertainty surrounding the geopolitical backdrop. Conflicting signals regarding negotiations between the US and Iran — including reports of a possible ceasefire extension alongside preparations for increased military presence in the region — are creating mixed expectations among market participants and driving flows back into safe-haven assets. This environment is helping to restore demand for the dollar, despite the absence of a clear fundamental catalyst.
Additional support for the currency comes from expectations surrounding upcoming US macroeconomic data, which could influence the outlook for interest rates. However, the primary focus remains on geopolitical developments, while economic data is viewed more as a potential trigger for short-term moves. Markets are also factoring in commodity price dynamics and expectations for global economic activity, shaping the current balance of forces.
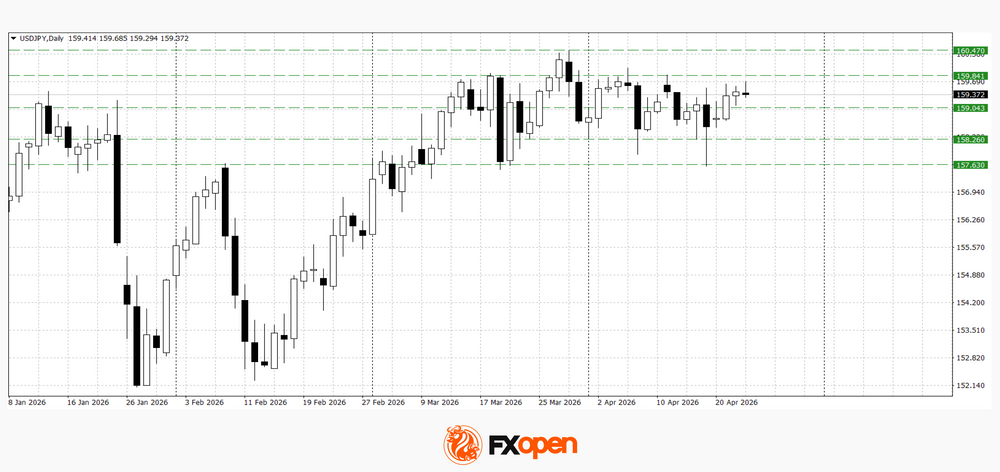
USD/JPY
USD/JPY is moving higher, approaching key weekly resistance levels in the 159.70–160.00 range. The pair’s movement reflects a combination of dollar strength and reduced demand for the yen as a safe-haven asset. If current conditions persist, a further advance and a test of March highs cannot be ruled out. At the same time, rejection from this resistance zone may slow momentum and trigger a short-term pullback.
Key events for USD/JPY:
- today at 15:30 (GMT+3): US initial jobless claims
- today at 16:45 (GMT+3): US Services PMI
- today at 23:30 (GMT+3): Federal Reserve balance sheet
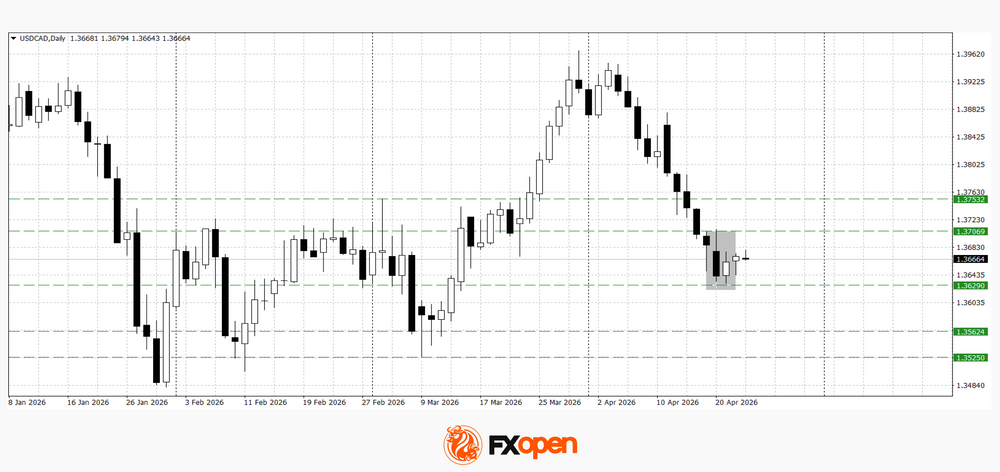
USD/CAD
USD/CAD is forming a potential reversal structure following its recent decline, signalling a possible shift in short-term momentum. Technical analysis suggests scope for a move higher towards 1.3700–1.3750, supported by a bullish “piercing pattern” on the daily chart. A sustained move below 1.3620, however, could revive downside pressure towards 1.3520–1.3560.
Key events for USD/CAD:
- today at 15:30 (GMT+3): Canada RMPI
- today at 15:30 (GMT+3): Canada New Housing Price Index
- tomorrow at 15:30 (GMT+3): Canada Core Retail Sales
The dollar’s current rebound is driven by geopolitical uncertainty and mixed signals surrounding developments in Iran. USD/JPY approaching resistance and emerging reversal signals in USD/CAD highlight the importance of current levels. Further direction will depend on incoming news and macroeconomic data, with the dollar potentially extending gains or resuming its decline if geopolitical tensions ease.
Trade over 50 forex markets 24 hours a day with FXOpen. Take advantage of low commissions, deep liquidity, and spreads from 0.0 pips (additional fees may apply). Open your FXOpen account now or learn more about trading forex with FXOpen.
This article represents the opinion of the Companies operating under the FXOpen brand only. It is not to be construed as an offer, solicitation, or recommendation with respect to products and services provided by the Companies operating under the FXOpen brand, nor is it to be considered financial advice.
Oil Prices Grinded Back Above Triple Digit Numbers
Markets
Oil prices grinded back above triple digit numbers yesterday with so far little progress seen in peace talks and traffic in the Hormuz Strait down to nearly zero as Iran is forcing its blockade through actual vessel seizures. Fox News contradicted the indefinite extension to the ceasefire, citing a White House official that it would only last for an additional three to five days. White House press secretary Leavitt later dismissed the Fox News report though. Meanwhile, Iran has shown little intention of taking part in negotiations short term as long as the US naval blockade and threats persist. The semi-official Tasnim news did cite the country’s envoy to the UN in saying Iran “received some sign” that the US is ready to break the blockade. Either way, markets remain on edge with oil prices this morning suddenly popping to $106 before easing back to $103 currently. European stock markets traded defensively but Wall Street shrugged at the renewed oil price rise with gains varying between 0.7-1.6%. Treasuries and Bunds lost some ground. US yields rose 0.4-2.2 bps. German rates added 3.5 bps at the front. Core bonds by now have mostly undone Friday’s gains. The dollar held the upper hand against most major peers. EUR/USD retreated towards 1.17. DXY has bottomed out around 98 and is now closing in on 99. USD/JPY marches higher for a fourth day straight with the 160 barrier just inches away.
April PMIs today offer a distraction from the day-to-day geopolitical developments. Japan kicked off this morning with a softer and modest increase in private sector output in April. Services reported weaker growth (51.2 from 53.4) but manufacturing signalled the steepest rise in output for over 12 years amid a solid uptick in new work. There were reports of the industry sector ramping up production over fears for further supply chain disruptions (inventory building) linked to the Middle East conflict. The latter also drove input prices rising at the quickest since January 2023, in turn boosting output inflation to its fastest pace since data were first available in 2007. We’ll be looking for similar signals in the UK and European edition later today. The bar for the European manufacturing gauge is at 50.9, easing from April’s 51.6. Services is expected at 49.8 from 50.2. Combined private sector activity would stagnate around 50.1. The key message will come from the price series. The likes of the ECB will monitor the impact of higher oil prices filtering through to the rest of the economy and pushing up general inflation. These subseries could prove more important in determining the market reaction, particularly for bonds. The recent string of ECB speeches (most notably from president Lagarde herself) took April off the table for a first hike, putting the spotlights on June. Overall sentiment obviously remains at the whim of the Iran-headline roulette.
News & Views
New EU car registrations increased by 4% in Q1 2026 vs Q1 2025 thanks to strong performance in the month of March (+12.5% Y/Y). Consumer activity was bolstered by new and revised tax benefits and incentive scheme across major European countries. Hybrid-electric vehicles (HEV) lead as the most popular power type choice among buyers (38.6% in Q1 from 35.6% in Q1 2025), while the battery-electric (BEV) car market share reached 19.4% up from 15.2%. Meanwhile, plug-in hybrids continued to strengthen their position (9.5% from 7.6%), underlining the importance of a technology-neutral pathway to decarbonisation. The combined market share of new registrations for petrol and diesel cars fell from 38.2% to 30.3%. In Belgium, new registrations declined by 5.9% to 113 805 compared with Q1 2025. Especially sales of plug-in hybrids and diesel cars took a hit. Petrol cars (44.4% from 42.1%), BEV’s (34.7% from 33.4%) and HEV’s (12.2% from 12.3%) account for the lion share of new registrations.
South Korean GDP growth reached a consensus-smashing 1.7% Q/Q-pace in Q1 (vs 0.9% estimate). Apart from Q3 2020 (+2.2%), it was the fastest increase in economic activity since 2010. Compared with Q1 of last year, GDP rose by 3.6%. Details showed an AI-fueled export boom being the biggest growth driver. Exports rose by 5.1% Q/Q with net exports adding 1.1 ppt to growth (imports +3% Q/Q). Private consumption increased by 0.5% Q/Q with government spending rising by 0.1%. Investments picked up pace as well (+2.9% Q/Q) driven by funds into construction and facilities. Today’s strong GDP numbers might even underestimate growth momentum as gross domestic income surged by a whopping 7.5% Q/Q.
New Highs
If you handed a market chart to an alien – any of the big ones, including US, European or tech-heavy Asian indices – they would barely guess that the world is being shaken by intense geopolitical tensions that brought transit at one of the planet’s most critical chokepoints to a near-halt, that the situation has been going on for nearly two months, threatening a man-made energy shortage across the planet, and that there is no light at the end of the tunnel.
They wouldn’t guess either that world leaders now prefer tweeting threats on social media as a new form of diplomacy.
Both the S&P 500 and Nasdaq 100 posted fresh new highs yesterday on news that the ceasefire would be extended without a deadline – although it is being extended because the US and Iran are failing to find common ground. And there is probably too much ego and reputational damage for either party to back down.
Alas, tech investors care increasingly less. VanEck’s semiconductor ETF rallied in 13 of the past 14 sessions on renewed AI optimism. Google gained more than 2% after revealing a new TPU chip designed to make AI computing faster and cheaper. Amazon also gained more than 2% after announcing a $5bn investment in AI’s rising star Anthropic, on top of the $8bn already committed, and said there could be $20bn more – a deal that includes Anthropic spending over $100bn on Amazon Web Services (AWS) over ~10 years. Circular, yes? But investors have now digested the circular nature of these deals, or they simply view them as preferable to war-exposed assets.
A shadow on optimism this morning, TSMC says that ASML’s new machines are too pricey. Alas, that’s the only one to produce these machines.
What is also interesting is that we are seeing pretty much the same sell-off-and-recovery pattern we saw last April – after the so-called Liberation Day. The choice of words still makes me smile a year or so later, especially given the US has just released a web platform to refund taxes that were allegedly collected over months. And while trade uncertainties persisted, major US – and other global – indices kept rallying.
This is what we see today: a dip on initial shock, followed by a rebound to all-time highs. It is almost safe to say that, no matter the news, markets rally. But of course, gains come with the risk of sharp reversals, as an energy crisis is still looming. But that’s just a blip.
Still, US crude was trading above the $100pb psychological mark this morning on extended uncertainties in the Middle East, while Brent crude traded past $106pb – the highest level in more than two weeks. The latter is weighing on appetite for equities as well. US and European futures point to a lower open, while the Japanese Nikkei and Kospi retreat from all-time highs.
One pattern is clear today: tech-heavy indices and energy are outperforming other sectors, as the global economic outlook deteriorates due to higher energy prices. Further upside is possible for crude oil, but gains will likely remain short-lived, as at these levels demand typically slows enough to cap further upside. So far, $120pb has acted as a strong resistance to bullish moves.
Speaking of underlying economies… PMI data today will give an idea of the impact of higher energy prices on global activity. While figures will likely point to slowing growth, rising price pressures will likely keep central bank doves constrained.
Yesterday, the UK announced its latest CPI figures, confirming rising price pressures driven by higher energy costs. Core CPI was slightly lower than expected, but this did not change expectations that inflation in the UK is turning higher again due to this shock, and will not only prevent the Bank of England (BoE) from cutting rates, but may also force it to tighten monetary policy. Alas, this did not help Cable gain ground yesterday, as higher rates into a slowing economic outlook are not necessarily attractive for FX traders.
Globally, the US dollar is gaining ground – but more slowly compared to the first days of the conflict – as some investors hedge higher energy risks via USD exposure. Another wave of upward pressure on oil prices could give the US dollar a short-term boost. But in the longer run, the US economic outlook is also weakening. Happily for investors, the tech story is masking deteriorating fundamentals.
Inside tech, Tesla announced its first-quarter earnings after the bell, and results came in line with expectations. Revenue grew 16% from a year earlier (helped by an easy comparison, as sales were tumbling this time last year), but operating expenses ballooned 37% to nearly $3.8bn. In addition, the company ramped up capex to $25bn this year – to keep up with the AI race – basically three years of combined spending.
The shares first popped in after-hours trading, but then reversed gains. Elon Musk has been incredibly successful in selling his tech dreams to the world, helped by a cash-generating machine that kept investors on board. Today, that cash machine is sputtering. Unless Elon Musk’s new projects start generating meaningful cash flow, investors may start pulling back.
It is very difficult to put a price tag on Tesla. The company currently trades at a P/E ratio of nearly 320. If it traded near a P/E ratio of 30, its share price would be around $36. Of course, this is a very linear calculation and does not take into account growth potential from new technologies.
But when you trade a company like Tesla, it’s critical to understand that one is funding the dream of Elon Musk – one that could change the world, but also carries significant risk.
A Big Batch of PMIs
In focus today
In the euro area, the April flash PMI report is released, a key input ahead of the ECB meeting. We expect the manufacturing PMI to show a steep decline from 51.6 to 49.6, driven by higher energy prices. The surprise increase in the headline index in March was largely due to longer delivery times, which pose an upward risk to the headline number again. As such, monitoring the output sub-component will be crucial. The services PMI fell more than expected in March to 50.2 and we expect it to remain at same level in April, as services are less directly hit than manufacturing. However, the uncertainty of the index is unusually high, so interpretation should be more cautious than usual. The price components will be more important than usual.
From the US and UK, the flash April PMIs will also provide key insights ahead of next week's central bank meetings. In the US, attention will centre on whether manufacturing PMI is sustained around March's strong print at 52.4. In the UK, March's composite PMI fell sharply to 51.0, reflecting challenges from surging energy prices and supply chain disruptions. These reports will offer a timely view of the Middle East conflict's impact on economic activity.
In Sweden, we have our eyes on Anna Seim, a relative hawk, giving a speech at 08:00 CET - a summary of the speech will be published on the website.
Overnight in Japan, the national March CPI is released. We are not likely to see a Japanese inflation surge, as opposed to the global trend. Tokyo headline inflation even suggests a modest decline, as government subsidies are keeping gasoline prices close to a price of USD1/litre. Consensus is pointing to a modest increase, though, to 1.8% for CPI inflation excluding fresh food.
Economic and market news
What happened overnight
In Japan, the April Composite PMI declined slightly to 52.4 from 53.0, as a strong rise in Manufacturing PMI to 54.9 (prior: 51.6) was offset by a slowdown in Services PMI to 51.2 (prior: 53.4). Notably, factory output recorded its strongest increase since February 2014, driven by manufacturers ramping up production amid concerns over potential future supply shortages linked to the war in the Middle East.
What happened yesterday
In the oil space, Brent crude rose above USD100/bbl as talks between the US and Iran to reopen the Strait of Hormuz seem to have yet to start, with the two sides remaining far apart. Polymarket investors now see a 40% chance of traffic normalising before the end of May, down from 60% earlier in the day. The US kept the pace of selling of strategic reserves at 600kb/d last week, which is still well below peak selling levels in 2022. Hence, more support to global oil supply could still come from this side over the coming weeks.
In Sweden, unemployment rose to 9.2% in March, but should be interpreted with caution, as Statistics Sweden noted the rate was likely overestimated. Monthly numbers are very volatile, and the volatility has increased in recent years. Looking at the full quarter, outcomes were fairly well in line with our forecast. Employment rose by 0.3% q/q (forecast 0.4%) and the unemployment rate held steady at 8.6%. The overall picture on the Swedish labour market is that it has improved, but the rate of improvement has declined. Indicators have worsened recently, pointing to unchanged employment in the near term. For the Riksbank, inflation risks are the focal point, but on the margin, the labour market data favours a cautious approach.
In the UK, CPI inflation for March came in as a mixed bag with services a touch higher than expected at 4.5% y/y (cons: 4.3%, prior: 4.3%), while core was lower than expected at 3.1% y/y (cons: 3.2%, prior: 3.2%). It remains too early to assess whether this will lead to broader second-round effects, which the Bank of England has identified as a key concern. During its March meeting, the Bank highlighted the increased risk of domestic inflationary pressures driven by second-round effects in wage and price-setting.
The European Commission revealed its energy bill "AccelerateEU" aimed at tackling higher energy costs from the war in Iran. The package does not contain new funding, limiting its near-term impact. It promotes tax cuts and levies for low-income households and allows member states to implement temporary emergency measures to support the most exposed sectors. This raises the likelihood of more fiscal support from individual governments, larger public deficits, and possibly untargeted fiscal easing measures, which could lead to further ECB hikes.
In Denmark, April consumer confidence dropped from -13.8 in March to -18.6, reflecting rising energy prices and concerns over the ongoing conflict in Iran. Inflation expectations surged to their highest since early 2022, driven by fears of prolonged energy price increases. Despite solid wage growth and improved disposable incomes from tax cuts and higher benefits, uncertainty surrounding inflation and energy prices continues to weigh on consumer spending, posing challenges for domestic growth.
Equities: Equity markets in the US performed strongly on the open yesterday, without Europe following suit. While tech and banks were in either side of the league table, that alone does not provide a fully satisfactory explanation for the divergence. Global equities were up 0.6%, with S&P500 rising 1.1%, Nasdaq 1.6%, Russell2000 0.7% higher and Stoxx600 down 0.4%. Overnight, futures are lower, as well as Asian markets.
FI and FX: Markets open on a weak foot with headlines from a locked-in stand-off over the SOH dominating the news. Asian equities are down while US treasuries rise a couple of basis points this morning and EUR/USD falls back below 1.1700. Oil prices climb further with a barrel of brent trading close to USD 104. News from the Middle East will continuously dominate market movements, but PMI releases, and their price components in particular, might attract some attention. I Norway the SBB releases figures for wage growth and industrial confidence and the Swedish Riksbank's Anna Seim gives a speech at CET 08:00.
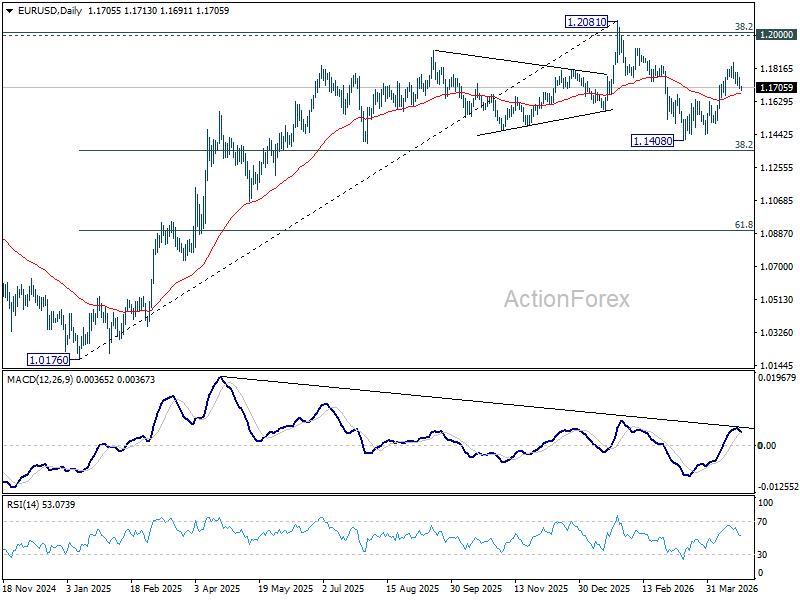
EUR/USD Daily Outlook
Daily Pivots: (S1) 1.1684; (P) 1.1724; (R1) 1.1745; More….
EUR/USD's pullback from 1.1848 extends lower today but stays above 1.1662 support. Intraday bias remains on the upside and further rise is still in favor. On the upside, sustained trading above 61.8% retracement of 1.2081 to 1.1408 at 1.1824 will pave the way to retest 1.2081 high. However, firm break of 1.1662 support will bring deeper decline back towards 1.1408 low instead.
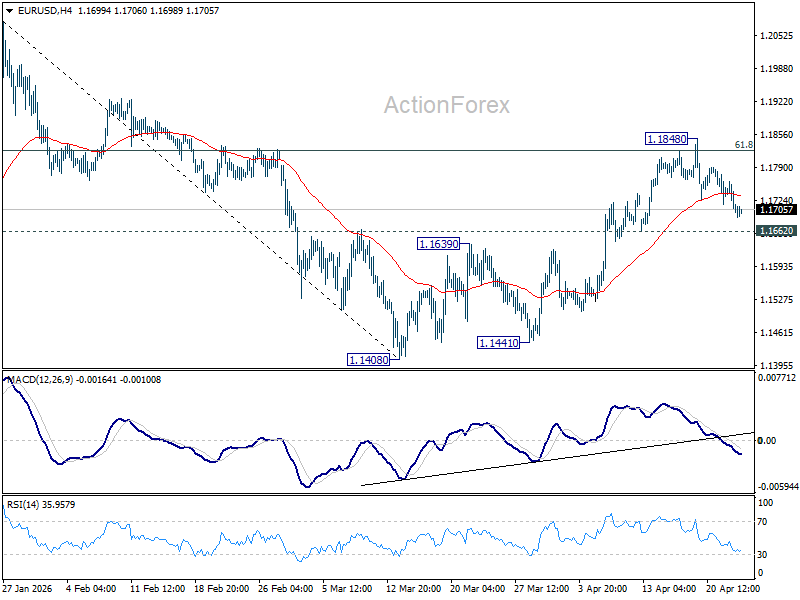
In the bigger picture, the strong support from 38.2% retracement of 1.0176 to 1.2081 at 1.1353 suggests that the pullback from 1.2081 is more likely a corrective move. Strong support was also found in 55 W EMA (now at 1.1507). Focus is back on 1.2 key cluster resistance level. Decisive break there will carry long term bullish implications. Nevertheless, break of 1.1408 support will revive the case of medium term bearish trend reversal.
Stocks Stall as US–Iran Maritime Conflict Broadens, Oil Tests Limits of Rally
The record equity rally is probably starting to lose momentum as oil prices push higher again and the US–Iran conflict expands beyond the Strait of Hormuz. Caution is already evident in Asia. After record closes in the S&P 500 and NASDAQ overnight, both Nikkei and KOSPI briefly hit new highs before reversing into negative territory. At the same time, currency markets are showing early signs of repositioning. Flows into US Dollar and Canadian Dollar suggest a mix of safe-haven demand and oil-linked support.
While markets initially welcomed the extension of the ceasefire, ongoing tanker seizures and naval interdictions suggest disruption is intensifying rather than easing. With Brent crude holding above $100 and targeting $110, oil is once again emerging as a key constraint on risk sentiment.
The core issue is that the ceasefire has not translated into de-escalation on the ground—or at sea. The U.S. has moved beyond guarding the Strait of Hormuz and is now enforcing a global maritime interdiction of Iranian crude. U.S. forces have intercepted and redirected multiple Iranian-linked vessels not just near Hormuz, but across wider Asian waters, including near India and Southeast Asia.
From Washington’s perspective, this is framed as sanctions enforcement—an extension of economic pressure designed to choke off Iranian oil revenue. The blockade applies to ships entering or leaving Iranian ports and has already seen vessels seized or disabled when attempting to bypass restrictions.
This followed Iran’s navy saying it had seized two container ships in the Strait of Hormuz. The seizure of the MSC Francesca and Epaminondas in the Strait is Tehran's way of showing that while they can't stop the U.S. globally, they can "blind" the world’s most vital waterway by targeting ships that tamper with navigation systems.
This creates a two-layer conflict. The US is attempting to restrict Iranian exports globally, while Iran is attempting to destabilize the chokepoint locally. The result is persistent uncertainty over both supply and transit—two critical components of the global oil market.
With no clarity on the US–Iran situation, focus is shifting back to economic data, particularly April PMI releases. These will be critical in assessing how the energy shock is feeding into real economic activity across regions.
Australia’s PMI showed overall activity returning to modest expansion, but the contraction in manufacturing output is a warning sign. At the same time, price pressures have surged to the highest level in nearly four years. Japan’s PMI data points to continued expansion, with surprising strength in manufacturing. However, input cost pressures are rising rapidly. The weak Yen is a double-edged sword—supporting exports while sharply increasing the cost of imported raw materials, squeezing profit margins.
PMIs from the Eurozone, the UK, and the US later today will provide a clearer picture of how these economies are absorbing the shock. A combination of contraction readings (below 50) and rising prices would reinforce stagflation concerns and could weigh further on Euro and Sterling. Europe remains particularly vulnerable to disruptions in the Strait of Hormuz.
In FX markets, Canadian Dollar now leads the week on oil strength, followed by Kiwi and Dollar. Yen is the weakest, with Euro and Swiss Franc also underperforming. Sterling and Aussie sit in the middle.
Fake Trigger, Real Rally: Brent Oil Breaks $106, $110 Now Key
Oil didn’t retrace after the spike on fake news—and that’s the signal. With Brent breaking $106, attention turns to whether $110 can be cleared next. Read More.
Japan PMI Composite Falls to Four-Month Low, Out Prices Hit Record
Manufacturing is driving Japan’s growth, but services are losing momentum and costs are rising fast. The divergence is becoming harder to ignore. Read More.
Australia Composite PMI Back in Expansion, Price Pressures Highest in Nearly Four Years
Australia PMI Composite returned to growth at 50.1 in April, led by services rebound. Manufacturing output weakened while rising fuel and shipping costs lifted inflation pressures to highest in nearly four years. Read More.
EUR/USD Daily Outlook
Daily Pivots: (S1) 1.1684; (P) 1.1724; (R1) 1.1745; More….
EUR/USD's pullback from 1.1848 extends lower today but stays above 1.1662 support. Intraday bias remains on the upside and further rise is still in favor. On the upside, sustained trading above 61.8% retracement of 1.2081 to 1.1408 at 1.1824 will pave the way to retest 1.2081 high. However, firm break of 1.1662 support will bring deeper decline back towards 1.1408 low instead.
In the bigger picture, the strong support from 38.2% retracement of 1.0176 to 1.2081 at 1.1353 suggests that the pullback from 1.2081 is more likely a corrective move. Strong support was also found in 55 W EMA (now at 1.1507). Focus is back on 1.2 key cluster resistance level. Decisive break there will carry long term bullish implications. Nevertheless, break of 1.1408 support will revive the case of medium term bearish trend reversal.