
Sample Category Title
EUR/AUD Daily Outlook
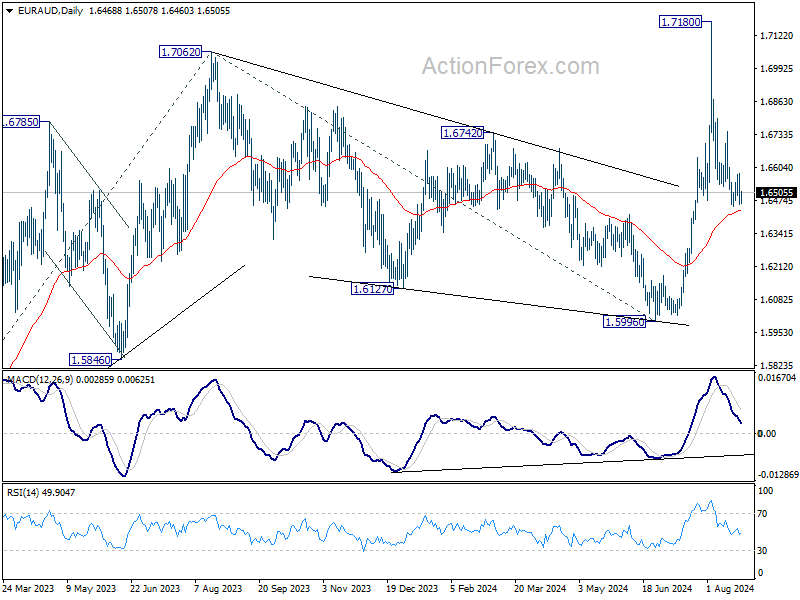
Daily Pivots: (S1) 1.6424; (P) 1.6503; (R1) 1.6549; More...
Intraday bias in EUR/AUD stays neutral first. On the downside, sustained trading below 55 D EMA (now at 1.6432) will argue that rise from 1.5996 has completed at 1.7180 Deeper fall would then be seen back to this support. Nevertheless, strong rebound from current levels, followed by break of 1.6580 resistance, will argue that pullback from 1.7180 has completed already. Intraday bias will then be back on the upside for stronger rebound.
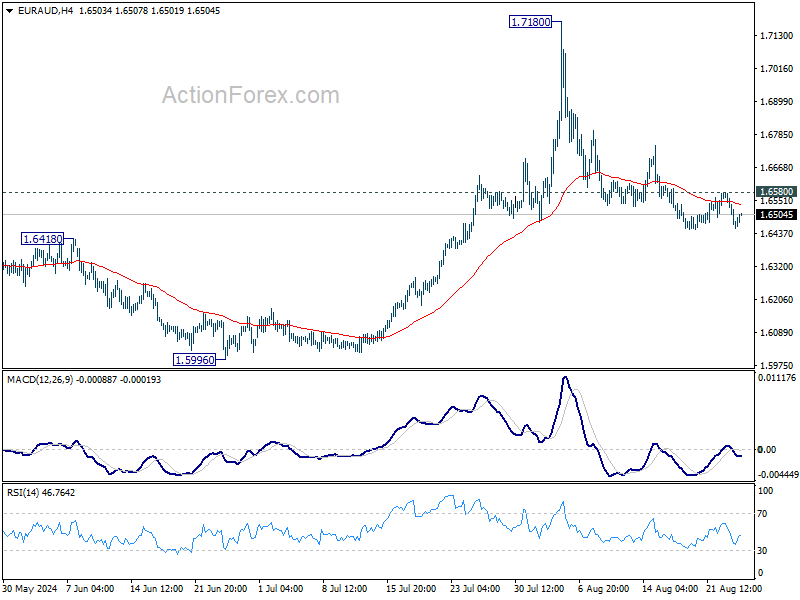
In the bigger picture, corrective fall from 1.7062 medium term top should have completed at 1.5996. Larger up trend from 1.4281 (2022 low) is resuming. Next target is 61.8% projection of 1.4281 to 1.7062 from 1.5996 at 1.7715. However, sustained break of 55 D EMA will dampen this bullish view and extend medium term range trading.
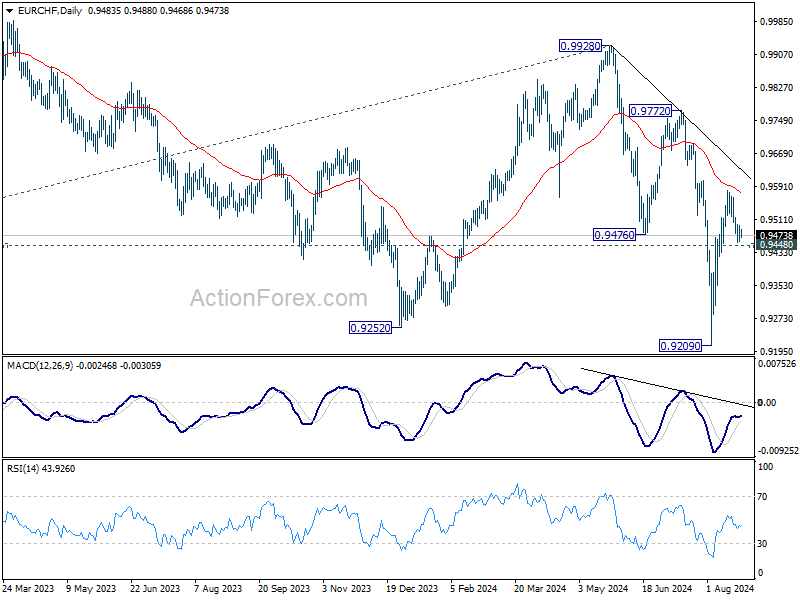
EUR/CHF Daily Outlook
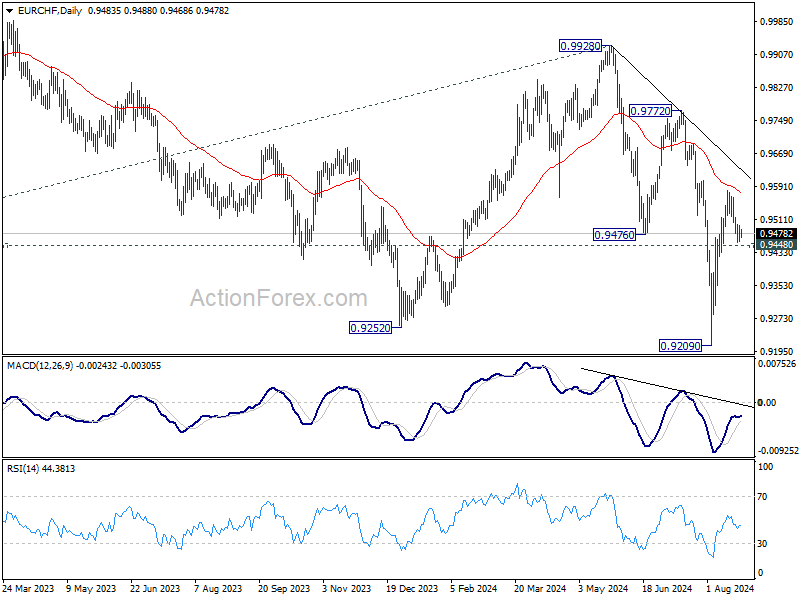
Daily Pivots: (S1) 0.9466; (P) 0.9482; (R1) 0.9505; More....
Intraday bias in EUR/CHF Remains neutral for the moment. On the upside, sustained break of 55 D EMA (now at 0.9573) will pave the way back to 0.9972/0.9928 resistance zone. However, decisive break of 0.9448 will suggest rejection by 55 D EMA, and turn bias back to the downside for 0.9209 low.
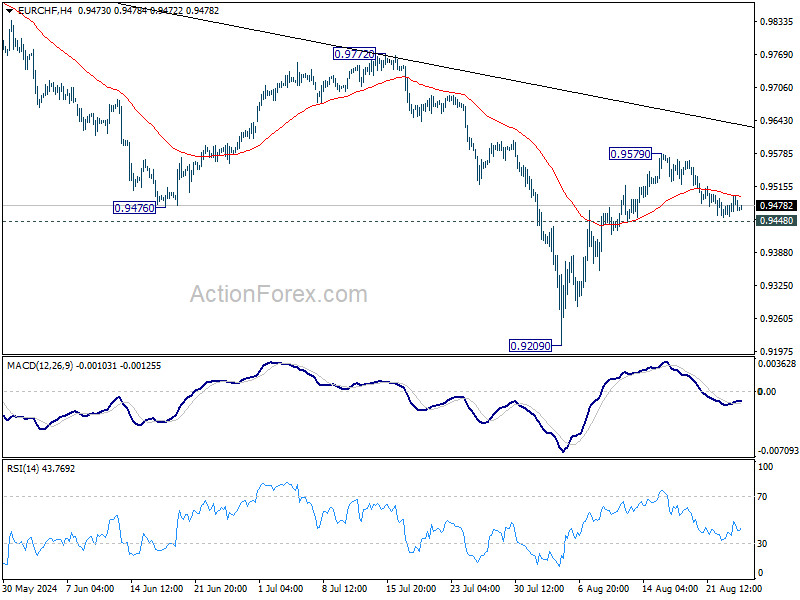
In the bigger picture, medium term corrective pattern from 0.9407 (2022 low) might have completed with three waves to 0.9928. Decisive break of 0.9252 (2023 low) will confirm long term down trend resumption. Next target will be 61.8% projection of 1.1149 to 0.9407 from 0.9928 at 0.8851. For now, outlook will stay bearish as long as 0.9928 resistance holds, even in case of strong rebound.
EUR/USD Daily Outlook
Daily Pivots: (S1) 1.1130; (P) 1.1165; (R1) 1.1229; More....
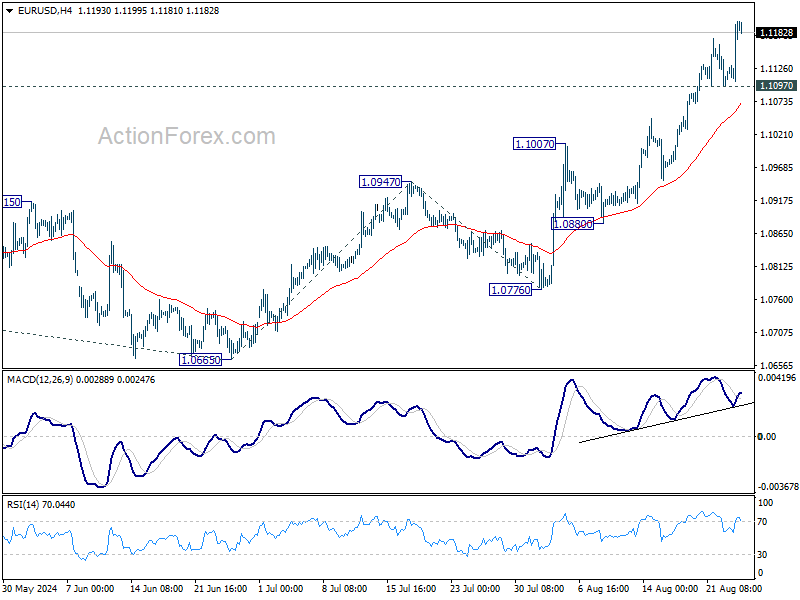
Intraday bias sin EUR/USD remains on the upside at this point. Current rally should target 161.8% projection of 1.0665 to 1.0947 from 1.0776 at 1.1232, and then 1.1274 high. On the downside, below 1.1097 minor support will turn intraday bias neutral and bring consolidations first.
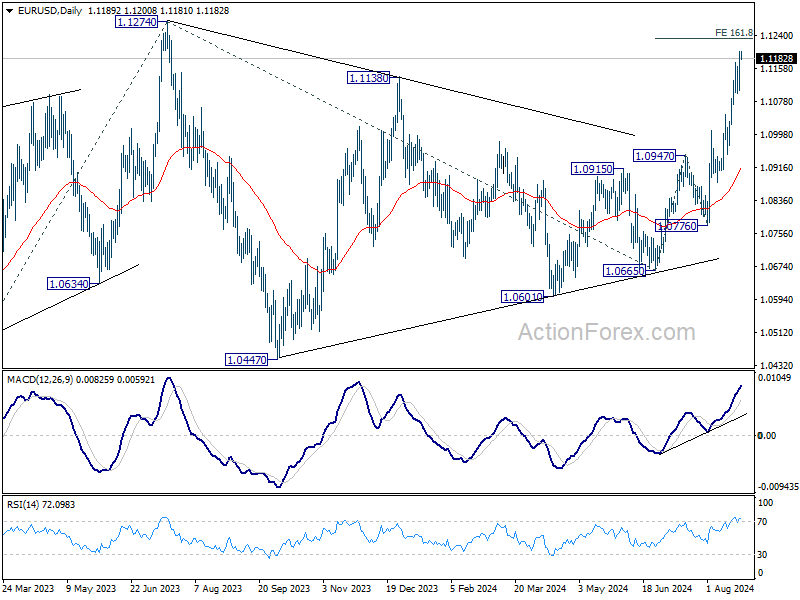
In the bigger picture, break of 1.1138 resistance indicates that corrective pattern from 1.1274 has completed at 1.0665 already. Decisive break of 1.1274 (2023 high) will confirm whole up trend from 0.9534 (2022 low). Next target will be 61.8% projection of 0.9534 to 1.1274 from 1.0665 at 1.1740. This will now be the favored case as long as 1.0947 resistance turned support holds.
GBP/USD Daily Outlook
Daily Pivots: (S1) 1.3116; (P) 1.3174; (R1) 1.3276; More...
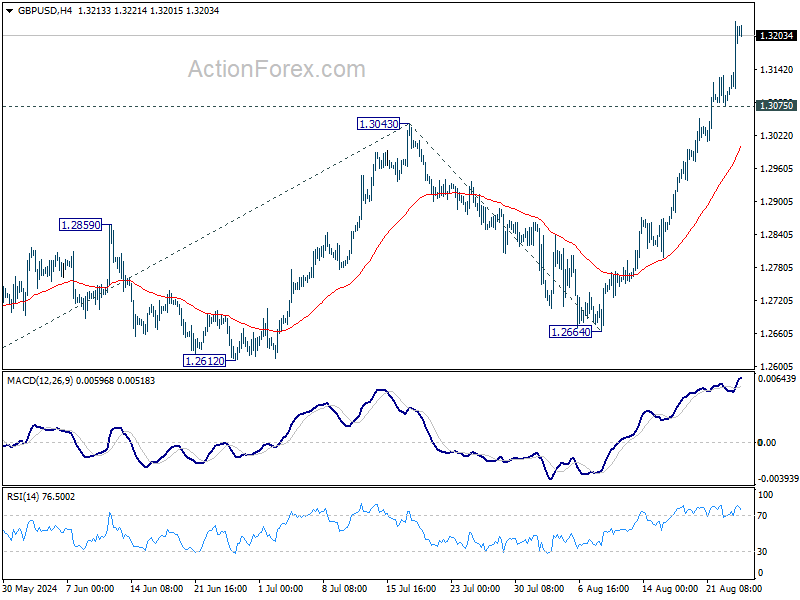
Intraday bias in GBP/USD remains on the upside for the moment. Current up trend is in progress for 100% projection of 1.2298 to 1.3043 from 1.2664 at 1.3409. On the downside, below 1.3075 minor support will turn intraday bias neutral and bring consolidations, before staging another rally.
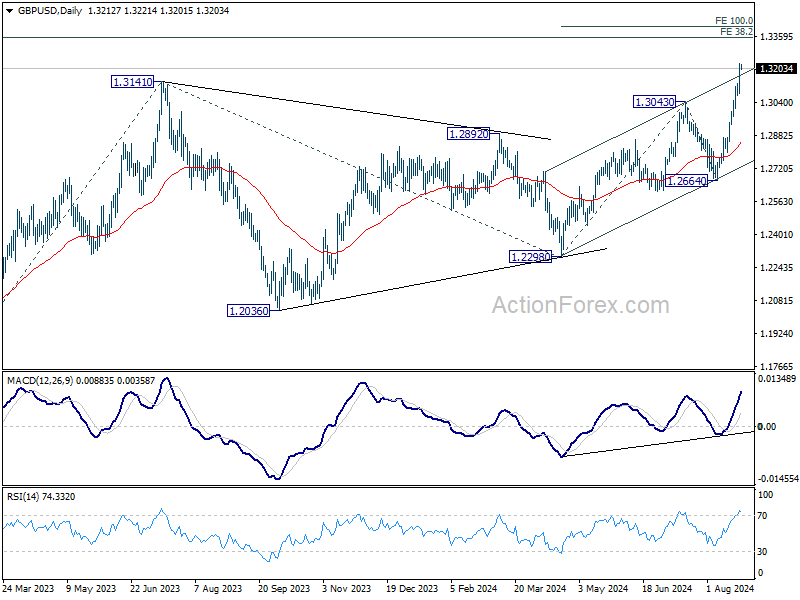
In the bigger picture, up trend from 1.0351 (2022 low) is resuming. Next target is 38.2% projection of 1.0351 to 1.3141 from 1.2298 at 1.3364. For now, outlook will stay bullish as long as 1.2664 support holds, even in case of deep pullback.
USD/CHF Daily Outlook
Daily Pivots: (S1) 0.8451; (P) 0.8497; (R1) 0.8522; More…..
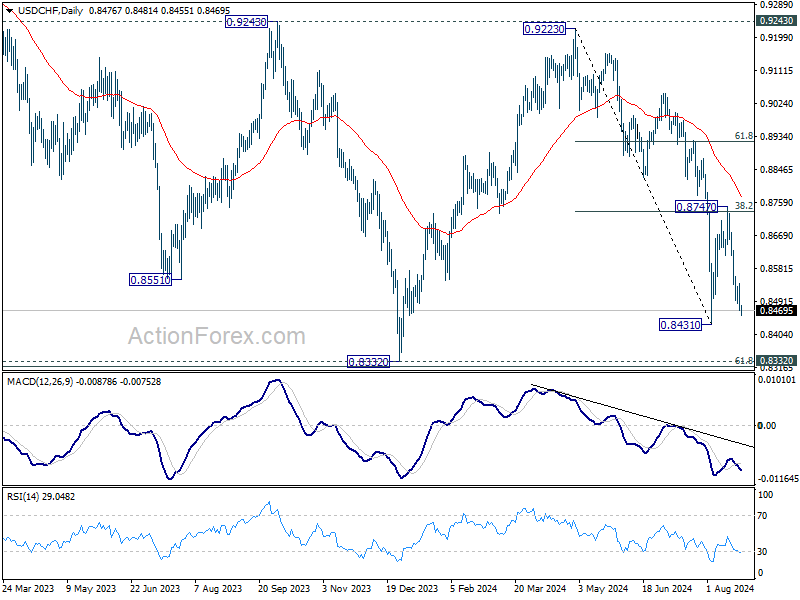
Intraday bias in USD/CHF remains on the downside for retesting 0.8431 support. Firm break there will resume whole decline from 0.9223 towards 0.8332 low. On the upside, above 0.8540 minor resistance will turn intraday bias neutral. But risk will stay on the downside as long as 0.8747 resistance holds, in case of recovery.
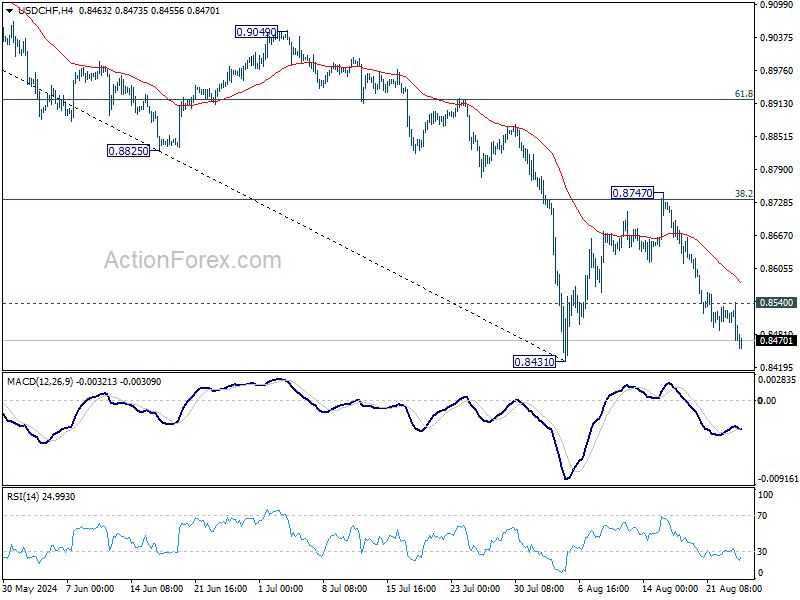
In the bigger picture, price actions from 0.8332 (2023 low) are currently seen as a medium term corrective pattern, with fall from 0.9223 as the second leg. Strong support could be seen from 0.8332 to bring rebound. Yet, overall outlook will continue to stay bearish as long as 0.9243 resistance holds. Firm break of 0.8332, however, will resume larger down trend from 1.0146 (2022 high).
USD/JPY Daily Outlook
Daily Pivots: (S1) 143.37; (P) 144.93; (R1) 145.81; More...
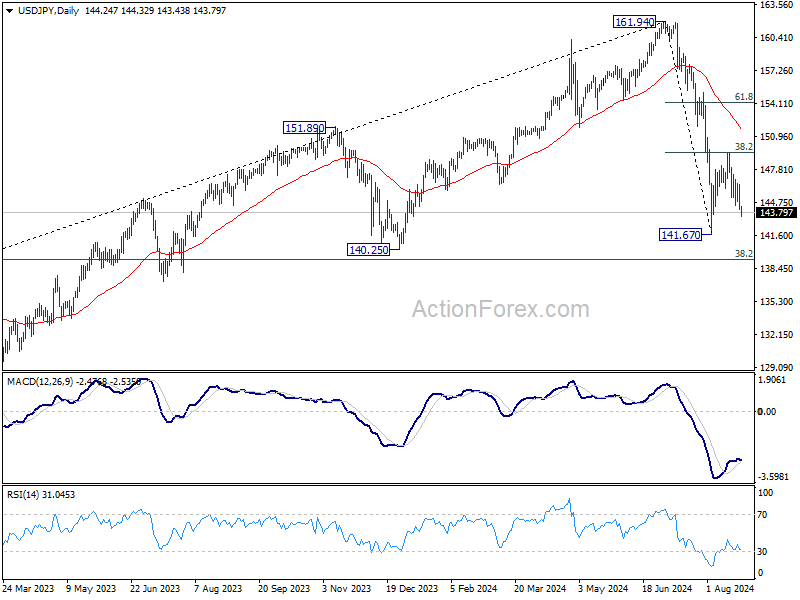
Intraday bias in USD/JPY remains on the downside for retesting 141.67 low. Firm break there will resume the whole fall from 161.94 to 140.25 support next. For now, risk will stay on the downside as long as 149.35 resistance holds, in case of recovery.
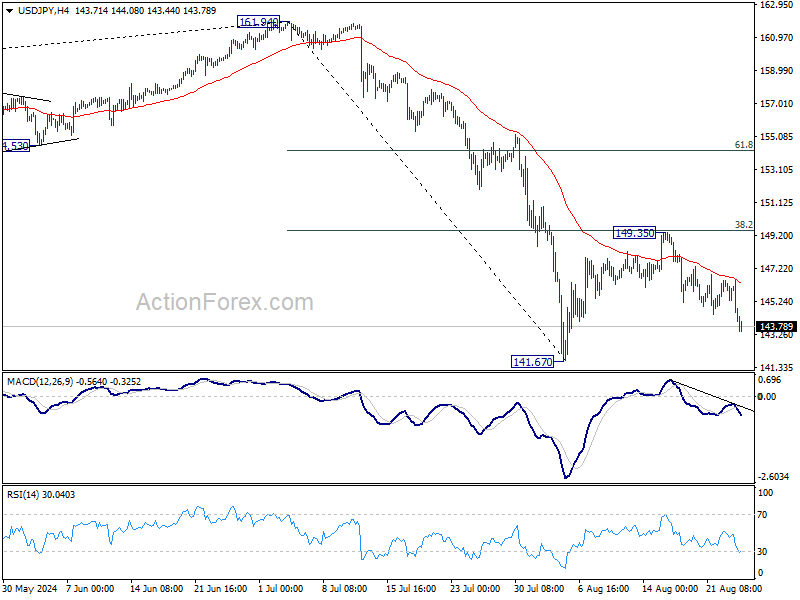
In the bigger picture, fall from 161.94 medium term top is seen as correcting whole up trend from 102.58 (2021 low). Deeper decline could be seen to 38.2% retracement of 102.58 to 161.94 at 139.26, which is close to 140.25 support. In any case, risk will stay on the downside as long as 55 W EMA (now at 149.38) holds. Nevertheless, firm break of 55 W EMA will suggest that the range for medium term corrective pattern is already set.
USD/CAD Daily Outlook
Daily Pivots: (S1) 1.3465; (P) 1.3542; (R1) 1.3586; More...
Intraday bias in USD/CAD remains on the downside for the moment. Fall from 1.3946 is in progress for 1.3477 support. Firm break there will target 1.3091/3176 support zone. On the upside, above 1.3617 resistance will turn intraday bias neutral first.

In the bigger picture, current development suggests that corrective pattern from 1.3976 (2022 high) is extending with another falling leg. While deeper decline could be seen, strong support should emerge above 1.2947 resistance turned support to bring rebound. Rise from 1.2005 (2021 low) is still in favor to resume at a later stage.

AUD/USD Daily Report
Daily Pivots: (S1) 0.6731; (P) 0.6765; (R1) 0.6830; More...
Intraday bias in AUD/USD stays on the upside for the moment, with focus on focus on 0.6798 resistance. Firm break there will extend the rally from 0.6348 to 0.6870 resistance next, with prospecting of resuming whole rise from 0.6269. On the downside, below 0.6696 support turn bias to the downside for deeper pull back instead.
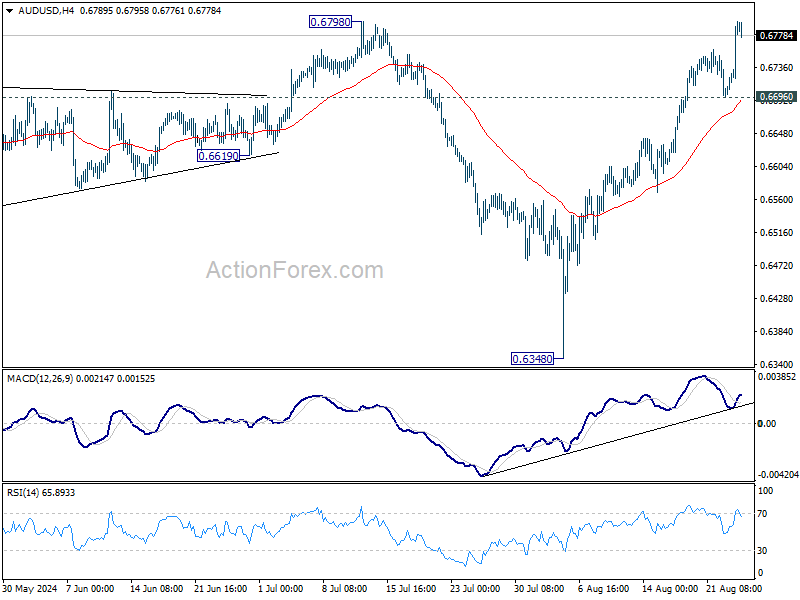
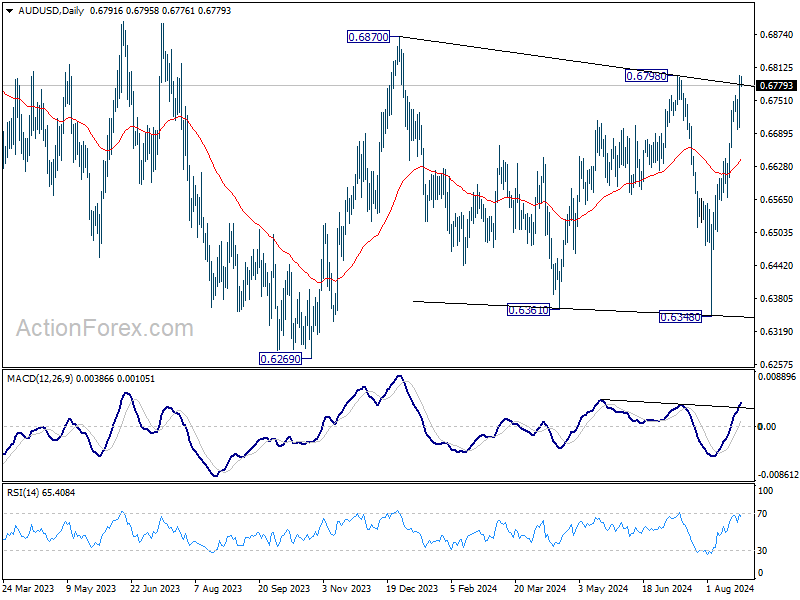
In the bigger picture, overall, price actions from 0.6169 (2022 low) are seen as a medium term corrective pattern, with rise from 0.6269 as the third leg. Firm break of 0.6798/6870 resistance zone will target 0.7156 resistance. In case of another fall, strong support should be seen from 0.6169/6361 to bring rebound.
Caution Creeps Back as Markets Eye Crucial Inflation Data in the Week
Traders appear to be stepping back from last Friday's risk-on rally, showing more caution in the Asian session today. The mood in major indices is mixed; with Nikkei trading down by more than -1%, while HSI is showing gain of about 1%. This cautious sentiment is mirrored in the currency markets, where safe-haven currencies like Yen and Swiss Franc have gained slightly alongside Dollar. Risk-sensitive currencies like Aussie and Kiwi are losing some ground.
However, the movements are relatively muted, with no major technical levels being breached. This suggests that markets are merely in a phase of consolidation, indicating that markets are in a holding pattern, digesting recent moves and waiting for the next catalyst.
Today's economic calendar is relatively light, with Germany's Ifo Business Climate Index and US Durable Goods Orders being the primary data points to watch. With the UK on a bank holiday, trading might remain subdued for now. But things are expected to pick up as the week progresses, especially with upcoming inflation data from the US, Eurozone, Japan, and Australia.
Technically, EUR/CHF would be a focus today. While the rebound from 0.9209 was strong, it struggled to break through 55 D EMA (now at 0.9577). Decisive break of 0.9448 minor support will argue that this rebound has completed after reject by the 55 D EMA. That would keep the down trend from 0.9928 intact too, and could set the stage for retesting 0.9209 low next.
In Asia, at the time of writing, Nikkei is down -1.09%. Hong Kong HSI is up 1.00%. China Shanghai SSE is down -0.07%. Singapore Strait Times is up 0.01%. Japan 10-year JGB yield is down -0.0162 at 0.879.
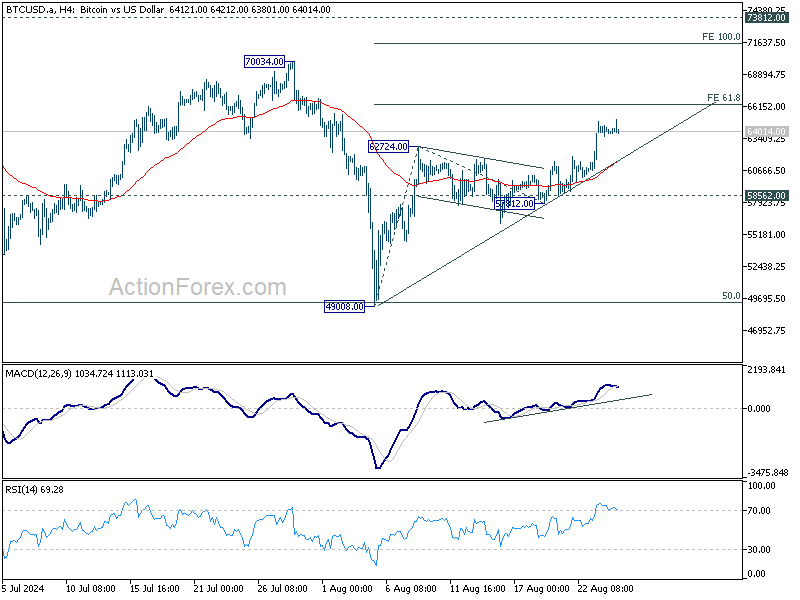
Bitcoin to face 66k hurdle as risk-on rally gains traction
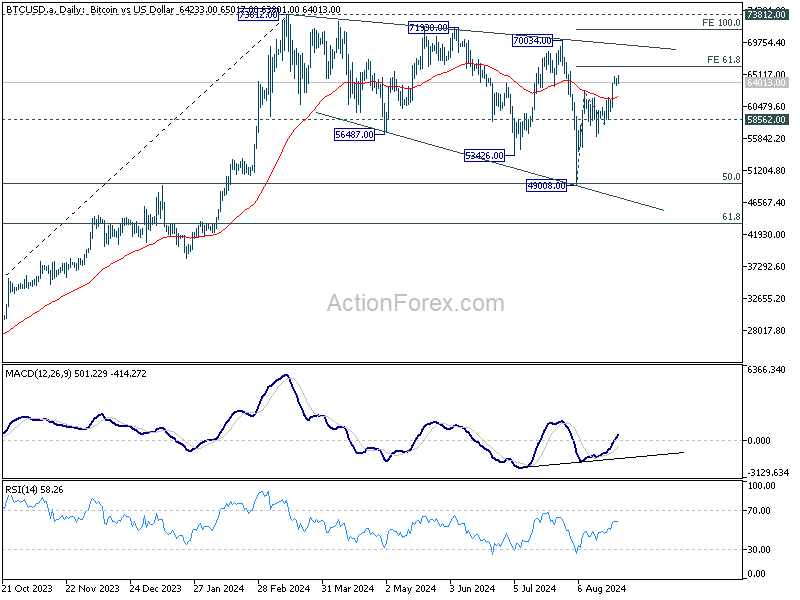
Bitcoin surged last Friday and stayed firm throughout the weekend. The cryptocurrency broke through an important near-term resistance level, fueled by broad risk-on sentiment following Fed Chair Jerome Powell's indication of upcoming monetary easing. It now stands at a critical juncture, where the next move will determine whether it has completed the medium-term consolidation that began in March.
Technically, the break of 62724 confirmed resumption of the rebound from 49008. The strong break of 55 D EMA is also a near term bullish sign. It's possible that the corrective pattern from 73812 has completed 49008, after hitting 50% retracement of 24896 to 73812 at 49354.
However, to solidify the bullish case, Bitcoin will have to overcome the first hurdle at 61.8% projection of 49008 to 62724 from 57812 at 66288. Rejection by this level will keep the rebound from 49008 as just another leg in the corrective pattern from 73812. On the other hand, firm break of 66288 could prompt upside acceleration to 100% projection at 71528, and build up momentum for eventual breakout from the five-month range.
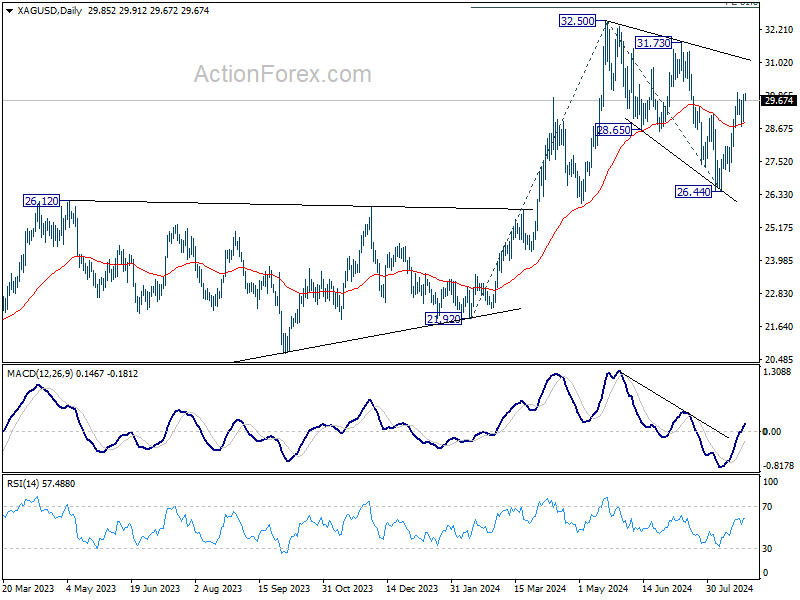
Gold and Silver bounded in range, awaiting Dollar-driven breakout
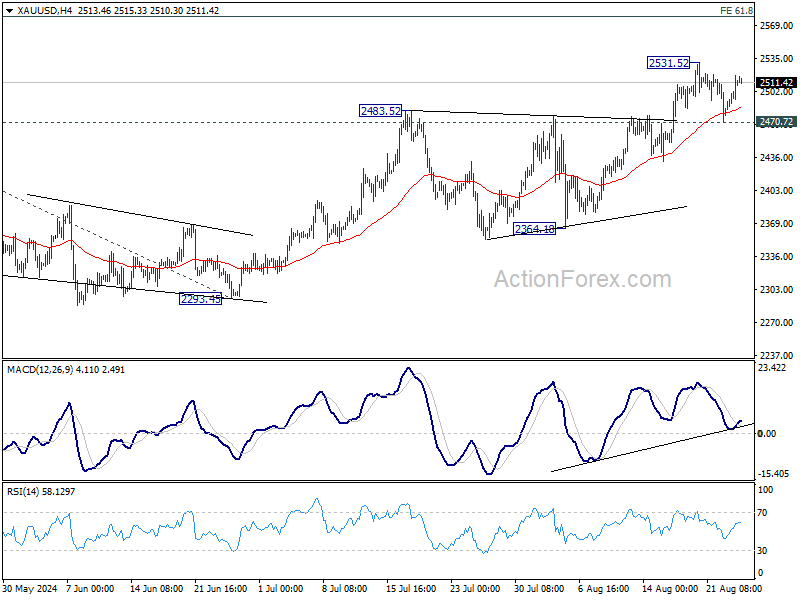
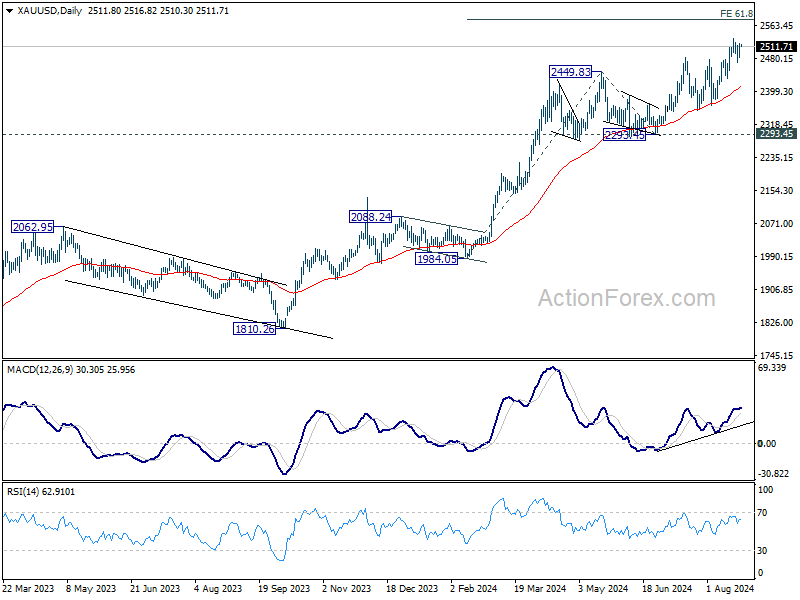
Both Gold and Silver are currently still caught in near-term consolidations despite the rally late last week. Both metals have the potential to extend their recent gains, but a more pronounced decline in Dollar may be necessary to provide the needed momentum.
As for Gold, further rally is expected as long as 2470.72 support holds. Firm break of 2531.57 will resume the long term up trend and extend the record run. Next target is 61.8% projection of 1984.05 to 2449.83 from 2293.45 at 2581.30. However, break of 2470.72 will risk deeper pull back to 55 D EMA (now at 2412.87) first.
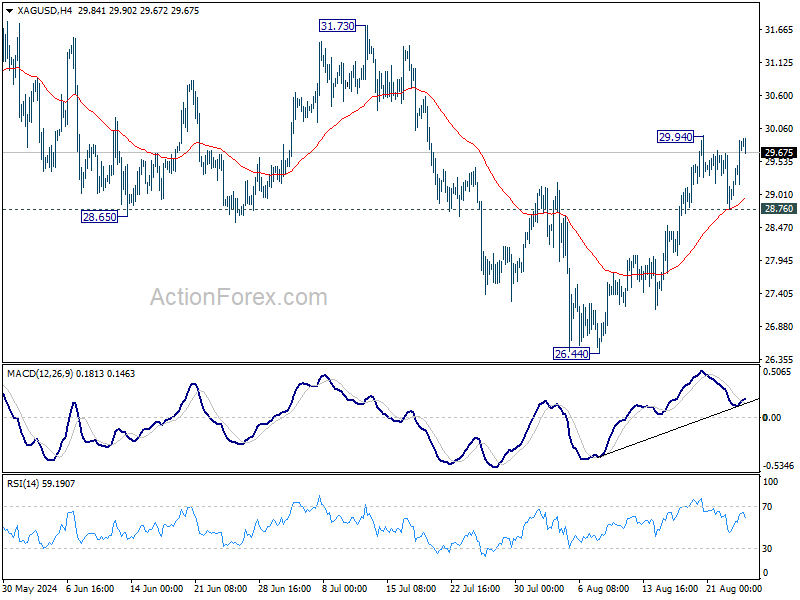
While Silver has been lagging Gold in its run, there is prospect of a catch up ahead. Corrective pattern from 32.50 has likely completed with three waves down to 26.44, after defending 26.12 resistance turned support. For now, further rise is in favor as long as 28.76 support holds. Break of 29.94 will target 31.73 resistance. Decisive break there will solidify this view and target 32.50 and above. However, break of 28.76 will dampen this immediate bullish case.
Key inflation figures from US and Eurozone loom ahead of September rate cuts
Inflation data will remain the focal point for the markets this week. In the US, PCE inflation report is set to take the spotlight. This report is anticipated to strengthen the case for a rate cut by Fed in September, a move that Fed Chair Jerome Powell has already hinted at. However, with another round of NFP and CPI data due before the next FOMC meeting, the exact size of the initial rate cut remains uncertain. Despite this, Fed officials appear to leans towards cautious, measured approach. So, barring any shocks, a 25 bps is the more probable outcome. Alongside inflation, the markets will also be watching data on durable goods orders, GDP revisions, and personal income and spending.
Eurozone’s CPI flash estimate is expected to be a pivotal piece of data that could seal the deal for a rate cut by ECB in September. This would mark the second cut in the current cycle. Meanwhile, Eurozone's economic outlook is clouded by concerns over Germany slipping back into a recession. The Ifo business climate index and GfK consumer sentiment survey, thus, will be closely watched for signs of deteriorating confidence in Europe’s largest economy.
In Japan, Tokyo CPI report, often seen as a precursor to national inflation trends, will be a key focus. It may be too early to determine if BoJ will hike rates again this year. Upcoming data on industrial production and retail sales will be crucial. These figures could provide insight into whether rebound of Japan's industrial sector is gaining momentum in the second half of the year and whether earlier wage increases are translating into higher consumer spending sustainably.
Meanwhile, in Australia, the monthly CPI is expected to show a notable slowdown. However, unless the data reveals significant downside surprises, RBA is likely to hold off on cutting rates this year. Retail sales data from Australia will also be monitored for further clues about consumption trends.
Here are some highlights for the week:
- Monday: Germany Ifo business climate; US durable goods orders.
- Tuesday: Japan corporate service prices; Germany GDP final; US house price index, consumer confidence.
- Wednesday: Australia monthly CPI; Germany Gfk consumer sentiment; Swiss UBS economic expectations; Eurozone M3 money supply.
- Thursday: New Zealand ANZ business confidence; Japan consumer confidence; Germany CPI flash; US GDP revision, jobless claims, goods trade balance, pending home sales.
- Friday: Japan Tokyo CPI, unemployment rate, industrial production, retail sales, housing starts; Australia retail sales; Germany import prices, unemployment; French consumer spending; Swiss KOF economic barometer; UK M4 money supply, mortgage approvals; Eurozone CPI flash unemployment rate; Canada GDP; US personal income and spending; PCE inflation, Chicago PMI.
AUD/USD Daily Report
Daily Pivots: (S1) 0.6731; (P) 0.6765; (R1) 0.6830; More...
Intraday bias in AUD/USD stays on the upside for the moment, with focus on focus on 0.6798 resistance. Firm break there will extend the rally from 0.6348 to 0.6870 resistance next, with prospecting of resuming whole rise from 0.6269. On the downside, below 0.6696 support turn bias to the downside for deeper pull back instead.
In the bigger picture, overall, price actions from 0.6169 (2022 low) are seen as a medium term corrective pattern, with rise from 0.6269 as the third leg. Firm break of 0.6798/6870 resistance zone will target 0.7156 resistance. In case of another fall, strong support should be seen from 0.6169/6361 to bring rebound.
Economic Indicators Update
| GMT | Ccy | Events | Actual | Forecast | Previous | Revised |
|---|---|---|---|---|---|---|
| 08:00 | EUR | Germany IFO Business Climate Aug | 86.5 | 87 | ||
| 08:00 | EUR | Germany IFO Current Assessment Aug | 86.5 | 87.1 | ||
| 08:00 | EUR | Germany IFO Expectations Aug | 86.5 | 86.9 | ||
| 12:30 | USD | Durable Goods Orders Jul | 4.00% | -6.70% | ||
| 12:30 | USD | Durable Goods Orders ex Transport Jul | 0.00% | 0.40% |
USD/JPY Tops Again and Bears Could Aim For Another Drop
Key Highlights
- USD/JPY struggled to continue higher above the 150.00 resistance zone.
- A major bearish trend line is forming with resistance at 145.60 on the 4-hour chart.
- Oil prices are consolidating losses near the $75.00 level.
- EUR/USD is showing bullish signs above the 1.1120 level.
USD/JPY Technical Analysis
The US Dollar started a recovery wave above 147.00 against the Japanese Yen. However, USD/JPY failed to continue higher above 149.40 and started a fresh decline.
Looking at the 4-hour chart, the pair topped near 149.39 and recently started a fresh decline. There was a move below the 146.80 and 146.50 support levels. There was a move below the 50% Fib retracement of the upward move from the 141.68 swing low to the 149.39 high.
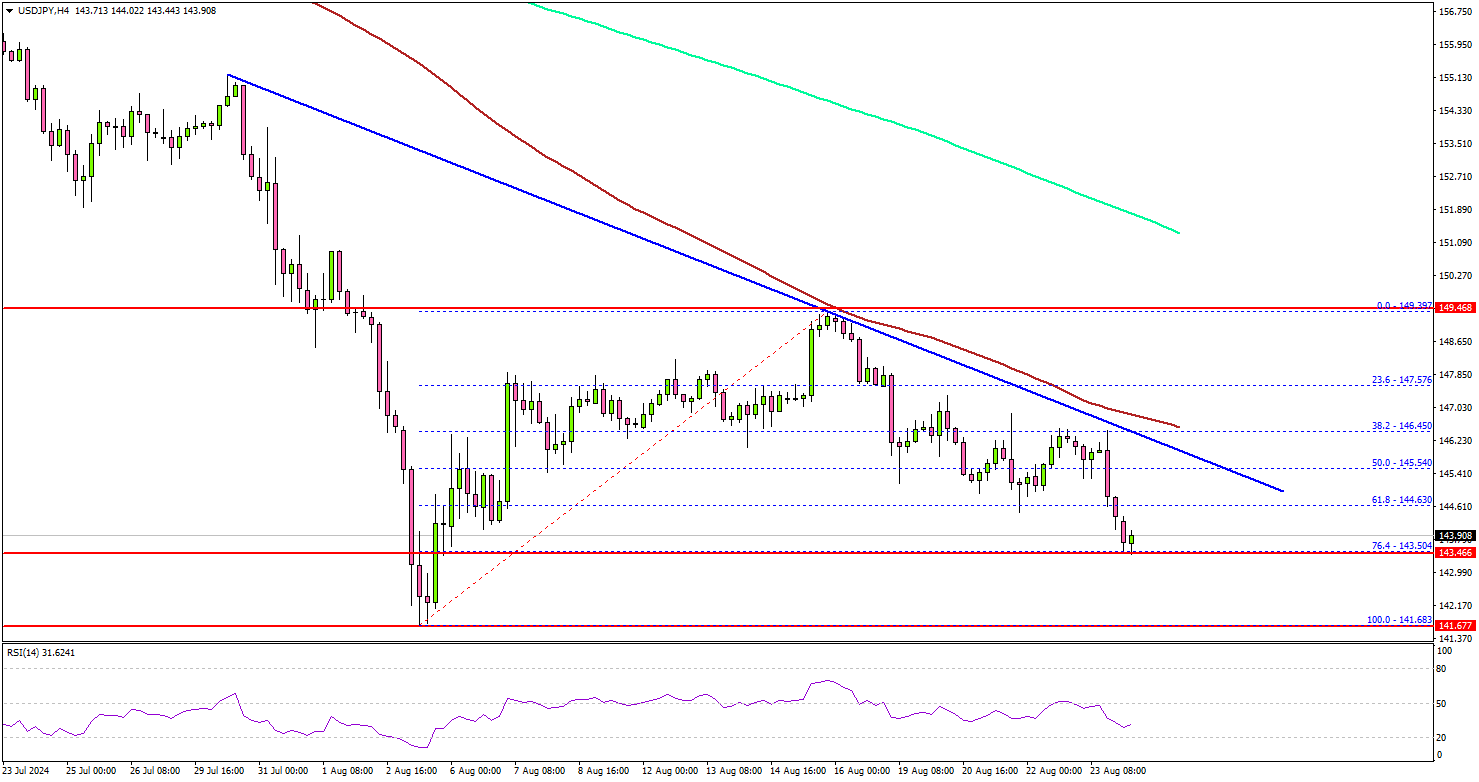
Immediate support is near the 143.50 level. It is near the 76.4% Fib retracement of the upward move from the 141.68 swing low to the 149.39 high.
The first major support is near the 142.50 level. A downside break below the 142.50 level could set the pace for a larger decline. The next major support is near the 141.50 level. Any more losses might send the pair toward the 140.00 support level.
On the upside, the pair could face resistance near the 144.80 level. The first key resistance sits near the 145.60 level. A clear move above the 145.60 level could set the pace for a move toward the 147.00 level.
Looking at EUR/USD, the pair rallied above the 1.1120 level and now seems to be consolidating gains for more upsides.
Economic Releases
- US Durable Goods Orders for July 2024 – Forecast +4% versus -6.7% previous.