
Sample Category Title
Weekly Economic & Financial Commentary: The Time Has Come for Policy to Adjust
Summary
United States: Homes Out of Range
- Chair Powell delivered a distinctively dovish speech this week at Jackson Hole. Elsewhere, a slew of housing data revealed that, although green shoots are sprouting, affordability issues continue to constrain the housing market. Meanwhile, another decline in the Leading Economic Index was a reminder that recession risks lie ahead.
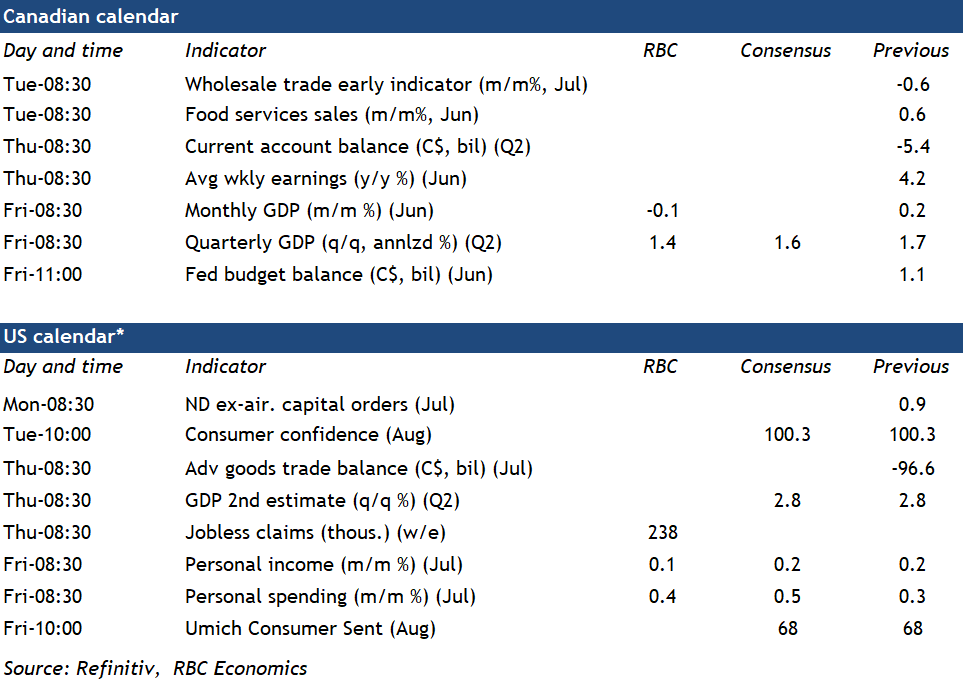
- Next week: Durable Goods (Mon.), Personal Income & Spending (Fri.)
International: Adjusting Our Foreign Central Bank & U.S. Dollar Outlook
- We published our August International Economic Outlook report this week and made some notable adjustments to our forecasts. More specifically, with the Fed likely on track to cut interest rates in September, we believe select foreign central banks can also either cut more aggressively or initiate easing cycles. In addition, as we see the Fed front-loading its easing, we have also adjusted our U.S. dollar outlook to see a stable-to-stronger greenback over the second half of 2025.
- Next week: Canada GDP (Fri.), Eurozone CPI (Fri.), India GDP (Fri.)
Interest Rate Watch: Powell: "The Time Has Come for Policy to Adjust"
- In a widely anticipated speech in Jackson Hole, Wyo., today, the Fed Chair signaled that the FOMC will be cutting rates at its next meeting on Sept. 18. The question is 25 bps or 50 bps?
Credit Market Insights: What Is Driving the Growth in Bankruptcy Filings?
- The rate of businesses filing for bankruptcy has picked up significantly in 2024 and is currently at its highest level since the global financial crisis. What is driving this growth in business bankruptcy, and is it something we should be alarmed about?
Topic of the Week: What a Downward Revision of 818K Jobs Means for the Labor Market
- The preliminary estimate for the 2024 benchmark revision to nonfarm payrolls (NFP) announced this week indicates the level of employment in March 2024 will be revised downward by 818K come the official annual benchmark in early 2025. The announcement was in line with expectations (including ours) for a large negative revision; so, what have we learned from the preliminary benchmark and the data that informed it?
Canadian Q2 GDP Report to Reveal More Softness in the Economy
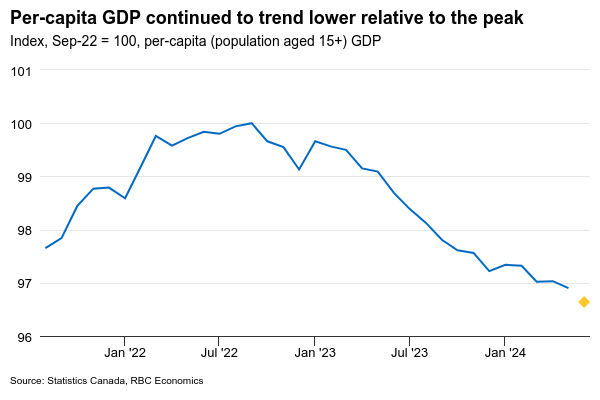
Canada’s GDP report next week is expected to show further weakening in the Canadian economy. We expect a 1.4% (annualized rate) increase in GDP in Q2 – below Statistics Canada’s 2% preliminary estimate a month ago, and marking the 7th of the last 8 quarters of declining output on a per-capita basis.
Growth in GDP in Q2 is expected to have mainly come from personal spending on services, which continued to grow despite signs from our own tracking of card transactions that momentum faded later in the quarter. Spending on goods likely weakened again, consistent with a drop in retail sale volumes in Q2 (-0.3%). Residential investment is expected to fall, largely due to weaker home sales during that quarter. But investment on structures likely saw solid growth, supported by stronger activities in engineering and other construction sector.
We expect growth momentum faded late in the quarter with June output declining 0.1% -- weaker than the 0.1% increase in the advance estimate a month ago. A large drop in manufacturing sale volumes (-2.1%) and a drop in oil & gas drilling activity should leave goods production down 0.5%. Meanwhile, we expect output in the service-providing sector remained flat, showing little change from May. Wholesale sale volumes fell by 0.9% in June, a second consecutive monthly decline. Retail sale volumes were little changed (up 0.1% in June) but a 3.4% tick up in home resales will provide some offset.
Overall, the Canadian economy very likely continued to soften on a per-capita basis (both in June and in Q2 as a whole) given still-strong population growth. That should help to reinforce the Bank of Canada’s view that the economy has softened enough to keep inflation on a downward trajectory. We continue to expect the BoC to cut the overnight rate by another 25 bps in September.
Week ahead data watch
June SEPH data will be monitored closely for further signs of weakening in the labour market. We expect the wage growth to slow further, given job openings have been trending lower. Earlier results from business surveys also indicated that hiring demand is slowing in Canada.
U.S. personal consumption likely edged up 0.4% in July, slightly higher than the 0.3% in the prior month, given the robust retail sales. We expect personal income to tick up 0.1% during that month, consistent with the slower wage growth we observed in July payroll report.
The shutdown of Canada's 2 main railroad companies that started Thursday appears likely to end quickly with the Federal Government taking steps to push the parties back to work and into binding arbitration.
Week Ahead – PCE Inflation Eyed as Fed Lays Groundwork for September Cut
- Focus to stay on the Fed as PCE inflation to be week’s main highlight
- Eurozone inflation data to be crucial for ECB rate cut hopes
- Australian and Tokyo CPI, plus Canadian GDP also on the agenda
Will PCE inflation disappoint dovish expectations?
The Fed’s long-anticipated dovish pivot is upon us and markets are bracing for the first US rate cut of this cycle at the September 17-18 meeting. However, the Fed remains largely data dependent and with the September decision also containing the updated dot plot, the rate path is far from being set in stone.
Hawkish members of the FOMC still see some upside risks to inflation and if the Fed is to cut rates by as much as the 100 basis points that’s priced in by the markets for 2024, the incoming data will need to surprise significantly to the downside.
Hence, Friday’s Personal Income and Outlays report, which contains consumption numbers as well as the all-important personal consumption expenditures (PCE) price index, will take centre stage once again.
The core PCE price index was unchanged at 2.6% y/y in June and it likely stayed there in July. The headline PCE figure is also forecast to have held steady at 2.5% y/y.
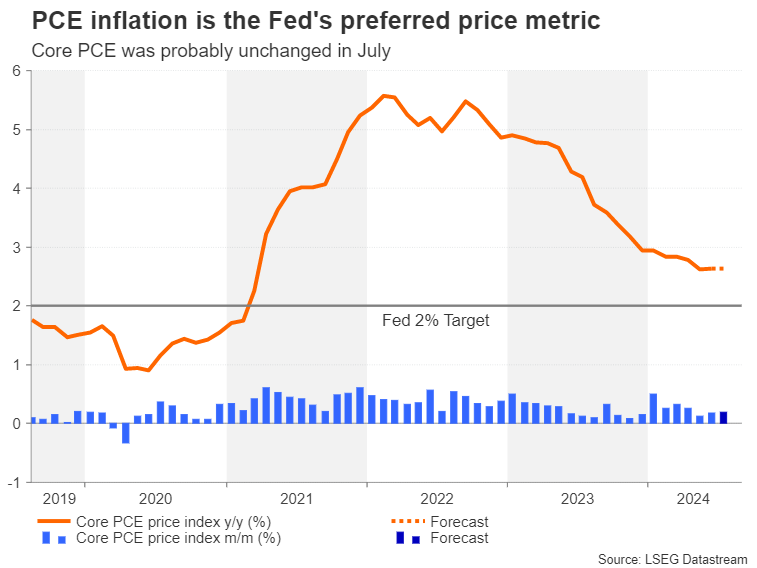
Personal consumption, meanwhile, is expected to have climbed a healthy 0.5% month-on-month in July and whilst that might further allay recession jitters, it could dent hopes of rates being slashed aggressively. A projected rise in personal income of just 0.2% m/m could go some way, however, in offsetting concerns that American consumers are about to splurge again.
The dollar is on course for its fifth weekly loss against a basket of currencies, making it vulnerable to a rebound in the event of a hotter-than-anticipated report.
Treasury auctions, Nvidia earnings on tap too
Ahead of the PCE readings, July durable goods orders will kick things off on Monday and will be followed by the consumer confidence gauge for August on Tuesday. Additionally, the second estimate of Q2 GDP growth is out on Thursday and the Chicago PMI is due on Friday.
There will be limited Fedspeak, with investors having to go with the tone set by Chair Powell in his Jackson Hole address until next Friday’s data, although a large number of Treasury auctions over the coming week could spur some volatility in bond markets as trading volumes pick up from the summer lull.
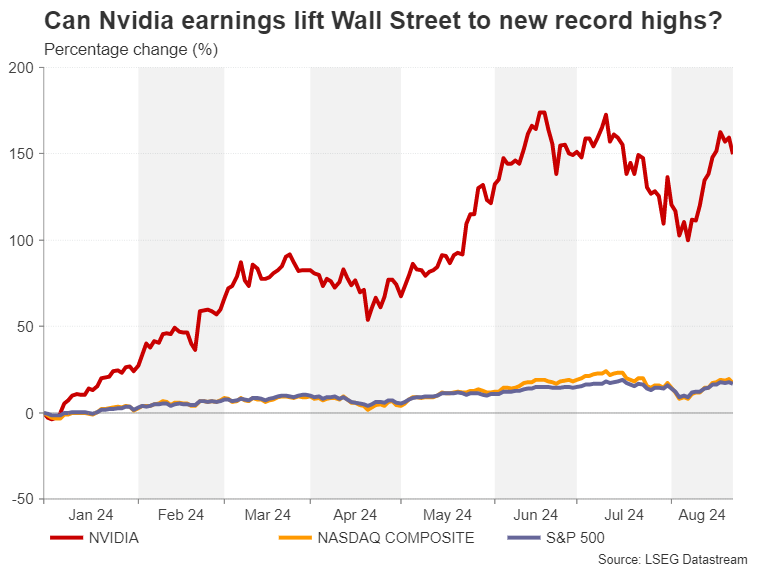
But in equity markets, traders will also be guided by Nvidia’s latest earnings due on Wednesday.
Last Eurozone CPI report before next ECB meeting
The euro has surged this month against the US dollar, trading above the $1.11 level for the first time since December. The gains come despite intense expectations that the European Central Bank will lower interest rates again in September.
However, whilst there’s a strong likelihood of a September move, there’s a small but significant risk that ECB policymakers will not be convinced by then that another cut is needed. Friday’s flash CPI estimate for August will be vital in giving the green light for more easing in September.
The Eurozone’s headline inflation rate is forecast to moderate from 2.6% y/y in July to 2.3% in August, bringing it much closer to the ECB’s 2% goal. The core rate that excludes all volatile items is expected to tick down slightly to 2.8% y/y.
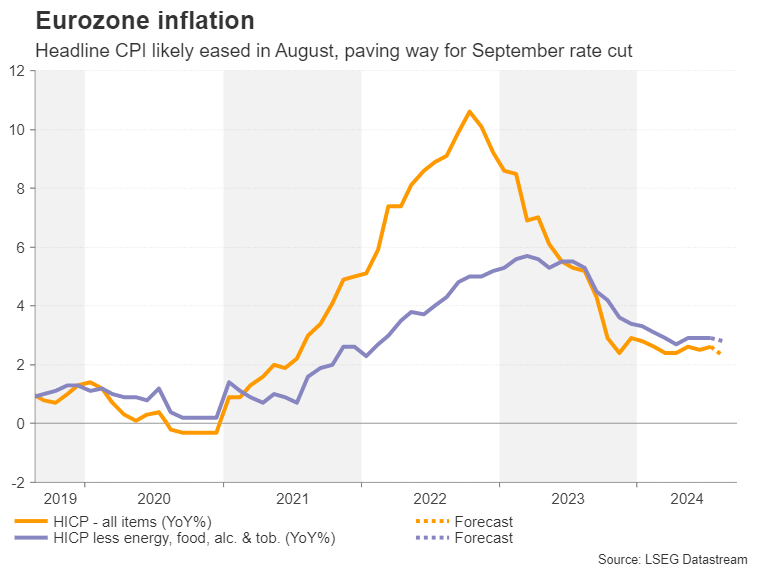
Any disappointment in the inflation readings could boost the euro further versus the greenback, although it’s unlikely to change the market consensus for a September cut.
In other releases out of the euro area, Germany’s Ifo business climate survey will be watched on Monday, and the Eurozone economic sentiment indicator will follow on Thursday.
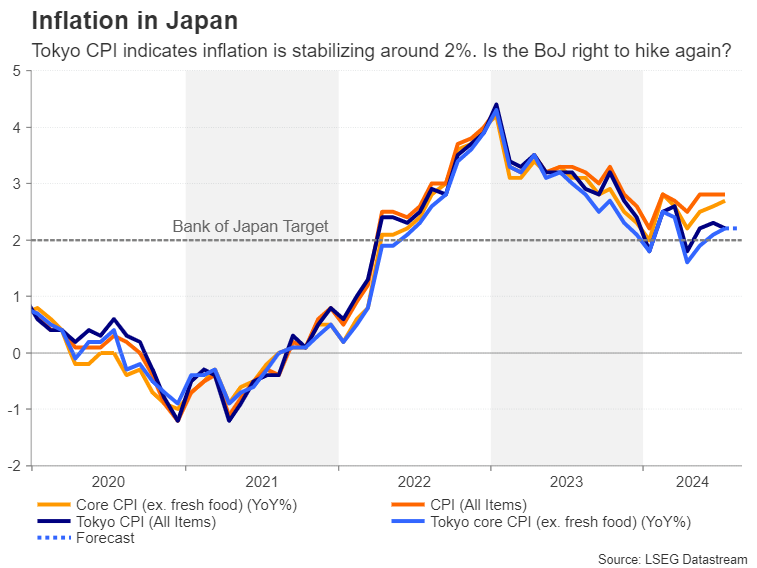
Tokyo CPI to be key as BoJ ponders next move
The yen, or more specifically, the Bank of Japan, is partly responsible for the dollar’s woes. The reality that years of ultra-loose monetary policy is coming to an end in Japan finally struck a nerve with investors when the Bank of Japan simultaneously hiked rates and announced the gradual halving of its asset purchases at its July meeting.
There’s a sizeable probability that the BoJ will raise rates for a third time by year end. Governor Ueda has hinted that more rate increases are on the cards if the economy and inflation remain on track even though the Bank is concerned about the current instability in the markets. Thus, the Tokyo CPI data out on Friday will be important as they are seen as a precursor to the nationwide figures, which are published much later.
There will be a slew of other indicators on Friday, including preliminary industrial production for July, retail sales, and the jobless rate.
RBA hoping for more progress on inflation
In Australia, inflation will also be the dominant theme. The monthly prints are due on Wednesday and will be watched closely amid worries about inflation remaining sticky. In June, the annual CPI rate finally edged down to 3.8%, having risen in the months prior. But policymakers at the Reserve Bank of Australia will want to see further declines before dropping their hawkish bias.
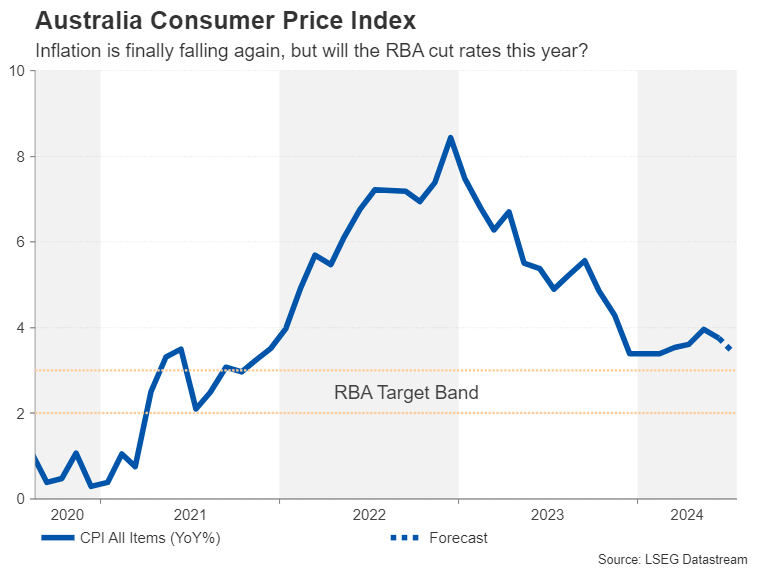
If there was no fresh progress in July, the RBA is almost certain to continue ruling out a rate this year and this would be positive for the Australian dollar, which has rallied by almost 3% against its US counterpart in August. But there could be some downside risks from Q2 data on construction (Wednesday) and capital expenditure (Thursday) if they miss expectations.
Will Canadian GDP matter for BoC rate cut bets?
A central bank that is well ahead in the rate cutting race is the Bank of Canada. Investors have priced in a more than 90% chance of another 25-bps reduction in September as Canadian inflation has generally been moving in line with projections.
However, stronger-than-expected economic growth would be one reason why policymakers might decide to skip a meeting, putting the spotlight on Friday’s Q2 GDP numbers. A day earlier, wage growth figures for June might also attract some attention for the Canadian dollar.
Weekly Focus – More Soft Manufacturing Signals
Markets remained calm this week with risk sentiment improving further. Stock markets continued to trade higher taking S&P500 back to the recent highs reached in mid-July and cyclical metal prices increased as well. Bond yields drifted moderately lower in the US while EUR/USD continued higher to the highest level in a year. The next big market mover the market will be awaiting will come in two weeks with the US employment report on 6 September followed by the ECB meeting on 12 September.
In the euro area PMI data for July painted a soft picture as PMI manufacturing dropped from 45.8 to 45.6 (consensus 45.8). While PMI services increased from 51.9 to 53.3, it was driven mainly by a big increase in France related to the Olympics. The weaker manufacturing picture fits with the recent loss of manufacturing momentum witnessed in China. On the euro inflation front this week provided some encouraging news as negotiated wage growth for Q2 dropped to 3.6% y/y down from 4.7% y/y in Q1.
US economic news provided a mixed bag. PMI manufacturing also dropped here - from 49.6 to 48.0, the weakest number since December. PMI service, however, stayed at a robust level at 55.2. The leading indicator from Conference Board softened from -0.2% m/m to -0.6% m/m in July (consensus -0.4% m/m) but the indicator has not performed so well in the past couple of years as the economy has performed better than the indicator suggested. The weekly jobless claims get more attention with the increased focus on the labour market, but they did not provide much news as they were broadly unchanged at 232k versus 228k the week before. BLS released a preliminary annual revision of the employment data and reported a revision of -818k jobs. The market did not react much, though, and a couple of Fed speakers stated it did not change their view of the labour market.
Fed speakers as well as the FOMC minutes generally signalled more confidence with getting inflation back to 2% while some members have increasingly turned their attention to risks in the labour market. However, the overall message is still that a gradual path of rate reductions is expected for now but that it will be data dependent. Hence, a path of moving with 25bp increments is currently seen as most likely. The market currently prices 100bp of easing over the next three meetings, which entails a move to a 50bp cut on one of the meetings, which we do not expect. Should the labour market cool faster than expected, though, the Fed would likely turn to 50bp steps of easing as they start from a quite restrictive stance.
Focus the coming week will be on Flash euro area CPI for August, a key data point ahead of the ECB meeting on 12 September. Focus is on core inflation which we forecast to only marginally decline to 2.8% from 2.85% as service inflation likely remained sticky. The euro area also releases consumer confidence and unemployment numbers. In the US we get consumer confidence from Conference Board, where the labour market questions 'jobs hard to get' and 'jobs plentiful' will be in focus. Finally in Japan, we will get retail sales, industrial production and Tokyo CPI. China is not releasing any tier-1 data and policy rates will likely stay on hold after they were cut last month.
Sunset Market Commentary
Markets
At a hearing before Parliament this morning, BoJ governor Ueda had a balanced but after all clear message. The BoJ has started policy normalization and intends to further walk that path if inflation and growth continue to develop in line with the banks’ expectations. The market volatility in the wake of the July decision didn’t change the BoJ’s basic intention to bring its policy rate to a more neutral level. It will assess the impact of this volatility on inflation and activity. Still the basic assumption is that market swings might cause caution on the timing of a next move, but that it won’t change the new direction of policy. Anyway, the BoJ governor also downplayed the BoJ rate hike as the trigger for the market meltdown early August. He pinpointed US recession fears as an important factor for the sharp market repositioning. A next hike in September is unlikely, but gradual further normalization in Q4 (December) looks very reasonable. With the Fed starting a protracted easing cycle next month, the yen now looks much better protected than was the case two months ago. USD/JPY today is ceding modest ground (146) going into Fed Chair Powell’s lecture at the Jackson Hole Symposium.
Recently, softer US growth and inflation data caused markets to discount quite a sharp reduction of Fed policy tightening this year (minus 1% this year and almost 1.25% additional reduction next year). This brought in particular US long term yields back close to important support levels (10-y 3.80% area, 30-y 3.93%/4.0% area). The 2-y yield tentatively shifted to a wait-and-see approach near the 4.0% barrier. Key question for markets was whether Powell would ‘validate’ (or at least not reject) current market pricing or whether he would advocate a (much) more gradual approach.
First headlines from the Fed Chair’s speech are seen as tilting to the dovish side. Powell indicates that confidence has grown that inflation is on a path to 2% and the cooling of the labour market is ‘unmistakable’. The labour market is unlikely to become a source of inflation soon and the Fed doesn’t seek a further cooling of the labour market. At the same time Powell sees the current level of the policy rate as giving ample room to respond to risks. The timing and pace of cuts still depend on the data and the outlook, however markets clearly see this as the Fed further turning away the focus from inflation to supporting the labour market. After trading little changed going into Powell’s address, markets see this tone as keeping the door open for 25+ bps rate cut steps at some point in a not that distant future. US yields decline between 8 bps (2-y) and 4.5 bps (30-y). The dollar resumes its decline (EUR/USD 1.1165, DXY 101.2, USD/JPY 145.2). Equites rally, rising up to 1.75% (Nasdaq).
News & Views
The Czech Ministry of Finance lowered its GDP forecast for this year to 1.1%. Minister of Finance Stanjura said that a data revision by the Czech Statistical Office is the main reason for lowering the estimate. The base for 2023 was higher than expected as last year’s drop in the economy was not 0.3%, but only 0.1%. The MoF now expects the economy to accelerate to 2.7% GDP growth in 2025. Household consumption and government spending are the main drivers. Czech inflation is set to oscillate around the CNB’s 2% inflation this year (2.4% average) and in 2025 (2.3%). Real wages are expected to increase by 4% and the unemployment rate should stay near its record low. The Czech krone treads water today near this month’s recovery top around EUR/CZK 25.05.
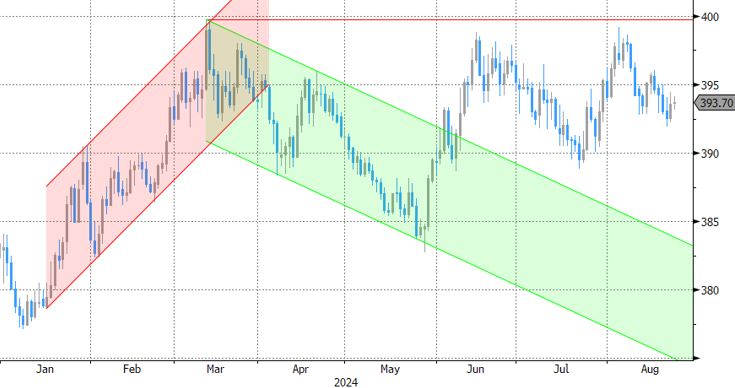
Hungarian PM Orban’s cabinet chief, Rogan, said that the central bank is right to proceed cautiously in its interest rate cuts. The comments came after economy minister Nagy earlier this week made renewed calls on the central bank to support growth, referring to the MNB as a cyclops with an eye set only on inflation. Rogan said that politicians would always tend to urge faster moves but the central bank is right to take its own independent decisions. We think that the MNB will next week keep its base rate on hold at 6.75% and only conduct a next 25 bps rate cut in September, after the ECB and the Fed probably did the same. Upward (core) CPI surprises in July and more fragile forint (EUR/HUF 394) call for caution. Our end-of-year forecasts is unchanged at 6.25%.
Graphs
EUR/HUF: forint hovers near 393 as MNB might take a pause in its easing cycle next week.
USD/JPY: dollar resumes decline on ‘soft’ Powell adress.
US 2y yield: drifting further below 4% mark.
Nasdaq extends rebound as Powell suggested further easing of financial conditions.
Fed’s Powell hints at rate cuts: ‘Time has come’ as labor market concerns grow
In his highly anticipated Jackson Hole speech, Fed Chair Jerome Powell made it clear that "the time has come" for a shift towards monetary easing. Although he did not specify the exact timing or pace of rate cuts, Powell highlighted the increasing need to support the labor market, indicating that Fed is ready to respond to "further weakening" in labor conditions.
Powell noted that the "upside risks to inflation have diminished," while the "downside risks to employment have increased." This marks a notable change in focus, with the Fed Chair emphasizing that the path forward will be determined by "incoming data," the evolving economic outlook, and the balance of risks.
He reassured markets of Fed's commitment to maintaining employment, asserting that the central bank will do "everything we can to support a strong labor market." Powell expressed confidence that with a cautious reduction in policy restraint, the economy could return to the 2% inflation target without jeopardizing employment.
Powell also underscored the flexibility that the current policy rate offers, pointing out that it provides "ample room" to address any potential risks, including the possibility of further deterioration in labor market conditions.
USD/JPY Mid-Day Outlook
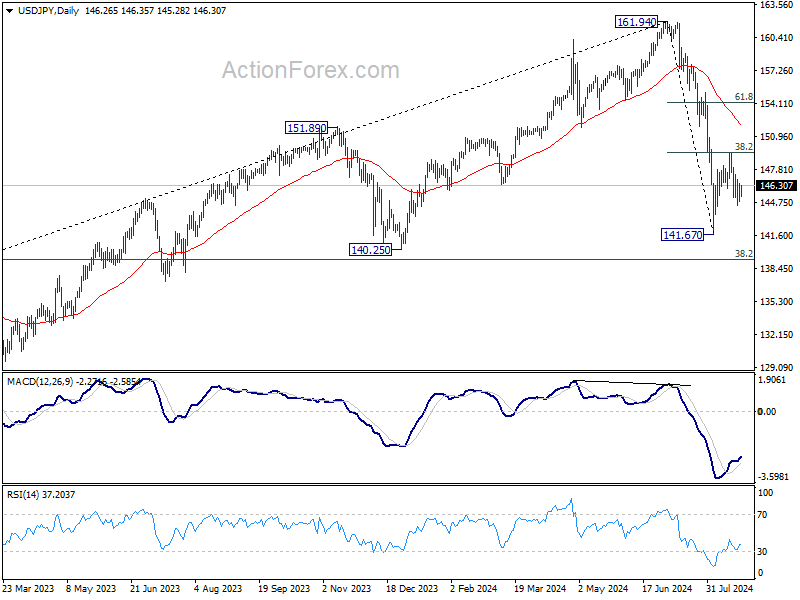
Daily Pivots: (S1) 144.19; (P) 145.55; (R1) 146.63; More...
Outlook in USD/JPY is unchanged and intraday bias remains neutral. On the downside, break of 144.44 temporary low will reaffirm the case that rebound form 141.67 has completed, and bring retest of this low. On the upside, break of 149.35 will resume the rebound to 61.8% retracement of 161.94 to 141.67 at 154.19, as the second leg of the corrective pattern from 161.94 high.
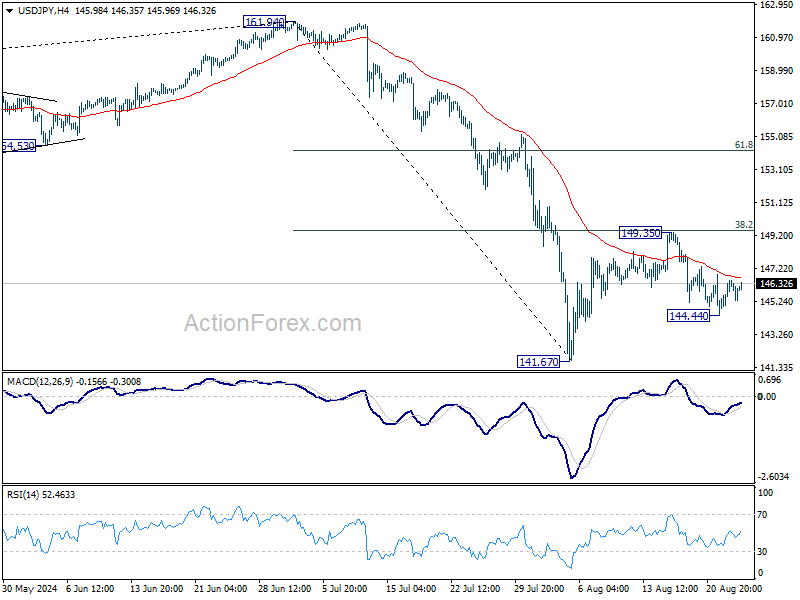
In the bigger picture, fall from 161.94 medium term is seen as correcting whole up trend from 102.58 (2021 low). Deeper decline could be seen to 38.2% retracement of 102.58 to 161.94 at 139.26, which is close to 140.25 support. In any case, risk will stay on the downside as long as 55 W EMA (now at 149.63) holds. Nevertheless, firm break of 55 W EMA will suggest that the range for medium term corrective pattern is already set.
USD/CHF Mid-Day Outlook
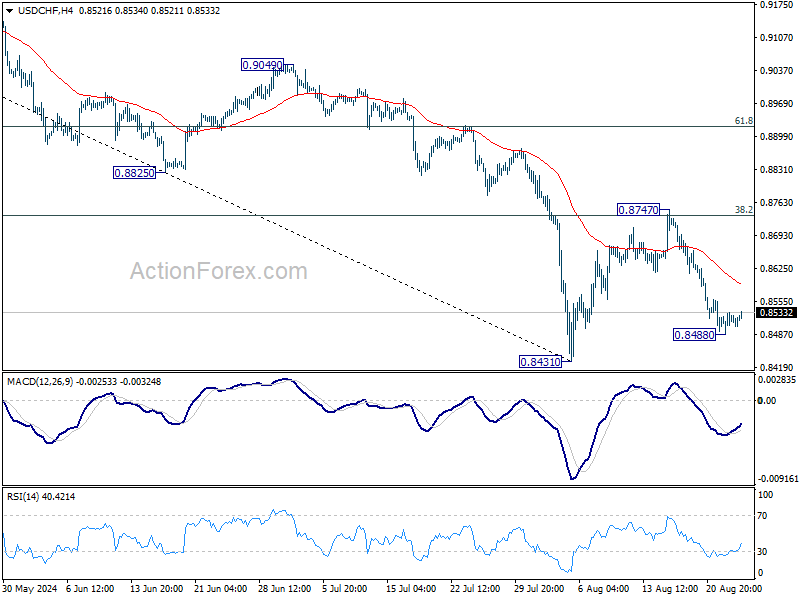
Daily Pivots: (S1) 0.8496; (P) 0.8515; (R1) 0.8541; More…..
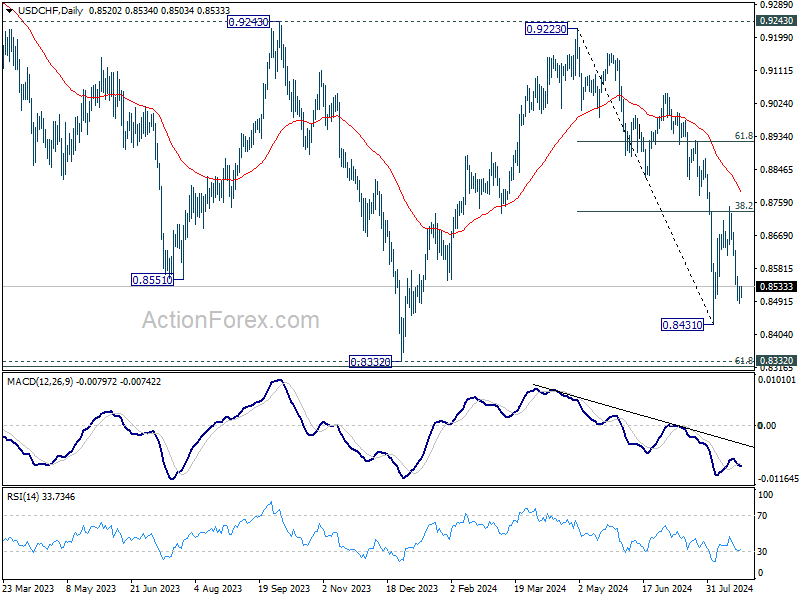
Intraday bias in USD/CHF Is turned neutral first with current recovery. While stronger rise cannot be ruled out, risk will stay on the downside as long as 0.8747 resistance holds. Below 0.8488 will target 0.8431 support first. Firm break there will resume whole decline from 0.9223 towards 0.8332 low.
In the bigger picture, price actions from 0.8332 (2023 low) are currently seen as a medium term corrective pattern, with fall from 0.9223 as the second leg. Strong support could be seen from 0.8332 to bring rebound. Yet, overall outlook will continue to stay bearish as long as 0.9243 resistance holds. Firm break of 0.8332, however, will resume larger down trend from 1.0146 (2022 high).
GBP/USD Mid-Day Outlook
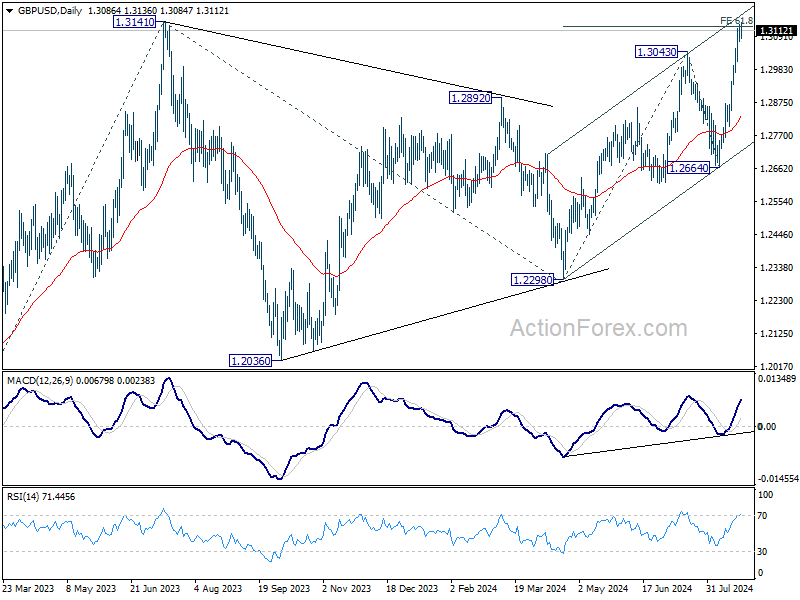
Daily Pivots: (S1) 1.3069; (P) 1.3100; (R1) 1.3122; More...
Intraday bias in GBP/USD is turned neutral first with 4H MACD crossed below signal line. On the upside, decisive break of 61.8% projection of 1.2298 to 1.3043 from 1.2664 at 1.3124 and 1.3141 resistance will confirm larger up trend resumption for 100% projection at 1.3409. On the downside, break 1.3010 minor support will turn bias to the downside for deeper retreat first.
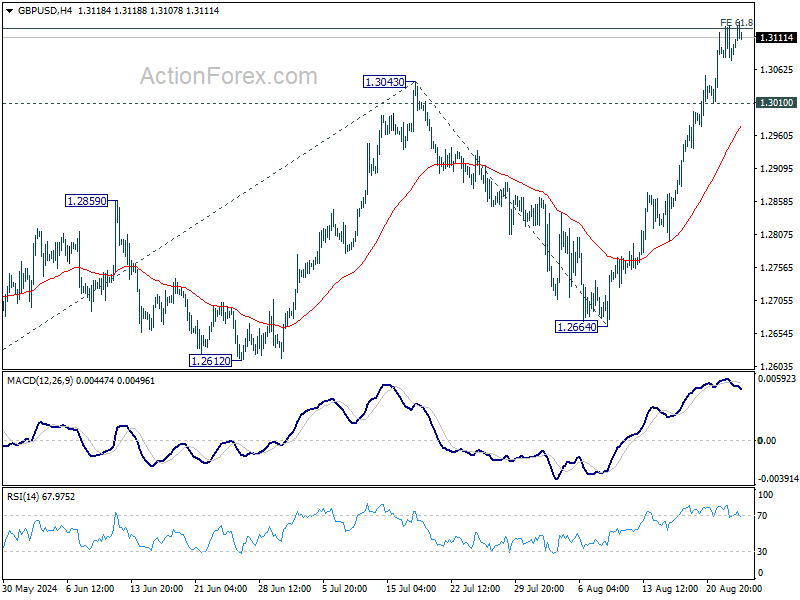
In the bigger picture, corrective pattern from 1.3141 might have completed at 1.2298 already. Rise from there could be resuming the larger up trend from 1.0351 (2022 low). Decisive break of 1.3141 will target 38.2% projection of 1.0351 to 1.3141 from 1.2298 at 1.3364 next. However, break of 1.2664 support will delay this bullish case once again and extend the corrective pattern from 1.3141.
Gold (XAU/USD) Retests $2500/oz Ahead of Powell’s Jackson Hole Remarks
- Gold prices retest $2500/oz ahead of Fed Chair Powell’s Jackson Hole speech.
- Gold’s rebound in the European session and technical analysis suggest bullish momentum.
- September rate cuts likely already priced in. What impact will Powell’s remarks have?
Gold prices are back at $2500/oz following a long awaited retracement which materialized during Thursdays US session. A combination of a stronger US Dollar, rising US Yields and potential profit taking ahead of Fed Chair Powell’s address at the Jackson Hole Symposium likely all playing a role.
Market participants appeared to be positioning themselves ahead of the highly anticipated speech by Fed Chair Jerome Powell. Many had hoped Powell would confirm September rate cuts, however following Wednesday’s downward revision to US jobs data market participants believe a rate cut in September is a foregone conclusion. This leaves the question then, what will the market’s response to Powell’s remarks be?
As things stand, the weakness in the US Dollar and the rise in Gold at the back end of last week hint that a lot of the expectations around a September rate cut may already be priced in. A bunch of Fed policymakers confirmed yesterday that they are supportive of rate cuts in September and despite this Gold struggled in the US session. A sign that a September rate cut may largely be priced in perhaps?
This is my thinking ahead of Powell’s remarks and hence my apprehension regarding the impact his speech will have.
There are a host of other Federal Reserve policymakers on the docket as well today thus volatility may still be on the cards. However, in terms of direction I am not expecting anything significant out of Powell’s remarks. I will be paying attention to any mention around a potential 50 bps cut in September, something markets were pricing in favorably just 10 days ago. As things stand, futures are pricing in just shy of a 100 bps of cuts through to the end of 2024.
Technical Analysis Gold (XAU/USD)
From a technical standpoint, the rebound in Gold in the European session has been impressive as the precious metal peaks above the $2500/oz handle. Yesterday’s dip may have been a precursor that allowed bulls to reload while allowing others to get in at a better price.
This could explain the speed of the recovery this morning as Fed Chair Powell is set to take the stage.
Yesterday’s massive bearish engulfing candle found support at the key 2472 area before buyers returned to the fold. I had been anticipating such a pullback since Monday as gold held the high ground above the $2500/oz mark.
Given that Gold continues to print ATH, finding key levels of late has been a challenge. Immediate resistance in today’s US session may be present at 2514 and 2531.66, which is the weekly high thus far.
The downside is a bit easier with immediate support at 2484, before the 2472 area comes back into focus. A move lower opens up a retest of the 2450 key area of support.
GOLD (XAU/USD) Weekly Chart, August 23, 2024
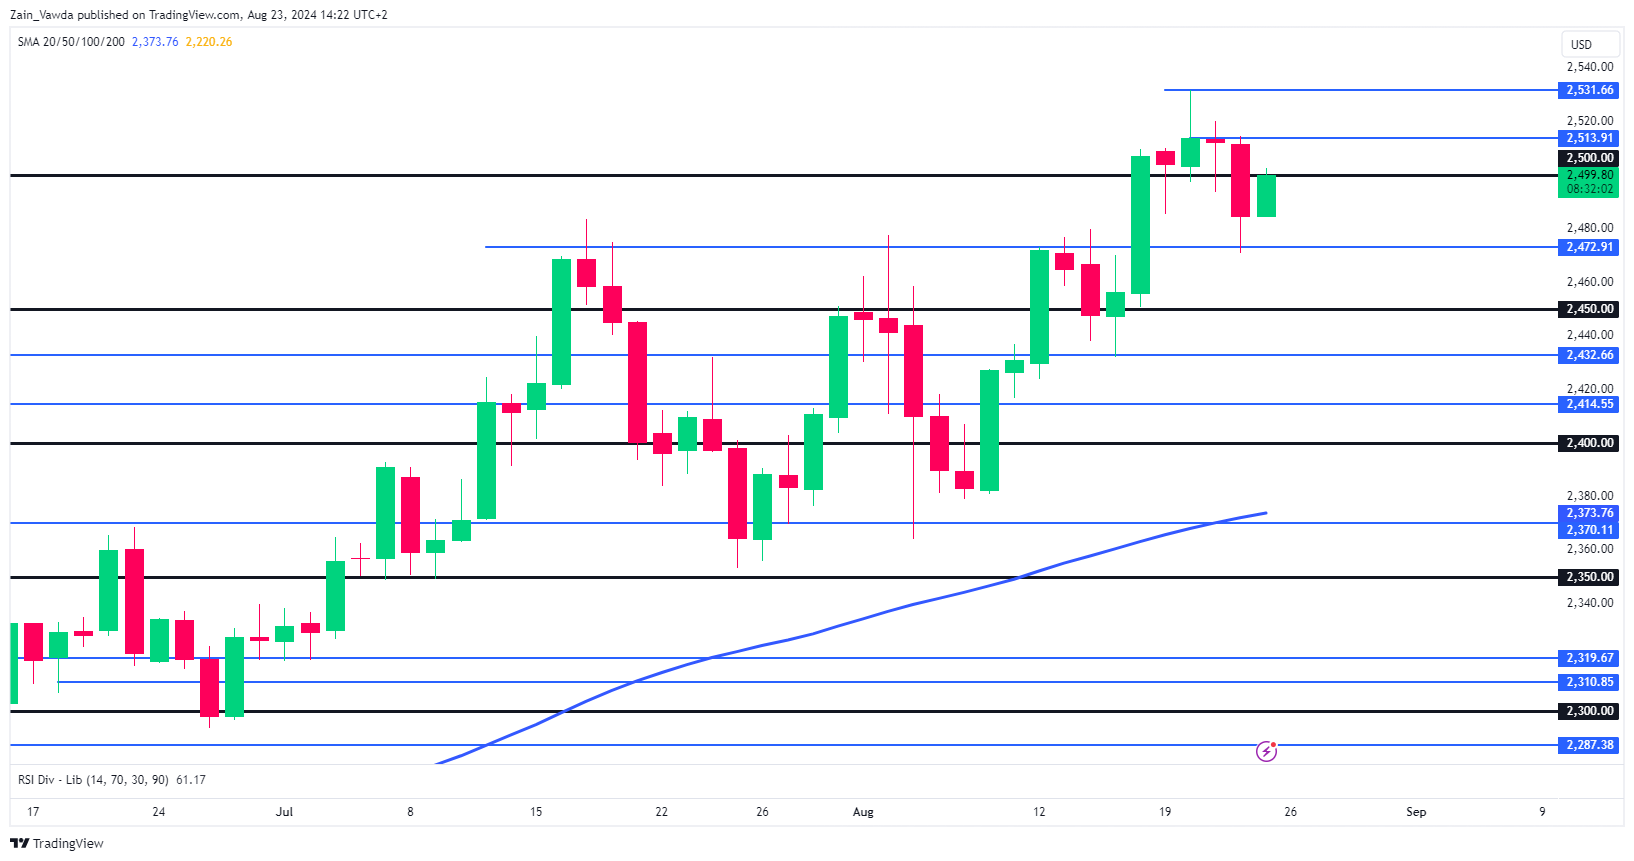
Source: TradingView (click to enlarge)
Support
- 2484
- 2472
- 2450
Resistance
- 2514
- 2531.66
- 2550