
Sample Category Title
EUR/USD Mid-Day Outlook
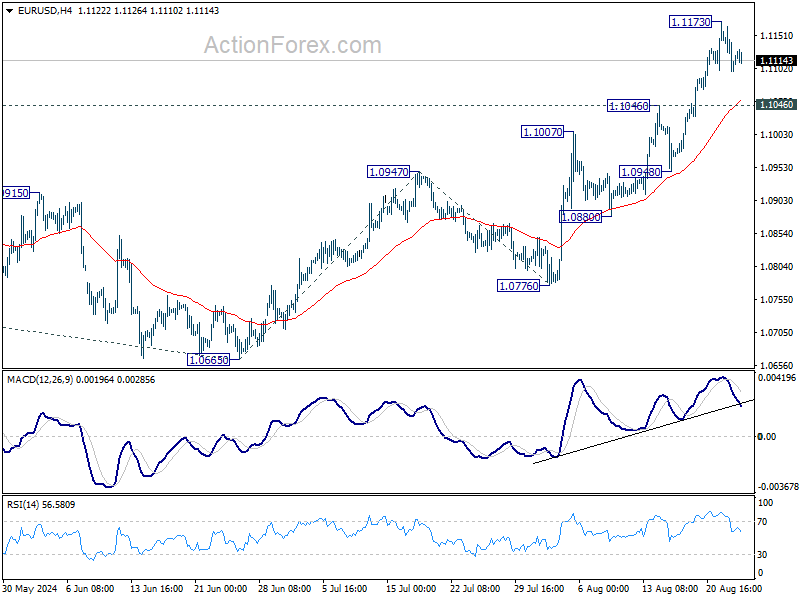
Daily Pivots: (S1) 1.1085; (P) 1.1125; (R1) 1.1152; More....
EUR/USD is staying in consolidation below 1.1173 and intraday bias remains neutral for the moment. Further rally is expected as long as 1.1046 resistance turned support holds. Above 1.1173 will target 161.8% projection of 1.0665 to 1.0947 from 1.0776 at 1.1232. However, break of 1.1046 will indicate short term topping and bring deeper pullback towards 1.0947.
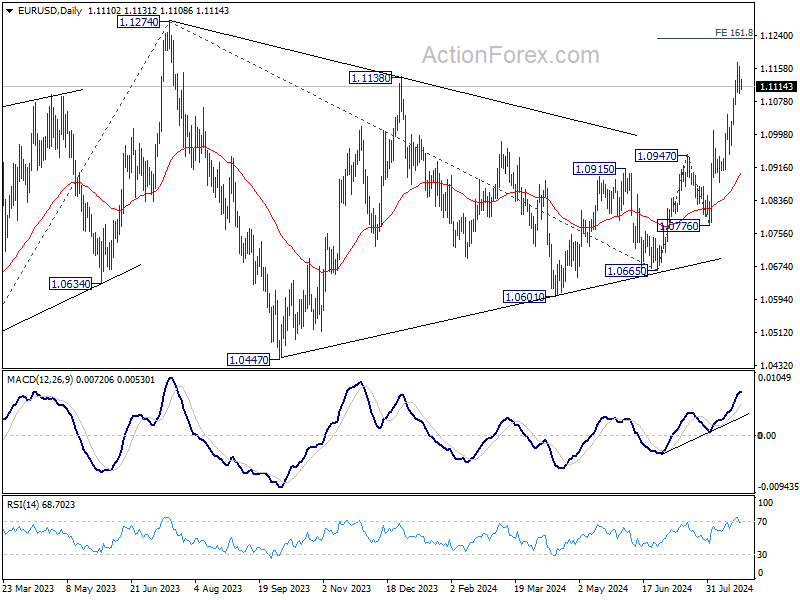
In the bigger picture, price actions from 1.1274 are viewed as a corrective pattern that's could still extend. Break of 1.1138 resistance will be the first signal that rise from 0.9534 (2022 low) is ready to resume through 1.1274 (2023 high). Next target is 61.8% projection of 0.9534 to 1.1274 from 1.0665 at 1.1740. However, break of 1.0974 resistance turned support will extend the correction with another falling leg back towards 1.0447 support.
Calm Before the Speech: Markets Steady Ahead of Powell
Trading in the forex markets remains muted as investors hold their positions ahead of Fed Chair Jerome Powell's highly anticipated speech at Jackson Hole. Market participants are keenly focused on any signals regarding the Fed's plans for monetary policy easing, beyond the expected rate cut in September.
Currently, Fed fund futures indicate a 26.5% probability of a 50bps cut in September, with a 73.5% likelihood of a more modest 25bps reduction. By the end of the year, there is a 65% chance that the federal funds rate will be reduced by a total of 100 basis points, bringing it to a range of 4.25-4.50%. Powell's speech could cause significant market movements depending on whether he affirms or challenges these expectations.
The next move in the currency markets will likely be influenced by shifts in risk sentiment. NASDAQ has been clearly losing upside momentum as seen in H MACD. Firm break of 55 H EMA (now at 17615.51) should confirm short term topping at 18017.68. Deeper fall should be seen to 38.2% retracement of 15708.53 to 18017.68 at 17135.59 in rather quick manner, even as a corrective move. If realized, that would give Dollar a near term boost, in particular against commodity currencies.
In Europe, at the time of writing, FTSE is up 0.34%. DAX is up 0.54%. CAC is up 0.39%. UK 10-year yield is down -0.010 at 3.952. Germany 10-year yield is down -0.0061 at 2.243. Earlier in Asia, Nikkei rose 0.40%. Hong Kong HSI fell -0.16%. China Shanghai SSE rose 0.20%. Singapore Strait Times rose 0.43. Japan 10-year JGB yield rose 0.0161 to 0.896.
Canada's retail sales falls -0.3% mom in Jun, to bounce back 0.6% mom in Jul
Canada's retail sales value fell -0.3% mom to CAD 65.7B in June, matched expectations. Sales were down in four of nine subsectors and were led by decreases at motor vehicle and parts dealers. In volume terms, retail sales increased 0.1% mom.
Excluding gasoline stations and fuel vendors and motor vehicle and parts dealers, sales value were up 0.4% mom.
Retail sales volume were down 0.5% in the second quarter. In volume terms, quarterly sales declined -0.3%.
Advance estimate suggests that retail sales value rose 0.6% mom in July.
BoJ's Ueda ready to scale back easing despite market instability
In a special parliamentary session today, BoJ Governor Kazuo Ueda reiterated the central bank's stance to its current monetary policy, even amidst recent market volatility. He emphasized that there is "no change to our basic stance to adjust the degree of monetary easing" should economic and price trends align with its forecasts.
Addressing concerns over the market turbulence observed in early August, Ueda attributed the instability to rising fears of a US recession, driven by weaker-than-expected economic data. He also noted that BoJ’s interest rate hike in July had triggered a sharp reversal in the "one-sided Yen falls".
He stressed that BoJ would continue to monitor market movements closely, recognizing their potential impact on the central bank's growth and price forecasts.
"Markets at home and abroad remain unstable, so we will be highly vigilant to market developments for the time being," Ueda remarked.
Japan's CPI core ticks up to 2.7% in Jul, but core-core falls to 1.9%
Japan's CPI Core, which excludes food, rose slightly from 2.6% yoy to 2.7% yoy in July, aligning with expectations and marking the 28th consecutive month that core inflation has been at or above the BoJ 2% target.
However, CPI core-core, which excludes both food and energy, fell from 2.2% yoy to 1.9% yoy, dipping below the critical 2% threshold for the first time since September 2022.
Headline CPI remained steady at 2.8% yoy. Notably, electricity prices surged by 22% following the suspension of utility subsidies, which contributed to the overall inflation rate. In contrast, services inflation softened, dropping from 1.7% yoy to 1.4% yoy.
The uptick in core CPI largely reflects the phase-out of government subsidies aimed at reducing household utility costs. Excluding this factor, the broader inflation trend appears to be on a slowing path.
New Zealand retail sales volume falls -1.2% qoq in Q2
New Zealand's retail sales volume fell -1.2% qoq in Q2, , well below the expected -0.1% drop. Retail sales value also decreased by -1.3% qoq. Notably, 11 out of 15 retail industries reported lower sales volumes compared to the previous quarter.
Total volume of retail sales per person fell by -1.5%, marking the tenth consecutive quarter of decline after adjustments for seasonal effects and price inflation.
Ricky Ho, Business Financial Statistics Manager, highlighted the severity of this trend, noting, "Retail sale volumes per person have been falling for the last two-and-a-half years. The last time we saw several quarters of consistent falls was between 2007 and 2009, which coincided with the global financial crisis."
EUR/USD Mid-Day Outlook
Daily Pivots: (S1) 1.1085; (P) 1.1125; (R1) 1.1152; More....
EUR/USD is staying in consolidation below 1.1173 and intraday bias remains neutral for the moment. Further rally is expected as long as 1.1046 resistance turned support holds. Above 1.1173 will target 161.8% projection of 1.0665 to 1.0947 from 1.0776 at 1.1232. However, break of 1.1046 will indicate short term topping and bring deeper pullback towards 1.0947.
In the bigger picture, price actions from 1.1274 are viewed as a corrective pattern that's could still extend. Break of 1.1138 resistance will be the first signal that rise from 0.9534 (2022 low) is ready to resume through 1.1274 (2023 high). Next target is 61.8% projection of 0.9534 to 1.1274 from 1.0665 at 1.1740. However, break of 1.0974 resistance turned support will extend the correction with another falling leg back towards 1.0447 support.
Economic Indicators Update
| GMT | Ccy | Events | Actual | Forecast | Previous | Revised |
|---|---|---|---|---|---|---|
| 22:45 | NZD | Retail Sales Q/Q Q2 | -1.20% | -1.00% | 0.50% | 0.40% |
| 22:45 | NZD | Retail Sales ex Autos Q/Q Q2 | -1.00% | -0.80% | 0.40% | 0.30% |
| 23:01 | GBP | GfK Consumer Confidence Aug | -13 | -11 | -13 | |
| 23:30 | JPY | National CPI Y/Y Jul | 2.80% | 2.80% | ||
| 23:30 | JPY | National CPI Core Y/Y Jul | 2.70% | 2.70% | 2.60% | |
| 23:30 | JPY | National CPI Core-Core Y/Y Jul | 1.90% | 2.20% | ||
| 12:30 | CAD | Retail Sales M/M Jun | -0.30% | -0.30% | -0.80% | |
| 12:30 | CAD | Retail Sales ex Autos M/M Jun | 0.30% | -0.40% | -1.30% | |
| 14:00 | USD | New Home Sales Jul | 630K | 617K |
Canada’s retail sales falls -0.3% mom in Jun, to bounce back 0.6% mom in Jul
Canada's retail sales value fell -0.3% mom to CAD 65.7B in June, matched expectations. Sales were down in four of nine subsectors and were led by decreases at motor vehicle and parts dealers. In volume terms, retail sales increased 0.1% mom.
Excluding gasoline stations and fuel vendors and motor vehicle and parts dealers, sales value were up 0.4% mom.
Retail sales volume were down 0.5% in the second quarter. In volume terms, quarterly sales declined -0.3%.
Advance estimate suggests that retail sales value rose 0.6% mom in July.
Yen Edges Higher on BoJ’s Ueda Hawkish Remarks
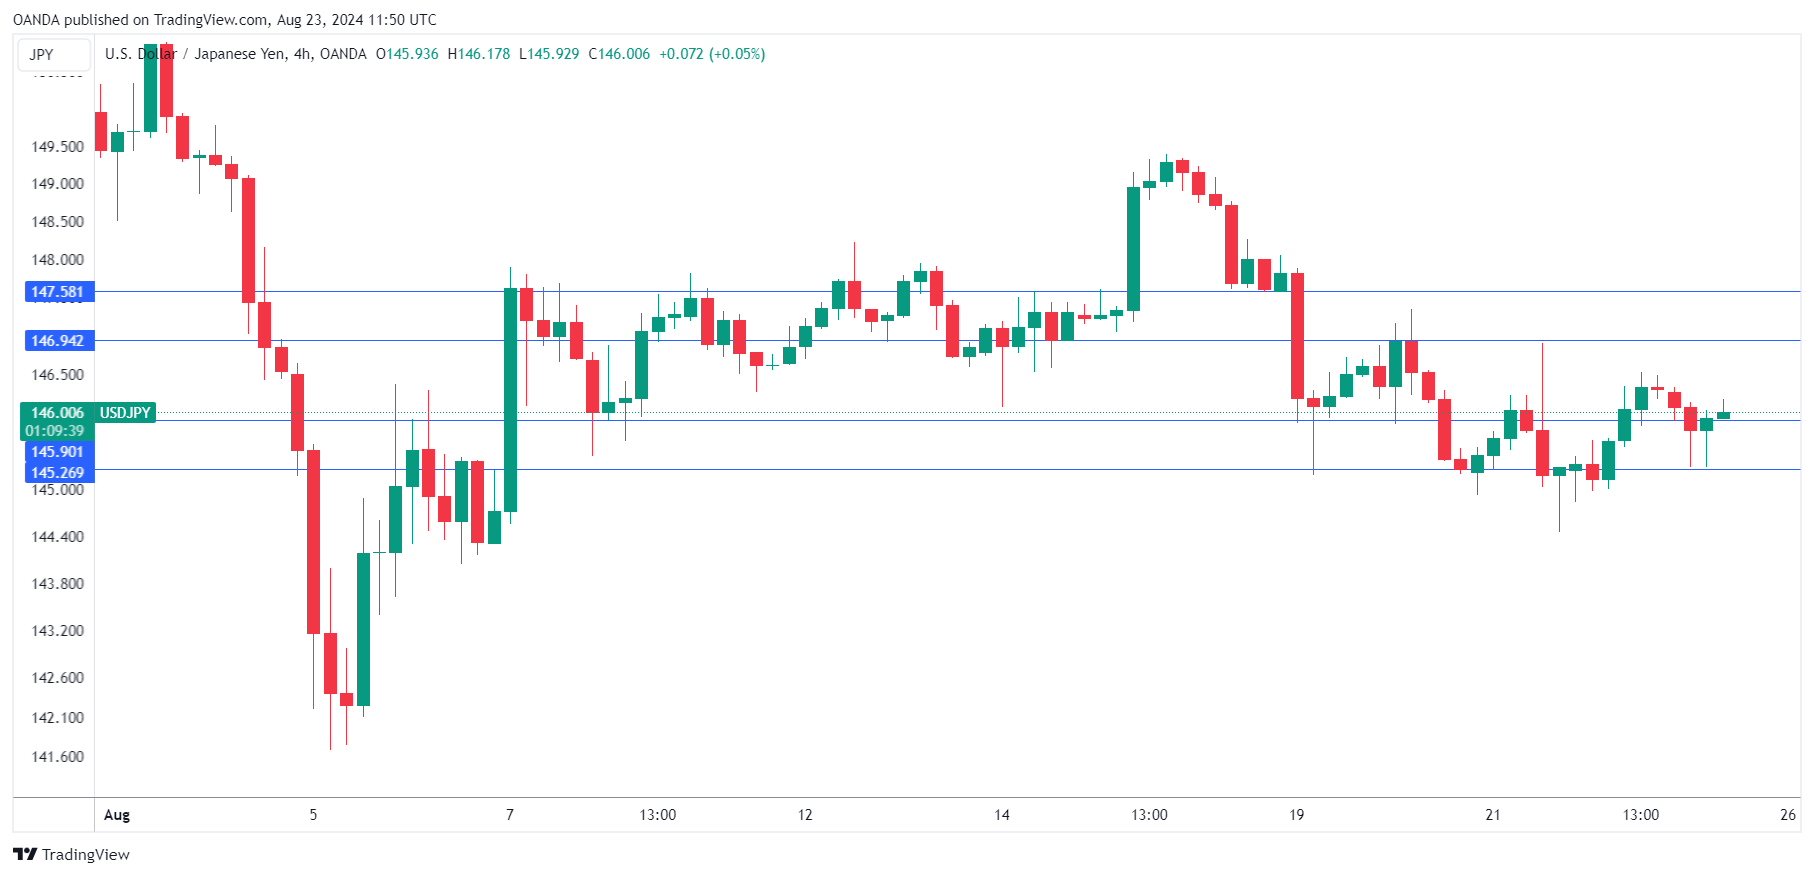
The Japanese yen is in positive territory on Friday. In the European session, USD/JPY is trading at 146.06, down 0.14% on the day. The yen has looked sharp this week, gaining 1% against the struggling US dollar.
Japan’s Core CPI rises to 2.7%
Japan’s core CPI rose 2.7% in July, up for 2.6% in June and in line with market expectations. The gain was largely driven by a rise in electricity prices after utility subsidies were removed. This marked a third straight acceleration and was the highest reading since February.
Japan finds itself as an outlier among the major economies as inflation is moving higher and the Bank of Japan is planning to hike interest rates. The BoJ raised rates into positive territory in Mach but rates are still close to zero. The BoJ has signaled that its plans to continue moving towards normalization and Governor Ueda reiterated that stance on Friday in a speech in parliament.
Ueda said that the BoJ would raise rates if the economy and prices stay in line with forecasts. Ueda added a note of caution, saying that the BoJ was carefully monitoring the impact of the turmoil in the financial markets on inflation. The BoJ is widely expected to maintain rates at the September meeting but we could see a hike in December.
All eyes on Mr. Powell
The annual Jackson Hole meeting is an opportunity for central bankers to discuss rate policy and provide some clues to the eager markets. There is little doubt that the Federal Reserve will cut rates next month, which means that Powell’s speech later today may not provide any dramatic insights. The markets will be closely monitoring Powell’s tone and any comments about inflation and employment. The Fed has largely won the battle with inflation but there are fresh concerns that the employment picture is darkening, which could push the Fed to keep cutting before the end of the year.
USD/JPY Technical
- There is resistance at 146.94 and 147.58
- USD/JPY is testing support at 145.90. Below, there is support at 145.26
GBPUSD: Bullish Extension or Deeper Correction? Key Liquidity Zones
Bearish Corrective Scenario: Sell positions below 1.3130 with TP1 at 1.3103. Consider TP2: 1.3090, TP3: 1.3076, and TP4: 1.3057 only after a decisive break. Use a stop-loss (S.L.) above 1.3160 or at least 1% of account equity for intraday trades.
Bullish Scenario: Buy positions after a pullback (with prior PAR* formation) above 1.3103 with TP1: 1.3142, TP2: 1.3160, and TP3: 1.3172 on extension. Use a stop-loss below 1.3088 or at least 1% of account equity. Apply a trailing stop.
Fundamental Analysis:
The British pound (GBP) remains near its yearly high of 1.3130 against the dollar (USD), buoyed by ongoing optimism from a rise in UK consumer confidence according to the GfK index. Additionally, the Bank of England's expectations of potential rate adjustments following Andrew Bailey’s speech further support the bullish trend.
However, the recent strengthening of the dollar, driven by a rebound in bond yields and anticipation ahead of Jerome Powell's Jackson Hole address, limits further gains for the pound. Depending on central bank remarks, this context heightens volatility and could trigger short-term pullbacks.
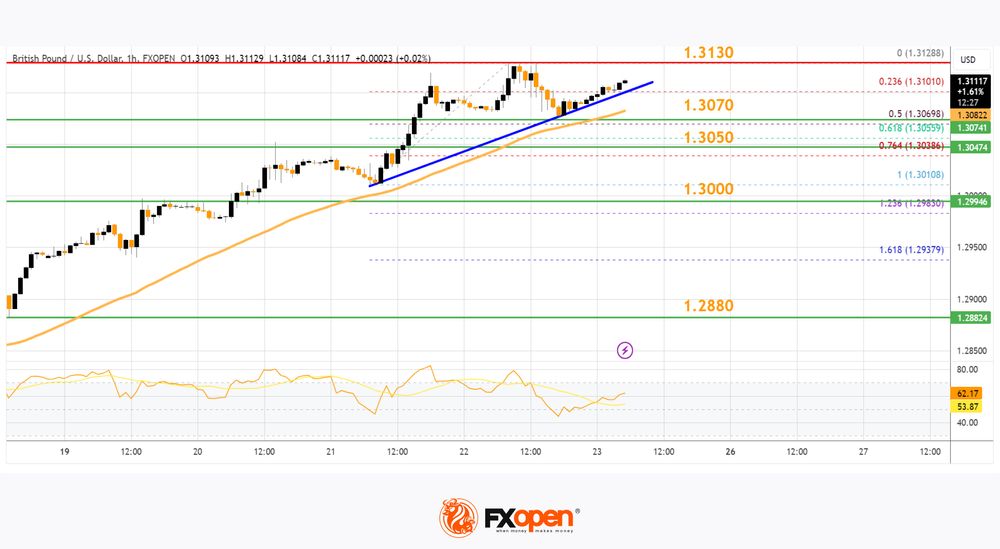
Technical Analysis
GBPUSD, H2
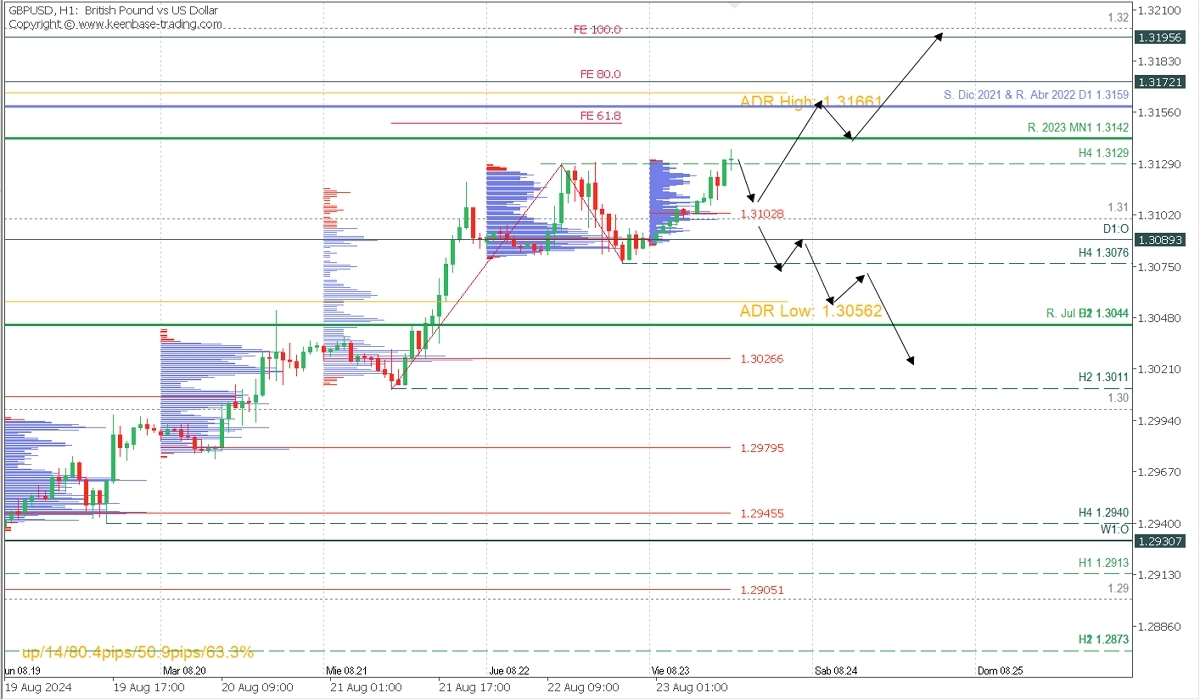
- Supply Zones (Sells): 1.3160
- Demand Zones (Buys): 1.3102, 1.3026
The pair hit 2024 highs after breaking the July resistance at 1.3044, aiming to surpass the 2023 resistance at 1.3142 toward 1.3159 (a macro sell zone that was the broken support from December 2021 and resistance in April 2022) and potentially 1.32.
To extend gains toward these levels, the pair must stay above the last intraday demand zone between today’s Asian POC at 1.3102 and yesterday’s volume concentration near today’s opening at 1.3089.
If the subsequent rise reaches and exceeds the 80% and 100% Fibonacci extensions, the 1.3076 level will be validated as the last significant intraday point of the uptrend.
However, under the current scenario, if the price fails to decisively break Thursday's resistance at 1.3129 and sellers push decisively below the nearest demand zone (between the Asian POC at 1.3102 and yesterday's volume concentration near 1.3090), a broader correction would be confirmed, with further targets at 1.3056, 1.3044, and possibly the uncovered POC* at 1.3026.
The bullish bias remains intact as long as the last significant support of the uptrend at 1.3011 holds. A decisive break of this level, confirmed with a second lower low, would trigger an intraday bearish reversal.
Note:
*Uncovered POC: The Point of Control (POC) is the level or zone with the highest volume concentration. If a downward movement originated from this point, it is considered a sell zone and forms resistance. Conversely, if it led to an upward movement, it is a buy zone, often forming support levels.
Gold Outlook: Near Term Tone Firmed Ahead of Key Event – Powell’s Speech in Jackson Hole
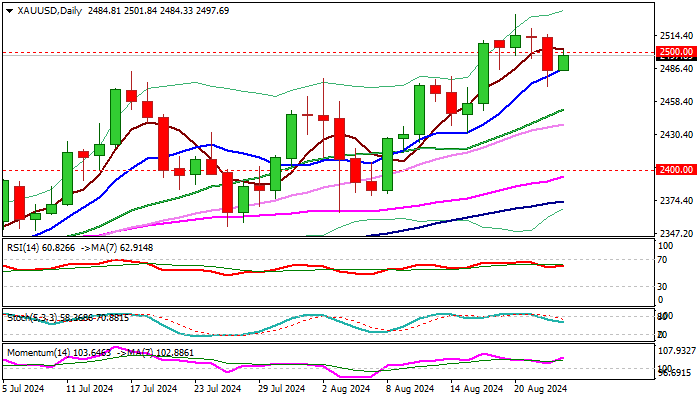
Gold regained traction and bounced on Friday, reversing so far around a half on Thursday’s 1.1% drop, which broke and closed below psychological $2500 level.
Top of the former range at $2480 zone performed as solid support and contained dip, which also closed above rising 10DMA, adding to idea that deeper pullback was just positioning for fresh push higher.
Fresh gains cracked $2500, with daily close above to signal that bulls regained full control after a short-lived dip.
Daily studies are in full bullish setup and contribute to overall bullish picture, as the yellow metal recently hit a series of new record highs, boosted by growing expectations that the Fed will start cutting interest rates from September, geopolitical tensions and uncertainty over the US economic outlook.
All eyes are on Fed Chair Powell, who will deliver the speech in Jackson Hole symposium of central bankers later today, with wide expectations that he will confirm signals for September rate cut and provide more details about the depth and pace of policy tightening.
Dovish narrative, in line or above expectations to likely offer fresh boost to the metal and push price again into uncharted territory.
Violation of fresh all time high ($2531) to expose projections at $2547, $2564 and $2590).
On the other hand, any surprise from Powell, which cannot be completely ruled out as the Fed needs to consider several key factors (the timing and size of rate cut or no rate cut this time, consequences of each decision on the economy which is highly vulnerable and my slow further in an inappropriate and not finely balanced Fed decision) before making the final cut.
Gold price would come under fresh pressure in such scenario and probably enter deeper correction.
Res: 2509; 2519; 2531; 2547.
Sup: 2486; 2480; 2470; 2451.
AUD/USD Sees Rebound: Weak US Dollar and RBA’s Steady Stance Support Strength
AUD/USD is finding its footing, currently stabilising at around 0.6725, as the US dollar weakens further in anticipation of Fed Chair Jerome Powell's speech at the Jackson Hole symposium. Investors are watching closely for cues on future policy shifts, influencing forex forecasts.
The Australian dollar's resilience is bolstered by the minutes from the Reserve Bank of Australia's latest meeting, indicating that the central bank is not in a hurry to ease monetary policy despite a slowdown in inflation. The RBA remains cautious, projecting inflation to stay above its 2-3% target range until the end of 2025. This suggests that interest rates may remain steady for an extended period, providing a stable backdrop for the Australian dollar.
Recent data highlights robust performance in Australia's private sector for August, particularly in services, while the contraction in manufacturing is easing. This paints a picture of an Australian economy that is adjusting well and could sustain its momentum without immediate monetary stimulus.
Technical analysis of AUD/USD
The AUD/USD pair recently peaked at 0.6760 but is now poised for a correction. The immediate focus is on a potential descent to 0.6684, marking the first significant support level. Upon reaching this target, a retest of 0.6725 from below may occur, defining the boundaries of a possible consolidation range. A break below this consolidation could initiate a further decline towards 0.6600, potentially extending to 0.6555. The MACD indicator supports a bearish outlook in the short term, with the signal line peaking and poised for a downward trajectory.
In the hourly frame, AUD/USD has retraced from a recent low of 0.6696 to 0.6725, indicating a corrective phase. The anticipated continuation of this downtrend could see the pair targeting 0.6686 shortly. If this support holds, a rebound to 0.6725 could follow. The Stochastic oscillator indicates an overbought condition, with the signal line expected to move downwards from 80 to 20, supporting the potential for further declines.
US 100 Index Sits at Key Level
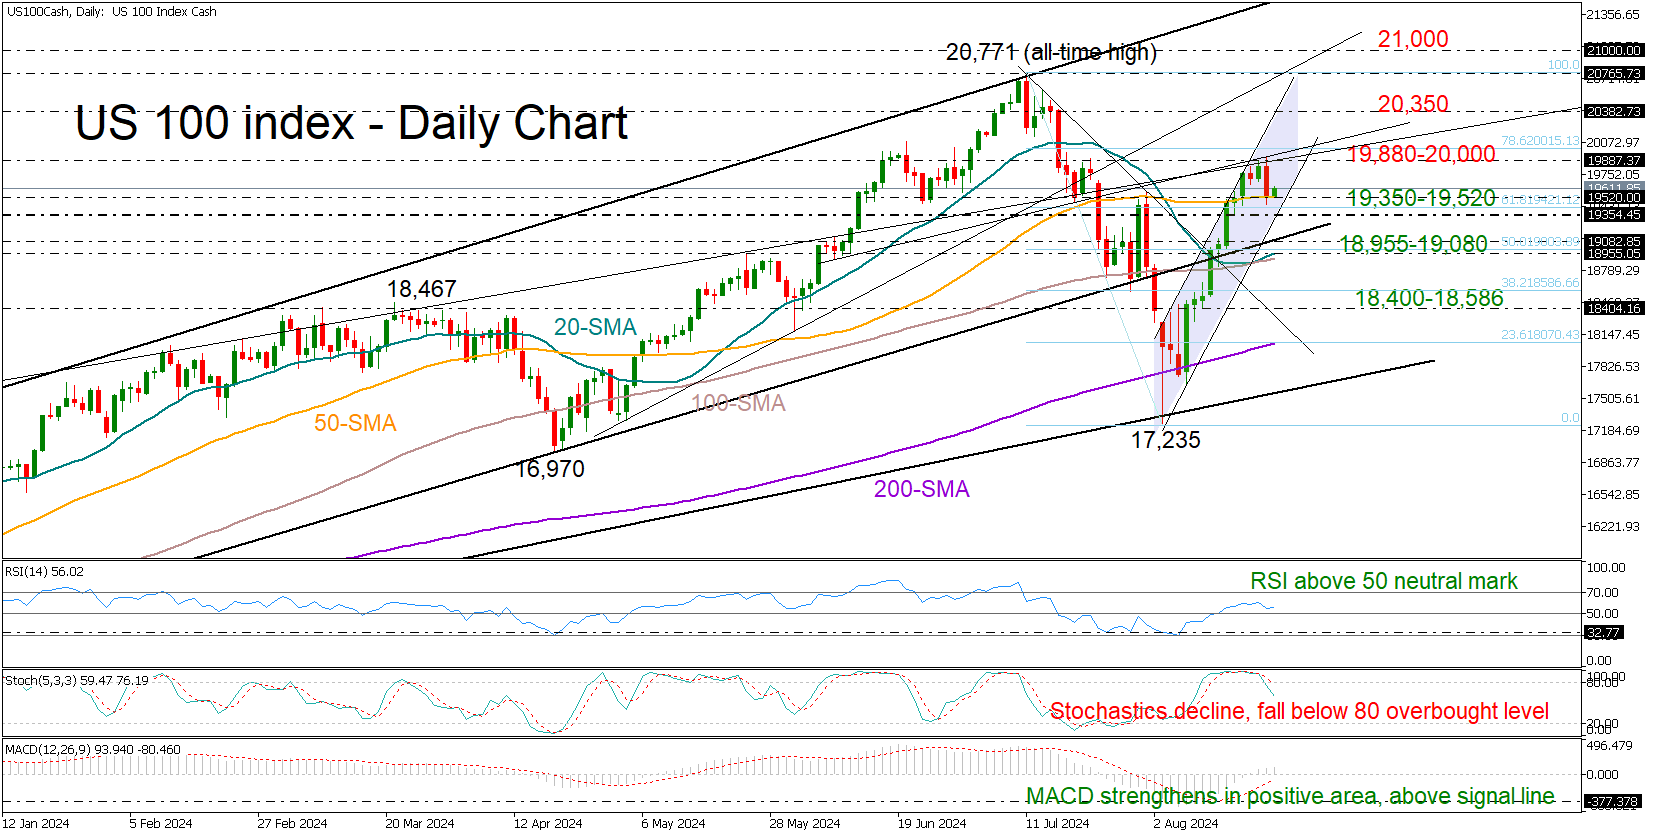
- US 100 index exhibits bearish tendencies but stabilizes near 50-SMA
- Technical risk is two-sided as Powell prepares for his Jackson hole speech( 14:00 GMT)
- Bulls hope for a close above 19,880; bears need a drop below 19,350
The US 100 stock index came under pressure on Thursday after a downward revision in the US non-farm payrolls revived fears of a slowing US economy.
Fortunately, the 50-day simple moving average (SMA) prevented a further decline below 19,520, but the clear bearish engulfing candlestick pattern created at the top of the latest bullish wave both in the daily and four-hour charts warns that the selling wave might have more room to run.
Meanwhile the technical indicators have not confirmed a bearish bias yet. The RSI remains comfortably above its 50 neutral mark and the MACD continues to rise within the positive region, questioning the overbought signals coming from the stochastic oscillator.
Nevertheless, if sellers drive the price below the 50-day SMA, they may instantly reach the channel’s lower boundary seen at 19,350. A steeper decline below the formation could cease somewhere between the support trendline from October at 19,080 and the 20-day SMA at 18,955. If this floor cracks as well, the index could crash into the 18,400-18,586 zone.
Otherwise, should the index set a strong footing near its 50-day SMA, the bulls might again fight for a close above the 19,880-20,000 region. A successful break higher could pick up steam towards the channel’s upper band near 20,350, and then up to the all-time high of 20,771. The next mission could target the 21,000 psychological mark in the uncharted territory.
In brief, the US 100 index is in a state of neutrality and is looking for a new direction either below 19,350 or above 19,880.
Analysis of GBP/USD: The Pair Approaches 2023 High
Yesterday, the Purchasing Managers' Index (PMI) data for both the UK and the US were released.
According to ForexFactory, the UK figures were as follows:
→ Flash Manufacturing PMI: actual = 52.5, forecast = 52.1; previous = 52.1;
→ Flash Services PMI: actual = 53.3, forecast = 52.8; previous = 52.5.
As SPGlobal reports, the August PMI data signalled another significant expansion (the largest since April) in the UK's private sector output, supported by strong growth in new orders.
In contrast, the US figures were less encouraging:
→ Flash Manufacturing PMI: actual = 48.0, forecast = 49.5; previous = 49.6;
→ Flash Services PMI: actual = 55.2, forecast = 54.0; previous = 55.0.
In response to yesterday’s PMI releases, the GBP/USD rate has been climbing this morning towards the 2023 high around the 1.3140 level. Notably:
→ Since the August low, the pair has risen by over 3.5%;
→ A key driver of bullish sentiment for GBP/USD is the weakness of the US dollar, driven by expectations of a Fed rate cut in September.
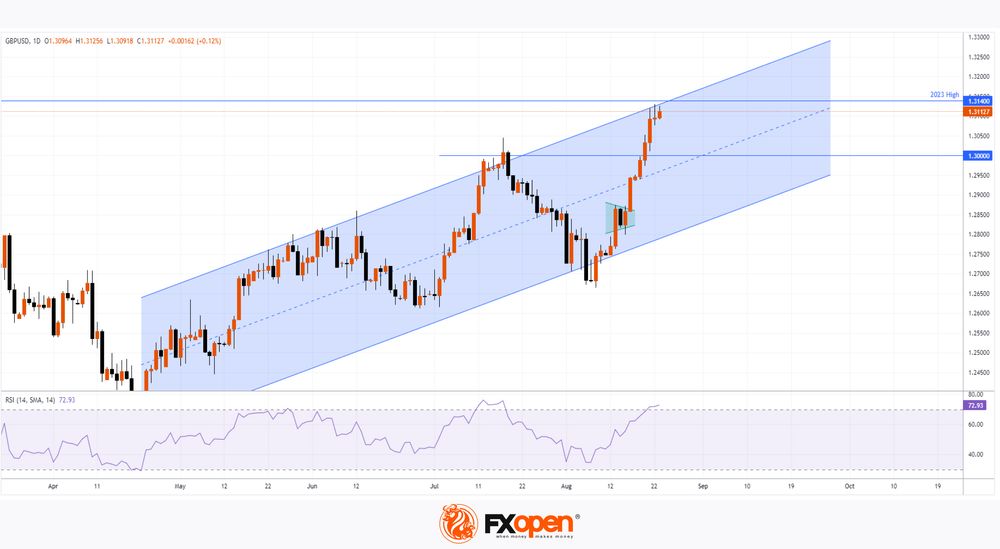
Technical analysis of the GBP/USD daily chart today shows:
→ The price has broken upwards out of the consolidation triangle (which we mentioned on 15 August) and confidently surpassed the psychological barrier at 1.3000;
→ The RSI indicator has entered overbought territory;
→ The last few daily candles show long upper shadows, indicating increased selling activity;
→ The upper boundary of the ascending channel (shown in blue) could act as resistance.
Given these factors, it is reasonable to suggest that the rally might be losing momentum, and even if the bulls manage to challenge the 2023 high, it could potentially result in a bull trap.
Trade over 50 forex markets 24 hours a day with FXOpen. Take advantage of low commissions, deep liquidity, and spreads from 0.0 pips. Open your FXOpen account now or learn more about trading forex with FXOpen.
This article represents the opinion of the Companies operating under the FXOpen brand only. It is not to be construed as an offer, solicitation, or recommendation with respect to products and services provided by the Companies operating under the FXOpen brand, nor is it to be considered financial advice.
Market Analysis: GBP/USD Surges, USD/CAD Drops To Support
GBP/USD started a fresh increase above the 1.2920 zone. USD/CAD declined and now consolidates below the 1.3640 level.
Important Takeaways for GBP/USD and USD/CAD Analysis Today
- The British Pound is eyeing more gains above the 1.3130 resistance.
- There is a connecting bullish trend line forming with support near 1.3100 on the hourly chart of GBP/USD at FXOpen.
- USD/CAD started a fresh decline after it failed to clear the 1.3720 resistance.
- Recently, there was a break above a short-term bearish trend line with resistance at 1.3585 on the hourly chart at FXOpen.
GBP/USD Technical Analysis
On the hourly chart of GBP/USD at FXOpen, the pair formed a base above the 1.2880 level. The British Pound started a steady increase above the 1.2920 resistance zone against the US Dollar.
The pair gained strength above the 1.3000 level. The bulls even pushed the pair above the 1.3050 level and the 50-hour simple moving average. The pair tested the 1.3130 zone and is currently consolidating gains.
There was a minor decline below the 1.3100 level. The pair dipped below the 23.6% Fib retracement level of the upward move from the 1.3010 swing low to the 1.3128 high.
However, the bulls remained active near the 1.3070 level. There is also a connecting bullish trend line forming with support near 1.3100. If there is another decline, the pair could find support near the 1.3070 level.
The first major support sits at the 76.4% Fib retracement level of the upward move from the 1.3010 swing low to the 1.3128 high at 1.3050. The next major support is 1.3000.
If there is a break below 1.3000, the pair could extend the decline. The next key support is near the 1.2880 level. Any more losses might call for a test of the 1.2650 support.
Conversely, the bulls might aim for more gains. The RSI moved above the 60 level on the GBP/USD chart and the pair is now approaching a major hurdle at 1.3130. An upside break above the 1.3130 zone could send the pair toward 1.3200. Any more gains might open the doors for a test of 1.3250.
USD/CAD Technical Analysis
On the hourly chart of USD/CAD at FXOpen, the pair climbed toward the 1.3700 resistance zone before the bears appeared. The US Dollar formed a swing high near 1.3685 and recently declined below the 1.3640 support against the Canadian Dollar.
There was also a close below the 50-hour simple moving average and 1.3620. The bulls are now active near the 1.3570 level. Recently, the pair corrected some losses and climbed above the 1.3600 zone.
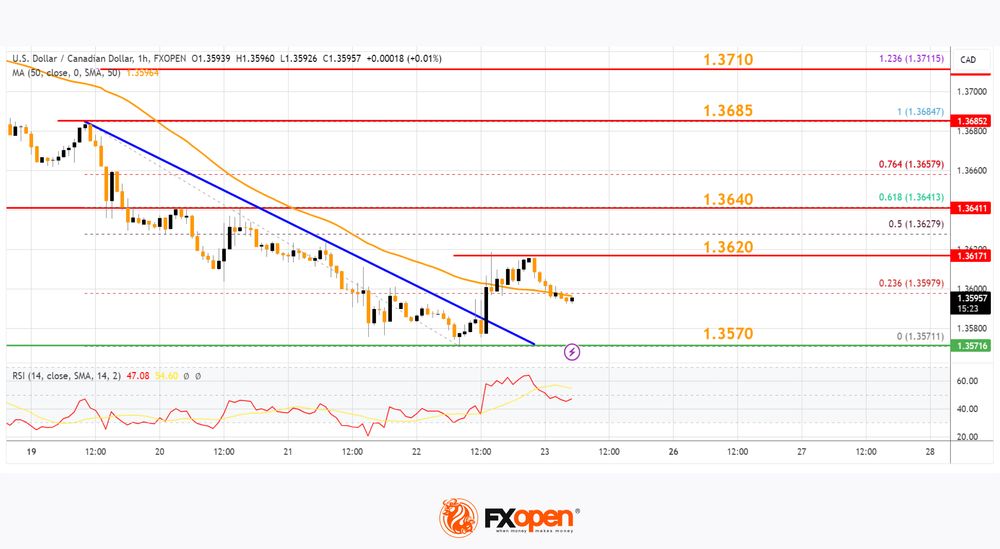
There was a break above a short-term bearish trend line with resistance at 1.3585. The pair even surpassed the 23.6% Fib retracement level of the downward move from the 1.3685 swing high to the 1.3571 low.
If there is a fresh increase, the pair could face resistance near the 1.3620 level. The next key resistance on the USD/CAD chart is near the 61.8% Fib retracement level of the downward move from the 1.3685 swing high to the 1.3571 low is 1.3640.
If there is an upside break above 1.3640, the pair could rise toward the 1.3685 resistance. The next major resistance is near the 1.3710 level, above which it could rise steadily toward the 1.3800 resistance zone.
Immediate support is near the 1.3570 level. The first major support is near 1.3550. A close below the 1.3550 level might trigger a strong decline. In the stated case, USD/CAD might test 1.3500. Any more losses may possibly open the doors for a drop toward the 1.3450 support.
Read analytical USD/CAD price forecasts for 2024 and beyond.
Trade over 50 forex markets 24 hours a day with FXOpen. Take advantage of low commissions, deep liquidity, and spreads from 0.0 pips. Open your FXOpen account now or learn more about trading forex with FXOpen.
This article represents the opinion of the Companies operating under the FXOpen brand only. It is not to be construed as an offer, solicitation, or recommendation with respect to products and services provided by the Companies operating under the FXOpen brand, nor is it to be considered financial advice.