
Sample Category Title
USDCAD Still Fights With 1.3600
- USDCAD repeatedly tests the 200-day SMA
- Momentum oscillators are mixed
USDCAD has been battling with the 1.3600 round number and the 200-day simple moving average (SMA) over the last couple of days. A successful break beneath these critical levels could open the way for a downside retracement in the medium-term.
The technical oscillators are showing some contradictory signs. The stochastic is heading upwards after the bullish crossover within the %K and %D lines in the oversold area; however, the RSI is sloping down near the 30 level.
Steeper decreases could drive the bears to the 1.3480 support ahead of the 1.3450 barricade and 1.3420, taken from the lows between March and April.
A potential rebound off 1.3600 may increase optimism to traders increase optimism amongst traders, encouraging them to remain in a neutral-to-bullish mode, hitting the 50- and 20-day SMAs at 1.3710 and 1.3730, respectively. Moving up, the 1.3790 resistance may again act as a turning point.
All in all, USDCAD is hovering near key levels, and the next few sessions could clear up the market's next direction.
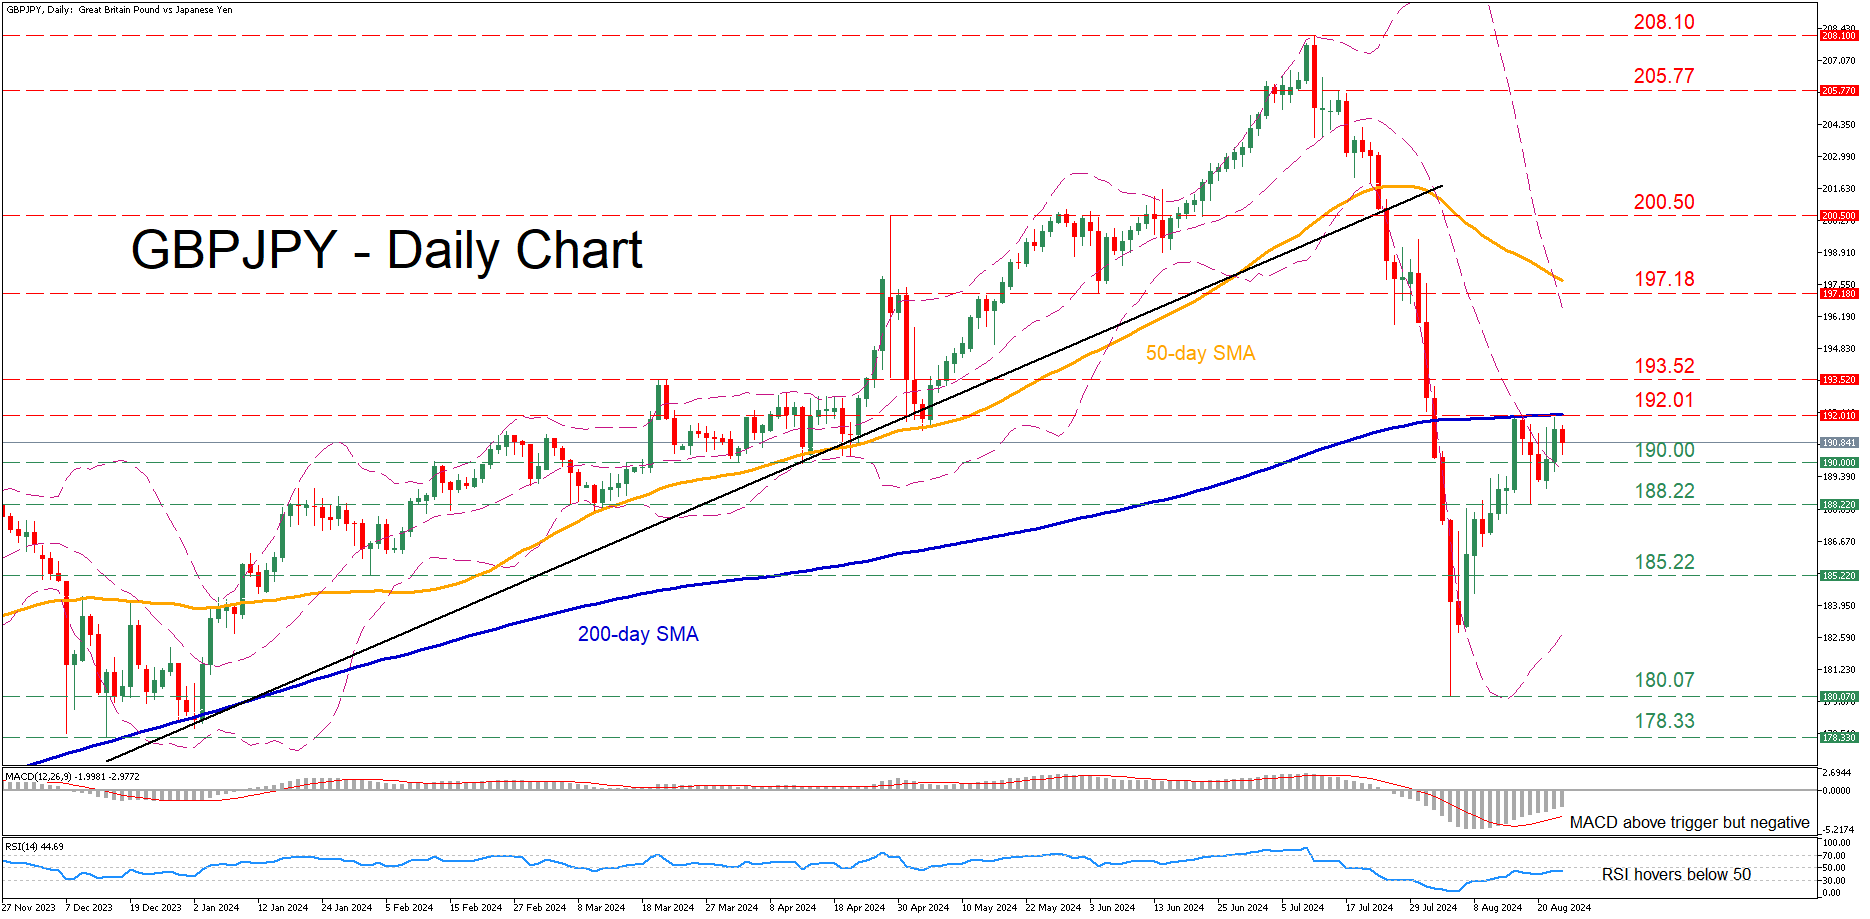
GBPJPY’s Recovery Stalls at 200-day SMA
- GBPJPY attempts to recover from recent 8-month low
- But the rebound falters after testing 200-day SMA
- RSI and MACD remain tilted to the bearish side
GBPJPY experienced a vast selloff in July, dropping from a 16-year peak of 208.10 to as low as 180.07 on August 5, which is also an eight-month low. Since then, the pair has been in a recovery mode, but its rebound seems to have paused for now at the 200-day simple moving average (SMA).
Should the bears attempt to erase the latest uptick, the April support of 190.00 could prove to be the first obstacle for them to overcome. Further declines may then cease at the recent support of 188.22 ahead of the February low of 185.22. Failing to halt there, the price may descend towards the eight-month low of 180.07.
Alternatively, if the rebound resumes, initial resistance could be found at the recent rejection region of 192.01, which overlaps with the 200-day SMA. A break above that zone could open the door for the March peak of 193.52. Conquering this barricade, the bulls might attack the June support of 197.18, which could serve as resistance in the future.
In brief, GBPJPY has been attempting to erase its recent slump, but its efforts have met strong resistance at the 200-day SMA. Hence, a break above that crucial hurdle is needed for the bulls to regain confidence for a full-scale recovery.
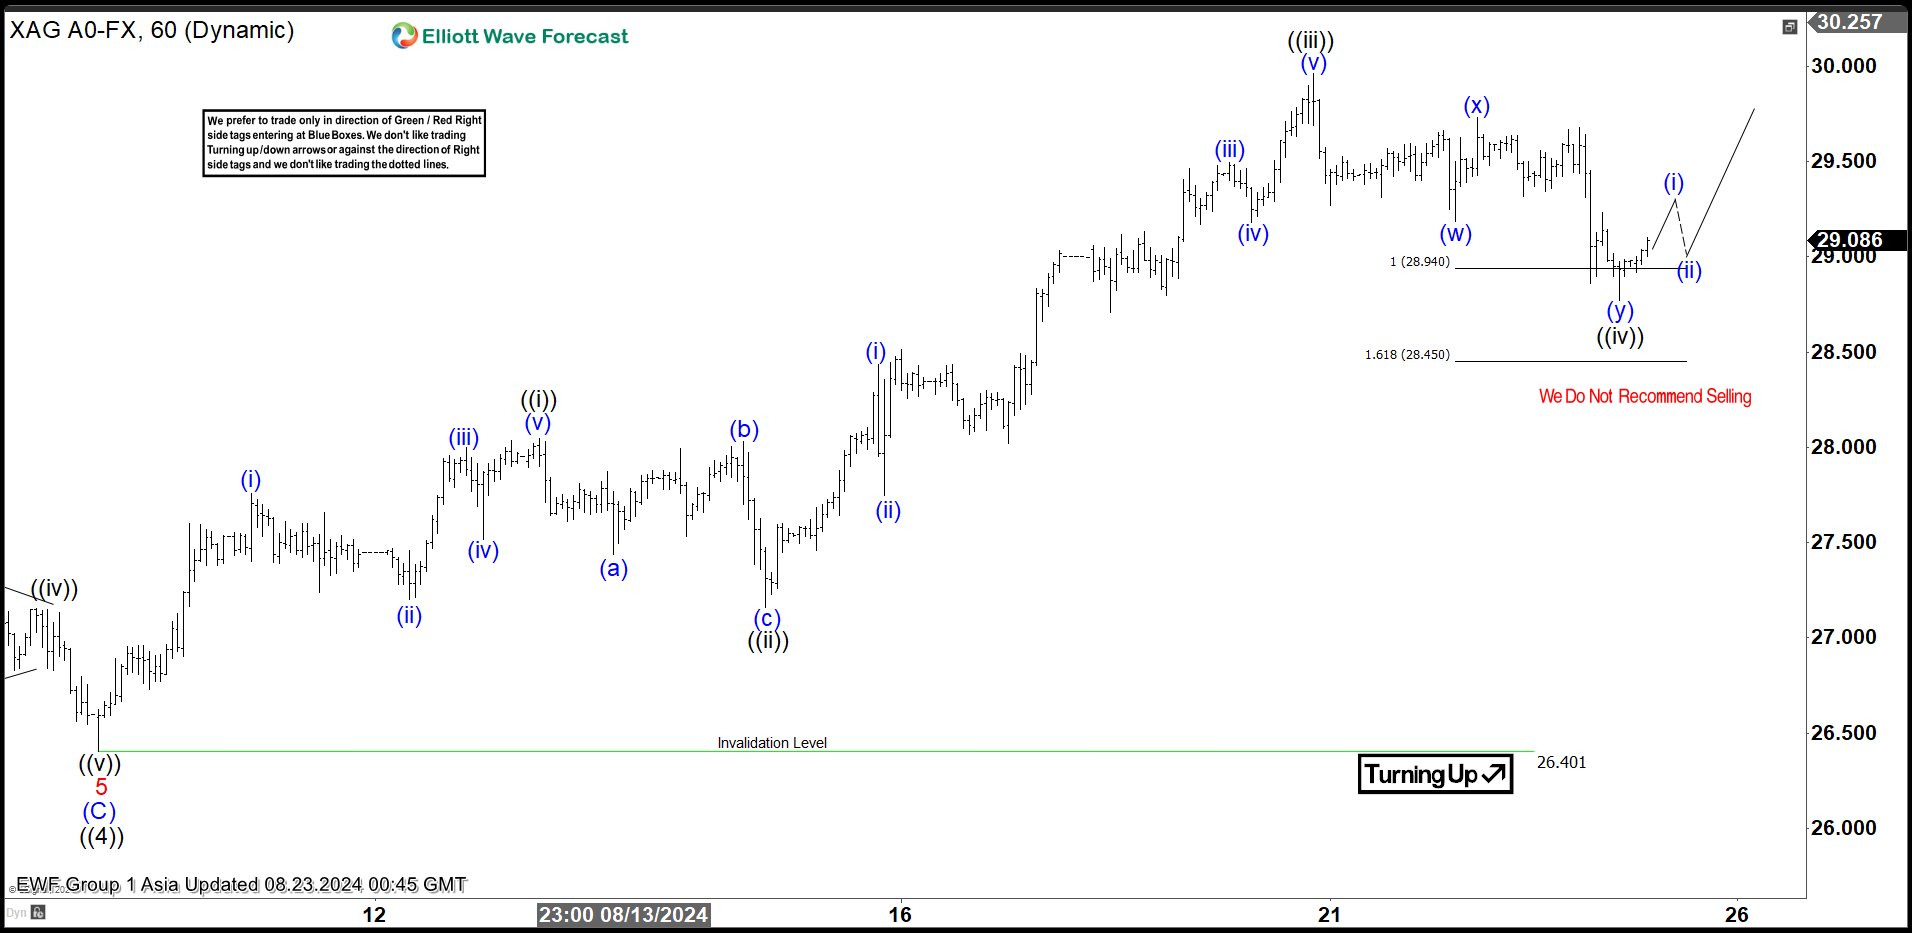
Elliott Wave Favors Bullish Bias in Silver (XAGUSD)
Short Term Elliott Wave in Silver suggests that rally to 5.20.2024 high at 32.51 ended wave ((3)). Pullback in wave ((4)) ended at 26.4 as the 1 hour chart below shows. The metal has turned higher in wave ((5)), but it still needs to break above wave ((3)) at 32.51 to rule out a bigger double correction. Up from wave ((4)), wave (i) ended at 27.74 and wave (ii) dips ended at 27.2. Wave (iii) higher ended at 28, pullback in wave (iv) ended at 27.51. Final leg wave (v) ended at 28.04 which completed wave ((i)) in higher degree.
Pullback in wave ((ii)) ended at 27.16 with internal subdivision as a zigzag structure. Down from wave ((i)), wave (a) ended at 27.43 and wave (b) ended at 28.03. Wave (c) lower ended at 27.16 which completed wave ((ii)). The metal then resumed higher in wave ((iii)). Up from wave ((ii)), wave (i) ended at 28.43 and wave (ii) pullback ended at 27.74. The metal extended higher in wave (iii) towards 29.49 and dips in wave (iv) ended at 29.18. Final leg wave (v) ended at 29.96 which completed wave ((iii)) in higher degree.
Pullback in wave ((iv)) unfolded as a double three Elliott Wave structure. Down from wave ((iii)), wave (w) ended at 29.19 and wave (x) ended at 29.73. Wave (y) lower ended at 28.77 which completed wave ((iv)). Near term, as far as pivot at 26.4 low stays intact, expect pullback to find support in 3, 7, or 11 swing for further upside.
Silver (XAGUSD) 60 Minutes Elliott Wave Chart
XAGUSD Elliott Wave Video
https://www.youtube.com/watch?v=2fAg11L1h9Y
Markets Dynamics Could be at a Short Term Tipping Point
Markets
Yesterday’s EMU data releases cement the case for a second 25 bps rate cut by the ECB when they meet next on September 12. PMI’s picked up because of the 2024 Paris Olympics (French services), but that was only the tip of the iceberg. The manufacturing sector remains mired in recession. New orders fell on an aggregate level and input price pressure (unlike output prices) is waning. The latter was also confirmed by the central bank’s Q2 wage data which showed negotiated pay rising by 3.6% from a year ago in Q2 (from 4.7% in Q1 and the slowest pace since Q4 2022). Minutes of the July ECB meeting confirmed that the central bank would re-evaluate things in September. The figures had little market impact given that a 25 bps September ECB rate cut was already discounted.
Markets dynamics could be at a short term tipping point. It was actually already visible in long term bonds on Wednesday following the BLS payrolls revision and the release of soft FOMC Minutes. They still managed to pull short term US bond yields and the dollar lower, but longer term bond yields hit a floor/support levels. Short term Treasuries succumbed yesterday with the 2-yr yield adding 6 bps. The dollar got some breathing space (EUR/USD 1.1112) while US stock markets corrected up to 1.5% after their astonishing comeback rally the past fortnight. It points to some cautiousness going into this week’s main event, Fed Chair Powell’s speech at the Kansas City Fed’s Jackson Hole symposium. We expect Powell to give the final go ahead for a September rate cut, but simultaneously stress the need for gradualism. It’s been the buzz word throughout Fed speeches this month. It suggests a traditional 25 bps start to the cutting cycle contrary to the 50 bps some are hoping/betting on. It might mean as well that the updated dot plot won’t be as aggressive for this year and especially next as markets are currently positioned for. Apart from straightforward clues on the timing, pace and size of rate cuts, it will be interesting to learn how much additional weight the Fed chair gives to the maximum employment part of the mandate compared to the price stability. Such “gradualism” scenario could trigger a short term exhaustion move in USD and US rates or even an outright buy-the-rumour, sell-the-fact reaction going into the weekend. We’re not enticed to call it the final bottom yet as easing bets could rapidly return early September in case of disappointing ISM’s and/or payrolls. Apart from Powell’s speech, we keep an eye on first public comments by BoE governor Bailey since the August 1 rate cut. Sterling yesterday outperformed on stronger PMI data with EUR/GBP returning below 0.85 for the first time since the early August market meltdown.
News & Views
Japanese national inflation data were in line with expectations, but showed a slightly mixed picture for monetary policy. Inflation excluding fresh food rose 2.7% in July from 2.6% in June. Overall headline inflation printed unchanged at 2.8%, well above the BOJ’s 2% target. However, the ‘core-core measure’ excluding fresh food and energy dropped to 1.9% from 2.2%. The indicator strips out a sharp rise in utility bills as the government phased out support to mitigate energy bills. Services price inflation also eased from 1.7% to 1.4%. Both factors might be a reason for the BoJ to take a rather gradual approach as it started the process of policy normalization. The recent rise in the yen also might mitigate imported inflation going forward. In a hearing before Parliament this morning, BoJ Governor Ueda reiterated that the BoJ intends to further raise the interest rates if inflation stays on course to sustainably hold the 2% target. At the same time, the BoJ will be vigilant to market developments/volatility for the time being. The yen strengthens slightly this morning (USD/JPY 145.6).
UK consumer confidence as measured by GfK was reported unchanged at -13, the highest level in almost three years. A slight further improvement to -12 was expected. UK consumers become more optimistic on their personal finances (last 12 months and expected next 12 months). They also turned more positive on the climate for major purchases (-13 from -16). Savings intentions rose (33 from 27) but consumers turned slightly more cautious on the overall economic situation (both past and future) . After a stronger than expected UK PMI yesterday (composite 53.4 from 52.8) sterling yesterday strengthened below the EUR/GBP 0.85 support.
Graphs
GE 10y yield
The ECB cut policy rates by 25 bps in June. Stubborn inflation (core, services) make follow-up moves less evident. Markets nevertheless price in two to three more cuts for 2024 as disappointing US and unconvincing EMU activity data rolled in, dragging the long end of the curve down. The move accelerated during the early August market meltdown.
US 10y yield
The Fed in its July meeting paved the way for a first cut in September. It turned attentive to risks to the both sides of its dual mandate as the economy is continuing to move better in to balance. Money markets tend to err in favour of a 50 bps lift-off. The pivot weakened the technical picture in US yields with another batch of weak eco data pushing the 10-yr sub 4%.
EUR/USD
EUR/USD moved above the 1.09 resistance area as the dollar lost interest rate support at stealth pace. US recession risks and bets on fast and large (50 bps) rate cuts trumped traditional safe haven flows into USD. EUR/USD 1 1.1276 (2023 top) serves as next technical references.
EUR/GBP
The BoE delivered a hawkish cut in August. Policy restrictiveness will be further unwound gradually on a pace determined by a broad range of data. The strategy similar to the ECB’s balances out EUR/GBP in a monetary perspective. Risk-off proved a more important driver of GBP recently, triggering a brief return from 0.84 towards 0.86.
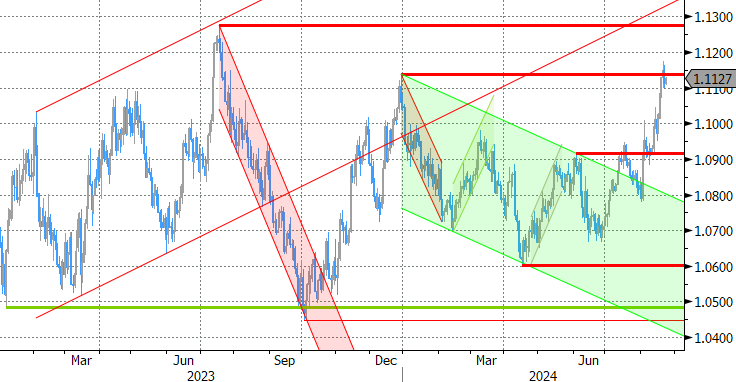
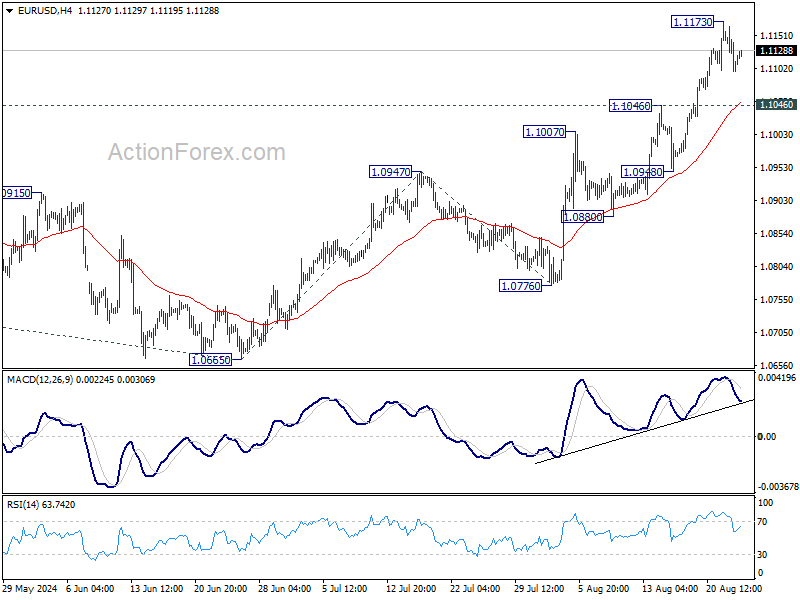
EUR/USD Daily Outlook
Daily Pivots: (S1) 1.1085; (P) 1.1125; (R1) 1.1152; More....
Intraday bias in EUR/USD remains neutral as consolidation continues below 1.1173 temporary top. Further rally is expected as long as 1.1046 resistance turned support holds. Above 1.1173 will target 161.8% projection of 1.0665 to 1.0947 from 1.0776 at 1.1232. However, break of 1.1046 will indicate short term topping and bring deeper pullback towards 1.0947.
In the bigger picture, price actions from 1.1274 are viewed as a corrective pattern that's could still extend. Break of 1.1138 resistance will be the first signal that rise from 0.9534 (2022 low) is ready to resume through 1.1274 (2023 high). Next target is 61.8% projection of 0.9534 to 1.1274 from 1.0665 at 1.1740. However, break of 1.0974 resistance turned support will extend the correction with another falling leg back towards 1.0447 support.
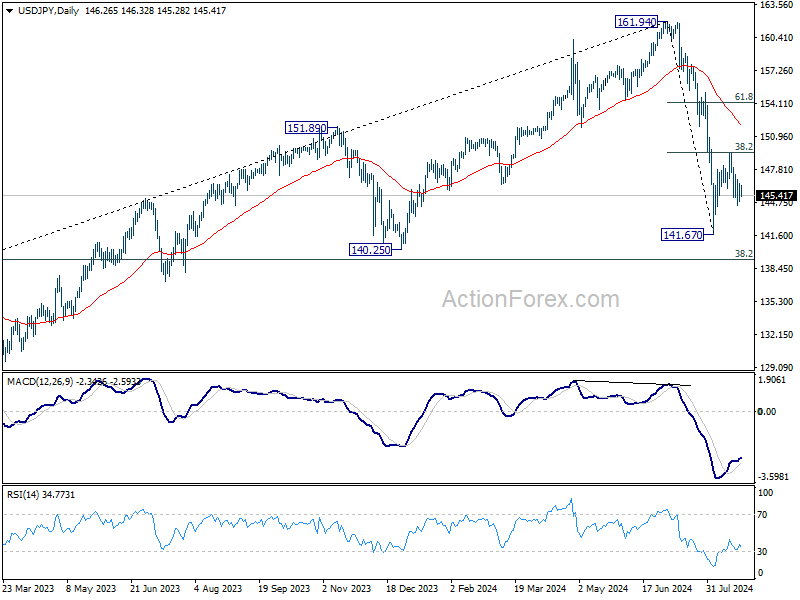
USD/JPY Daily Outlook
Daily Pivots: (S1) 144.19; (P) 145.55; (R1) 146.63; More...
Intraday bias in USD/JPY remains neutral for the moment. On the downside, break of 144.44 temporary low will reaffirm the case that rebound form 141.67 has completed, and bring retest of this low. On the upside, break of 149.35 will resume the rebound to 61.8% retracement of 161.94 to 141.67 at 154.19, as the second leg of the corrective pattern from 161.94 high.
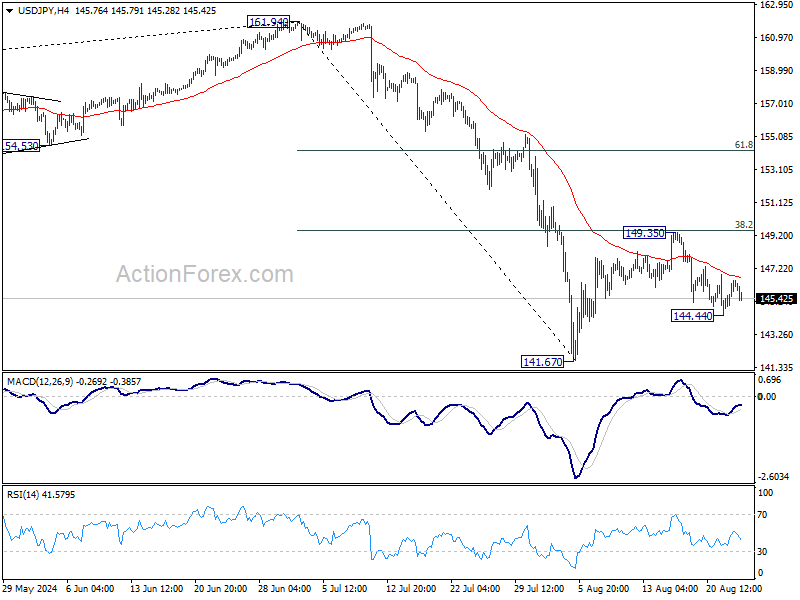
In the bigger picture, fall from 161.94 medium term is seen as correcting whole up trend from 102.58 (2021 low). Deeper decline could be seen to 38.2% retracement of 102.58 to 161.94 at 139.26, which is close to 140.25 support. In any case, risk will stay on the downside as long as 55 W EMA (now at 149.63) holds. Nevertheless, firm break of 55 W EMA will suggest that the range for medium term corrective pattern is already set.
GBP/USD Daily Outlook
Daily Pivots: (S1) 1.3069; (P) 1.3100; (R1) 1.3122; More...
Intraday bias in GBP/USD stays on the upside despite some loss of momentum. Decisive break of 61.8% projection of 1.2298 to 1.3043 from 1.2664 at 1.3124 and 1.3141 resistance will confirm larger up trend resumption for 100% projection at 1.3409. On the downside, below 1.3010 minor support will turn intraday bias neutral and bring consolidations first, before staging another rally.
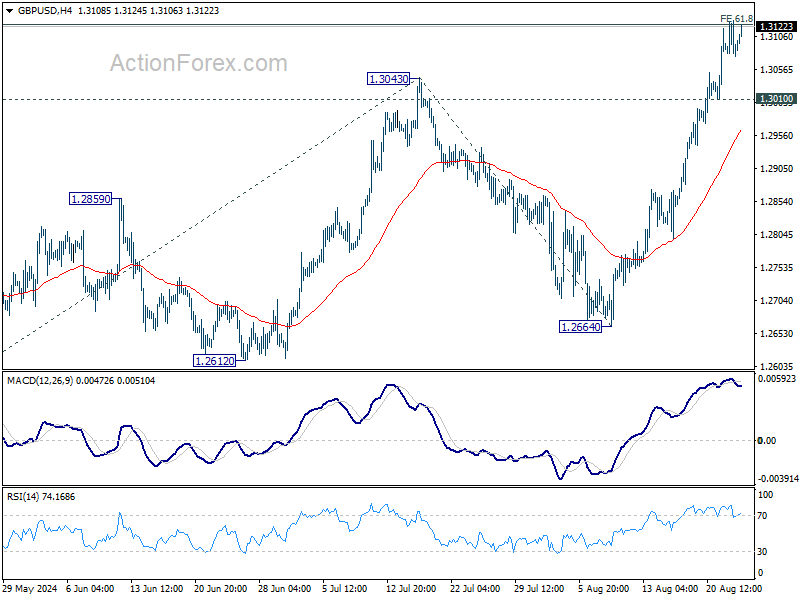
In the bigger picture, corrective pattern from 1.3141 might have completed at 1.2298 already. Rise from there could be resuming the larger up trend from 1.0351 (2022 low). Decisive break of 1.3141 will target 38.2% projection of 1.0351 to 1.3141 from 1.2298 at 1.3364 next. However, break of 1.2664 support will delay this bullish case once again and extend the corrective pattern from 1.3141.

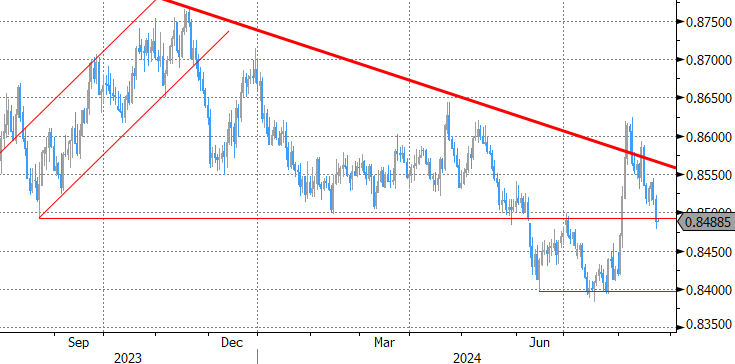
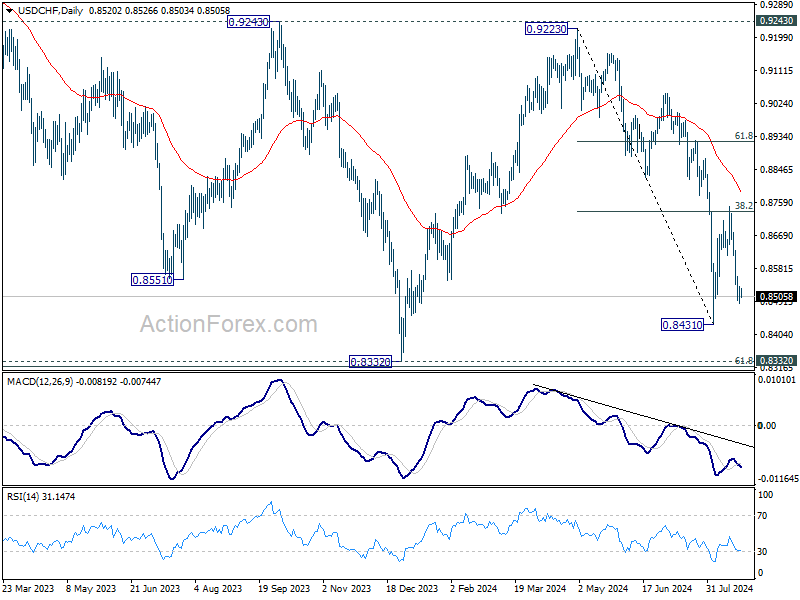
USD/CHF Daily Outlook
Daily Pivots: (S1) 0.8496; (P) 0.8515; (R1) 0.8541; More…..
Intraday bias in USD/CHF stays on the downside despite loss of momentum. Fall from 0.8747 is in progress for retesting 0.8431. Firm break there will resume whole decline from 0.9223 towards 0.8332 low. On the upside, above 0.8560 minor resistance will turn intraday bias neutral first. But risk will stay on the downside as long as 0.8747 resistance holds, in case of recovery.
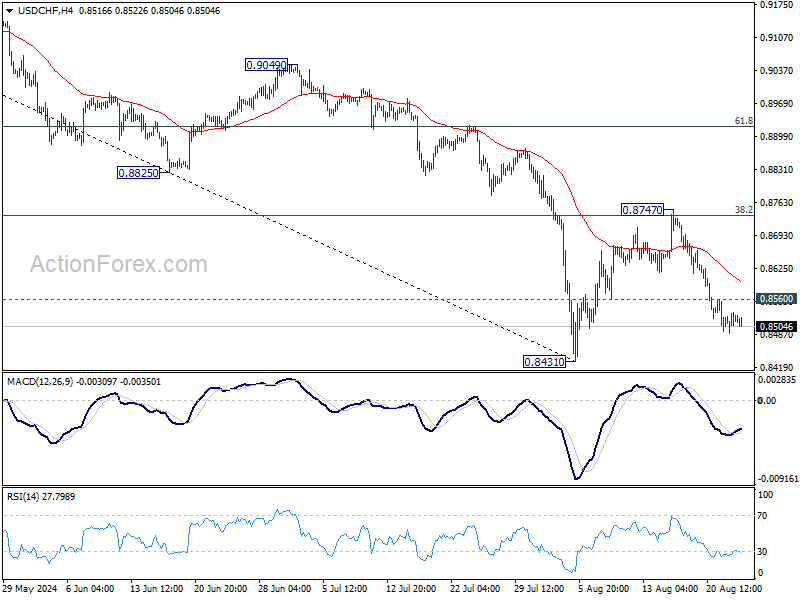
In the bigger picture, price actions from 0.8332 (2023 low) are currently seen as a medium term corrective pattern, with fall from 0.9223 as the second leg. Strong support could be seen from 0.8332 to bring rebound. Yet, overall outlook will continue to stay bearish as long as 0.9243 resistance holds. Firm break of 0.8332, however, will resume larger down trend from 1.0146 (2022 high).
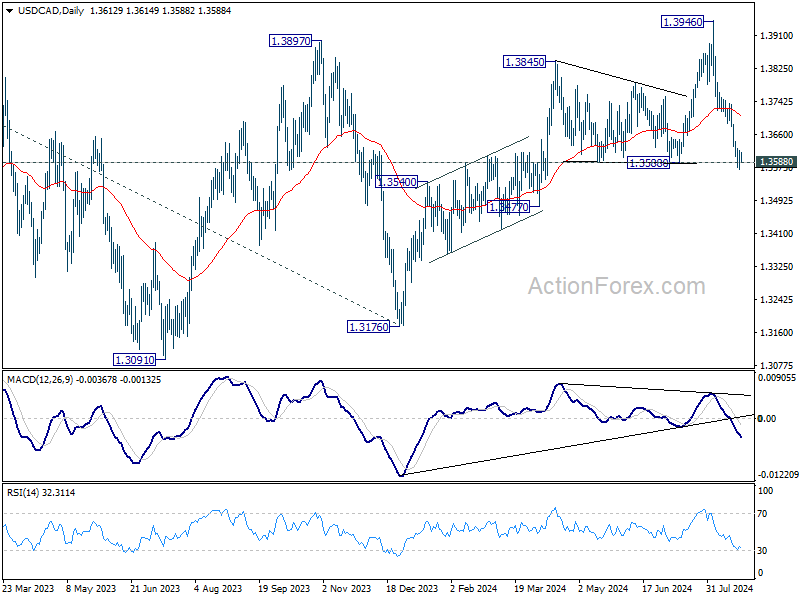
USD/CAD Daily Outlook
Daily Pivots: (S1) 1.3585; (P) 1.3602; (R1) 1.3632; More...
Intraday bias in USD/CAD remains neutral with focus on 1.3588 structural support. Strong support could be seen there to bring reversal. On the upside, above 1.3640 minor resistance will turn intraday bias back to the upside for stronger rebound. However, decisive break of 1.3588 will argue that rise from 1.3176 has completed at 1.3946 and target 1.3477 support next.
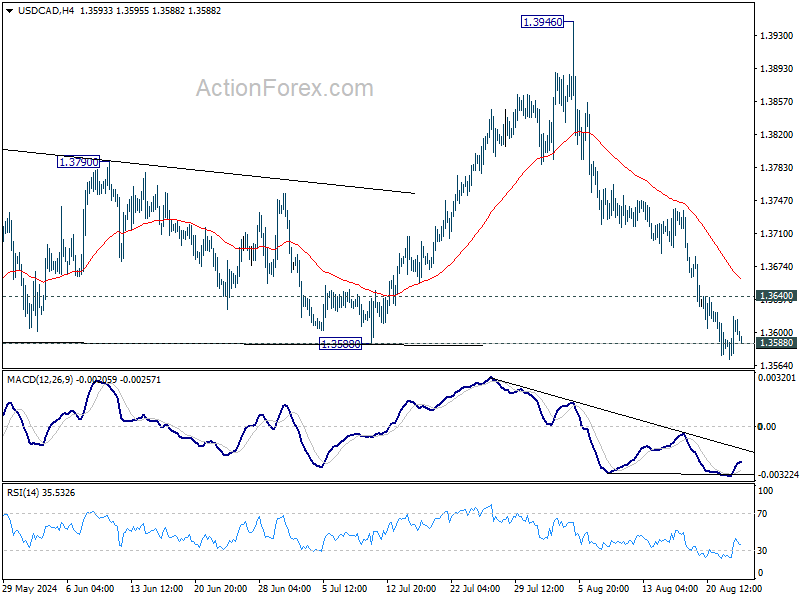
In the bigger picture, price actions from 1.3976 (2022 high) are viewed as a corrective pattern, that might have completed at 1.3176 (2023 low) already. Firm break of 1.3976 will confirm resumption of whole up trend from 1.2005 (2021 low). Next target is 61.8% projection of 1.2401 to 1.3976 from 1.3176 at 1.4149. This will be the favored case as long as 1.3588 support holds, in case of pullback. However, firm break of 1.3588 will argue that consolidation from 1.3976 is already extending with another falling leg back towards 1.3091/3176 support zone.
All Eyes on Powell’s Jackson Hole Speech
US stock markets sold off yesterday, as investors trimmed their long positions walking into Federal Reserve (Fed) Chair Jerome Powell’s Jackson Hole speech due later today – where he is expected to douse the jumbo rate cut expectations because there is no reason for the Fed to start cutting the interest rates by big chunks in the absence of a severe economic slowdown, market stress, or a crisis. This is at least what the data suggests and what other Fed members nudge toward, as well. Kansas Fed President Schmid said he would like to see more data points before supporting rate cuts. Boston Fed’s Susan Collins said that the rate cuts should be ‘gradual and methodical’. And Philadelphia’s Harker made sure that everyone understood that ‘the Fed is going to ease – but no one is portraying a desire to ease bp at this time’. As such, the US 2-year yield rebounded to 4%, the 10-year yield settled near 3.85%, the US dollar index rebounded from the lowest levels since December and the major US indices fell. The S&P500 erased 0.90% while the technology-led Nasdaq 100 lost near 1.70%. The Russell 200 index fell almost 1%. Now, everybody is holding his or her breath to hear what Powell has to say, or not say.
The swap markets continue to price in around 95bp cut from the Fed from September to the end of the year. A this-size cut means that the Fed should cut its rates every time it meets this year and cut by 50bp in one of the meetings. From where we stand right now, it seems more likely that this will not happen than the opposite. Therefore, the pricing must readjust to match at least a 75bp cut by the year end. The real risk here – for the doves – is if the Fed starts cutting rates in September and decides to pause – like did the European Central Bank (ECB) in July for example. If that’s the case, if there is a pause to Fed rate cuts in November, then the year will end with only a 50bp cut for the Fed – and that could weigh heavier on risk appetite and give a serious positive jolt to the US dollar.
Data-wise
The numbers released yesterday were a mixed bag in the US. The jobless claims came in as expected, near 230K last week, and continuing claims rose less than expected, the US manufacturing activity slowed more than expected – and at the fastest speed this year, while US existing home sales rebounded.
Over in Europe, the Paris Olympics gave a temporary sugar shot to the French services – hence tilted the Eurozone PMI numbers to the upside, but filtering out the Olympics, the numbers looked gloomy. Figures from Germany, particularly the manufacturing index, confirm that the situation is still not improving for the Eurozone’s former growth engine. The soft data, along with a broad based rebound in the US dollar, pulled the EURUSD lower yesterday. The pair found support near the 1.11, but the support could be easily pulled out from under the euro bulls’ feet if Powell confirms that the rate cuts will be gradual in the US.
Across the Channel, Cable retreated yesterday after hitting a more-than-a-year high, yet the sterling selloff was softer as the PMI numbers printed the strongest growth in four months with cooling price pressures. The UK economy has been performing better than the major peers so far this year, and that’s a blessing for the pound that hasn’t seen the daylight since Brexit. But be careful, a part of the shine is due to the USD selloff, which is likely exaggerated and calls for correction.
Elsewhere, Bank of Japan (BoJ) Governor Ueda reaffirmed before the Japanese policymakers his envy to continue raising the rates if inflation remained sustainably above the 2% target – which is the case. Headline inflation remained steady near 2.8% for the third month and core inflation hit a 5-month high. Regarding the August shake, Ueda said that the volatility was due to the rising US recession odds triggered by the US’ own economic data and that the BoJ’s hike helped reversing the one-sided yen trades. The USDJPY didn’t react much, but the JPY bulls strengthen their position in expectation of further BoJ normalization.
Elsewhere, gold retreated below $2500 per ounce and US crude rebounded near the $72pb level, the August support, as dipbuyers preferred returning to the market on hope that rate cuts from major central banks could boost global oil demand.
Last word
What has been a calm week could see a last minute volatility with Powell’s Jackson Hole speech. Powell will probably not show up with a game-changing speech today, but his words should temper overpriced cut expectations. If that’s the case, we shall see the US dollar rebound from oversold levels, yet appetite in stocks could remain intact with prospects of lower rates into the year end.