Sample Category Title
BoJ’s Ueda ready to scale back easing despite market instability
In a special parliamentary session today, BoJ Governor Kazuo Ueda reiterated the central bank's stance to its current monetary policy, even amidst recent market volatility. He emphasized that there is "no change to our basic stance to adjust the degree of monetary easing" should economic and price trends align with its forecasts.
Addressing concerns over the market turbulence observed in early August, Ueda attributed the instability to rising fears of a US recession, driven by weaker-than-expected economic data. He also noted that BoJ’s interest rate hike in July had triggered a sharp reversal in the "one-sided Yen falls".
He stressed that BoJ would continue to monitor market movements closely, recognizing their potential impact on the central bank's growth and price forecasts.
"Markets at home and abroad remain unstable, so we will be highly vigilant to market developments for the time being," Ueda remarked.
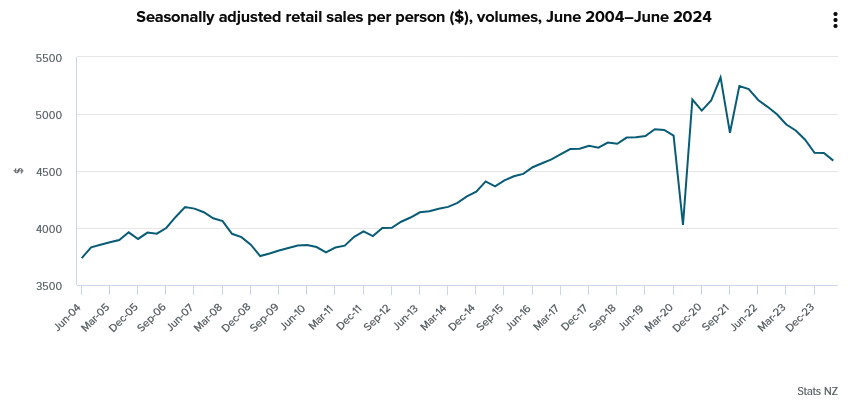
New Zealand retail sales volume falls -1.2% qoq in Q2
New Zealand's retail sales volume fell -1.2% qoq in Q2, , well below the expected -0.1% drop. Retail sales value also decreased by -1.3% qoq. Notably, 11 out of 15 retail industries reported lower sales volumes compared to the previous quarter.
Total volume of retail sales per person fell by -1.5%, marking the tenth consecutive quarter of decline after adjustments for seasonal effects and price inflation.
Ricky Ho, Business Financial Statistics Manager, highlighted the severity of this trend, noting, "Retail sale volumes per person have been falling for the last two-and-a-half years. The last time we saw several quarters of consistent falls was between 2007 and 2009, which coincided with the global financial crisis."
Being Data-Dependent in an Uncertain World
The RBA Board is uncertain, including about the staff’s judgements about demand and supply. But is being data-dependent any better?
Much has been made of the number of times the word ‘uncertainty’ or its variants appeared in the minutes of the RBA Board meeting in August. Perhaps more noteworthy was the increase in the number of times the word ‘staff’ appeared: 13, compared with low single-digit numbers in most of last year’s minutes. The total was higher for meetings where new staff forecasts were discussed. Outside of forecast months, though, the word appeared not even a handful of times in each of last year’s minutes and in the September 2023 minutes, not at all.
Another word being used a lot more is ‘judge’ and its variant ‘judgement’. Until May this year, the word barely featured, appearing at most two or three times in each issue of the minutes since February last year. Since May, it is recording double-digit word counts, appearing 15 times in the August minutes. Some of this is purely stylistic: one of the drafters might have decided that ‘Members judged’ was an attractive variation on ‘Members assessed’ and some of the other options favoured by drafters of the past.
Taken together, though, this shift in word choice might suggest something deeper. Particularly noteworthy was the following passage:
“In addition, the staff’s assessment was that the gap between aggregate demand and supply would be wider than previously judged throughout the forecast period, because of both a stronger outlook for demand and a reassessment of the economy’s current spare capacity. Members noted that judgements about this gap were highly uncertain.”
Indeed, several of the uses of the word ‘uncertainty’ relate to the uncertainty about the staff’s judgement about this gap, which was mentioned more than once in the minutes. One in particular made me wonder if the Board had not been fully convinced by the arguments supporting the latest revisions to the staff forecasts.
“Based on the data and evidence over a period of time, the staff had assessed that the economy had less spare capacity than previously assumed. This reflected higher inflation outcomes over the preceding 12–18 months than could be explained by previous estimates of excess demand, and signals from labour market indicators and survey measures of capacity utilisation. Members discussed the considerable uncertainty around estimates of spare capacity and the need to reassess this judgement regularly as the data evolve.”
The final sentence in that passage suggests that the Board was not willing to base its policy decision on the staff’s judgements about the output gap.
There are a number of reasons why the Board might have been so cautious in this area. Recall our previous observation (PDF 427KB) that the net surprise on inflation over the past three quarters has been small to zero. Adjusting your assessment of your current position based on your forecast errors over the past 12–18 months is a reasonable approach. But it becomes less reasonable when most of that forecast error relates to periods that were more than a year ago.
Another issue is that we cannot truly see aggregate demand and supply; we can only infer them from data. If the indicator data being used do not map linearly to the ‘true’ levels of demand and supply, then estimates of the gap could be off-base. In addition, inflation outcomes only tell you about the gap between demand and supply. Inferring whether the surprise comes from demand or supply needs other sources of information. The Board highlighted this in the minutes, noting that there were uncertainties around the persistence of supply shocks. While some other public statements from RBA officials suggest that the RBA is assuming that pandemic-related supply shocks have fully washed through, the minutes suggest that the Board does not think this is so clear-cut.
Given these difficulties, the Board has responded by continuing to place “greater-than-usual weight on the flow of data, relative to the forecasts”.
This raises the question of which data can be relied on, given the uncertainties of measurement. As we discussed last week, hours worked data might be getting a bit less weight now than they appeared to have in the compilation of the August forecast round. US policymakers have just had an experience of this with the payrolls data as well.
Some inspiration might be gleaned from the statements of peer central banks in economies that opened earlier after the pandemic, and thus where the disinflation started earlier. For example, the Bank of Canada Governing Council decided to hold rates steady at its April meeting but signalled that it was preparing to ease; it subsequently cut rates at its June and July meetings. In its announcement after the April meeting, it highlighted four key indicators of underlying inflation pressure that it was monitoring:
- the balance of supply and demand in the economy
- corporate pricing behaviour
- inflation expectations
- wage growth relative to productivity
Three of the four would be familiar to readers of RBA communication, but the emphasis on corporate pricing behaviour is less often seen here. In addition, the role of weak productivity growth is interpreted somewhat differently in Canada. While some members publicly worried in the July statement about the strength of wages growth relative to weak productivity growth, the same statement also noted: “Wage growth was expected to moderate given the presence of labour market slack and weak labour productivity”.
In other words, in an environment of weak productivity growth, employers might be less willing to agree to large wage increases, and this would tend to reduce wages growth relative to outcomes when productivity growth was stronger, and all else equal. This potential direction of causation does not appear in RBA communication, even though wages growth has already peaked in Australia. Nor does the possibility that high labour costs might induce firms to invest more in labour-saving technologies or increase productivity in other ways.
Rather, the RBA’s analysis seems to embed a linear mapping from hours worked to productivity to unit labour costs to inflation. Arithmetically, that is how it works. In an environment of uncertainty, though, it is risky to assume that a surprise in one component (such as hours worked) maps fully to a revision in the next quantity in the chain (such as productivity), holding no implications for related variables (such as GDP). A similar example in the RBA’s August minutes is the comment that “persistence of cost pressures was a key theme reported by firms in liaison discussions”. This is no doubt true, but the implications for the next link in the chain – business pricing decisions – are less clear.
One of the risks about being data-dependent is that, in the end, there is still a model behind your judgements, even if only a mental one. In the Australian context, that model seems to have a flavour of cost-plus pricing to it. Until the staff of the RBA start to judge that some labour market slack has emerged, the RBA will likely continue to interpret the data flow from a perspective of believing that demand is still strong, and set policy accordingly.
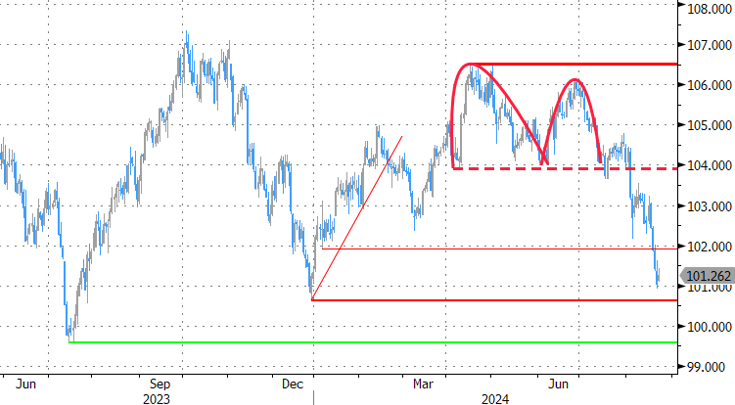
USDCAD Wave Analysis
- USDCAD reversed from key support level 1.3590
- Likely to rise to resistance level 1.3650
USDCAD currency pair recently reversed up from the key support level 1.3590 (former resistance from February and March, which has been reversing the price from the middle of May) coinciding with the lower daily Bollinger Band.
The support level 1.3590 was strengthened by the 50% Fibonacci correction of the previous sharp upward impulse (1) from December.
Given the clear daily uptrend and the oversold daily Stochastic, USDCAD currency pair can be expected to rise to the next resistance level 1.3650.
Fed’s Harker and Collins signal support for gradual rate cuts
Philadelphia Fed President Patrick Harker and Boston Fed President Susan Collins have both indicated their support for beginning a gradual reduction in interest rates, assuming no unexpected changes in economic data.
Harker emphasized that the process should start soon, stating, "barring any surprise in the data we'll get between now and then, I think we need to start this process." He also noted that the pace of rate cuts should be "slow and methodical."
Collins echoed this sentiment, highlighting the progress made in reducing inflation. She remarked, "We've seen quite a lot of reduction in inflation," and expressed confidence that the economy is on the right path.
Collins also underscored the importance of a "gradual, methodical pace" in the rate-cutting process to maintain the health of the labor market.
Japanese Yen Price Action Ideas: USD/JPY, EUR/JPY
- The Japanese Yen has seen significant volatility in recent weeks, influenced by factors like US Dollar recovery and mixed Japanese economic data.
- USD/JPY shows potential for retesting the 150.00 level, with resistance at 146.37 and support around 143.60.
- EUR/JPY mirrors USD/JPY’s movements, with resistance at 163.50 and the potential for a 200-pip rally if it breaches the 200-day MA.
JPY Fundamental Overview
The Japanese Yen has had a wild ride over the past couple of weeks with Yen pairs experiencing whipsaw price action. Things are settling down of late but the potential for further headwinds still exists.
The US Dollar is seeing a small recovery this morning which has helped USD/JPY push away from the psychological 145.00 handle. This comes after yesterday saw significant volatility in the pair following the downwardly revised jobs data and Fed minutes releases.
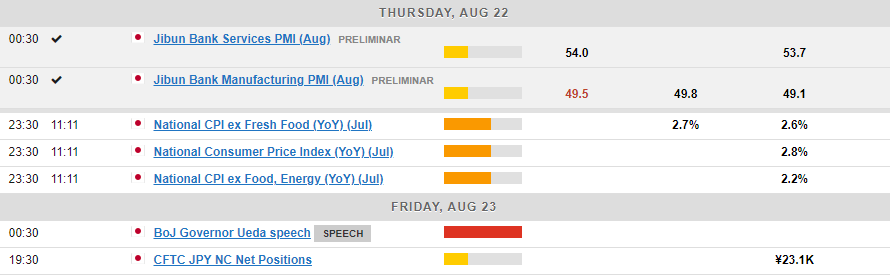
A slew of Japanese data was released in the Asian session with a mixed reception. Composite and Manufacturing PMI inched higher from a month earlier The composite print was the highest print since May 2023.
Japanese Composite PMI Hits Highest Level Since May 2023
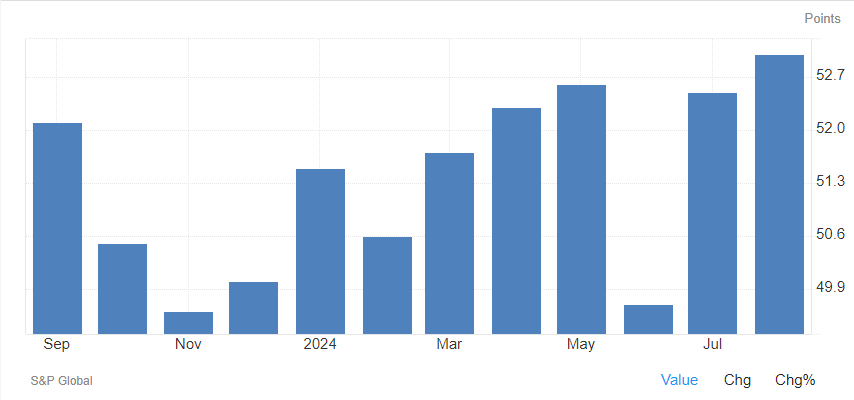
Source: Trading Economics (click to enlarge)
The au Jibun Bank Japan Manufacturing PMI increased to 49.5 in August 2024 from a four-month low of 49.1 in the previous month, compared with market forecasts of 49.8, pointing to the second straight month of contraction in factory activity, preliminary estimates showed. It also marked the sixth consecutive month of decline in the manufacturing sector this year due to new orders shrinking further, with foreign sales falling at a stronger rate.
Lastly, business confidence data showed marginal signs of improvement as well.
Bank of Japan’s Kazuo Ueda is set to testify before the Japanese parliament on Friday, where legislators will scrutinize the central bank’s July interest rate hike. Additionally, local inflation figures are scheduled for release tomorrow.
The week will wrap up at the Jackson Hole Symposium which brings the spotlight on Central Bank Leaders from both the US and UK. Jerome Powell and Andrew Bailey are both expected to deliver remarks which could stoke volatility and affect USD/JPY and GBP/JPY ahead of the weekend.
Japanese Yen Technical Outlook
USD/JPY
From a technical perspective, USD/JPY’s recent price action saw a green daily candle, ending a 3-day losing streak. Although USD/JPY failed to retest the 150.00 level late last week, there’s potential for another attempt at this psychological threshold.
Today’s daily candle is on track to complete a morning star candlestick pattern off a key support area, theoretically signaling higher prices. However, with upcoming Japan inflation data, the Jackson Hole symposium, and BoJ Governor Ueda’s parliamentary appearance, the risks remain significant.
On the upside, resistance lies at 146.37, tested earlier today. A break above this could shift focus to last week’s highs at 149.38. Conversely, a breach of the 145.00 level may open the path for a retest of the August 5th low at 141.67, though USD/JPY must first navigate support around the 143.60 handle.
USD/JPY Daily Chart – August 22, 2024
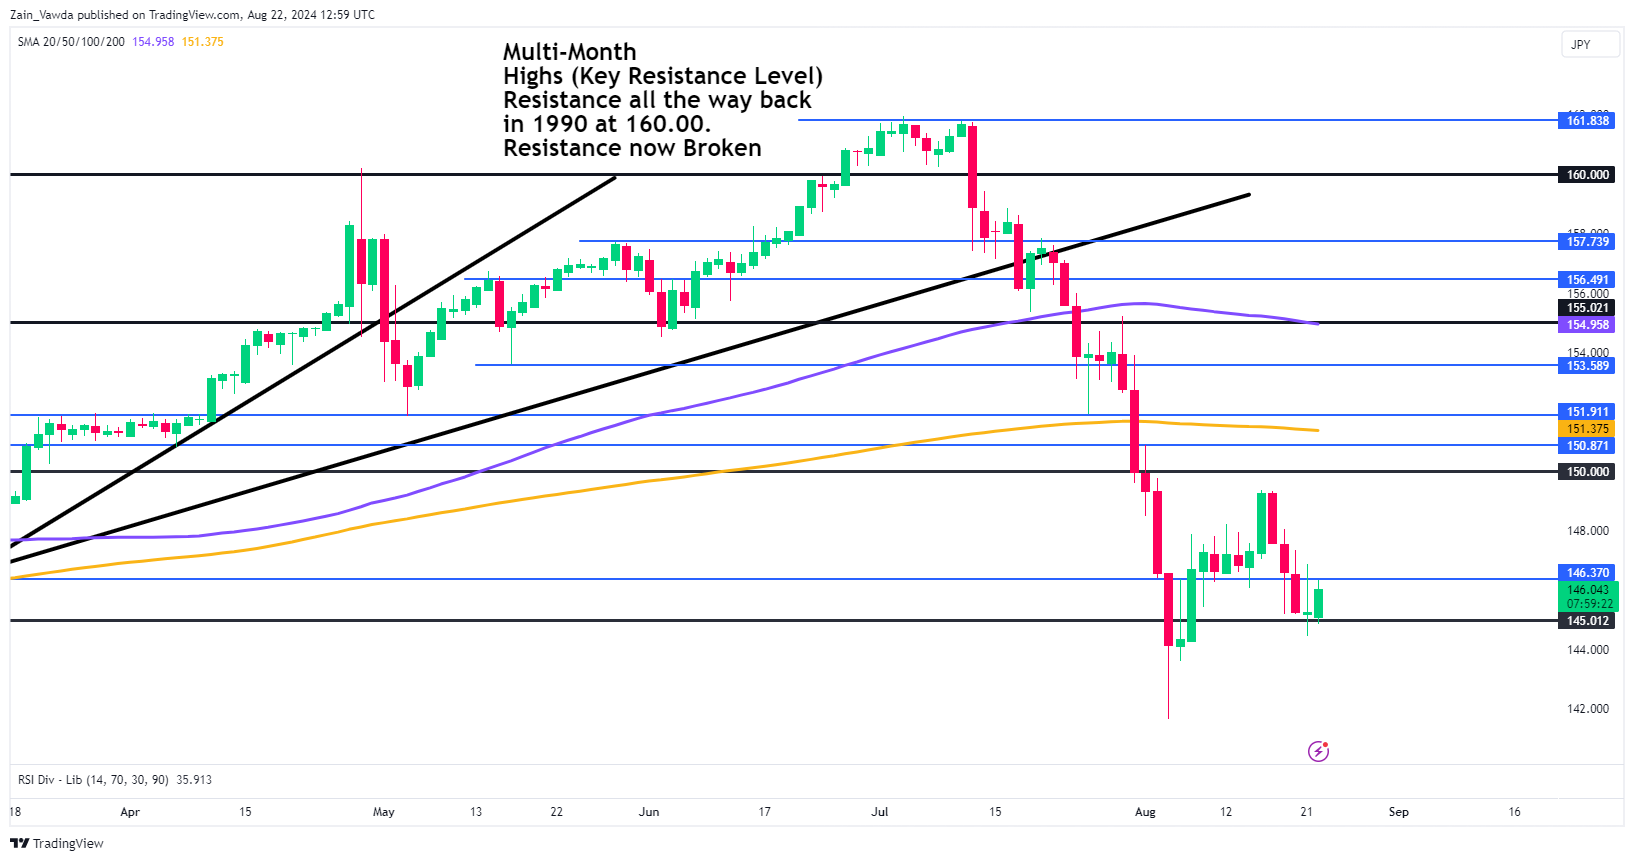
Source: TradingView.Com (click to enlarge)
EUR/JPY
EUR/JPY is closely mirroring the USD/JPY chart, a trend that has become more evident in recent months. Yesterday, EUR/JPY formed an inverted hammer, and this morning’s brief push higher encountered resistance near yesterday’s highs.
Immediate resistance is at 163.50, with the 200-day moving average just above at 164.13. A breach of this level could trigger a 200-pip rally towards the 166.21 handle and the 100-day moving average.
On the downside, a move lower from current prices will need to navigate the 162.00 level before bringing the psychological 160.00 handle into focus.
EUR/JPY Daily Chart – August 22, 2024
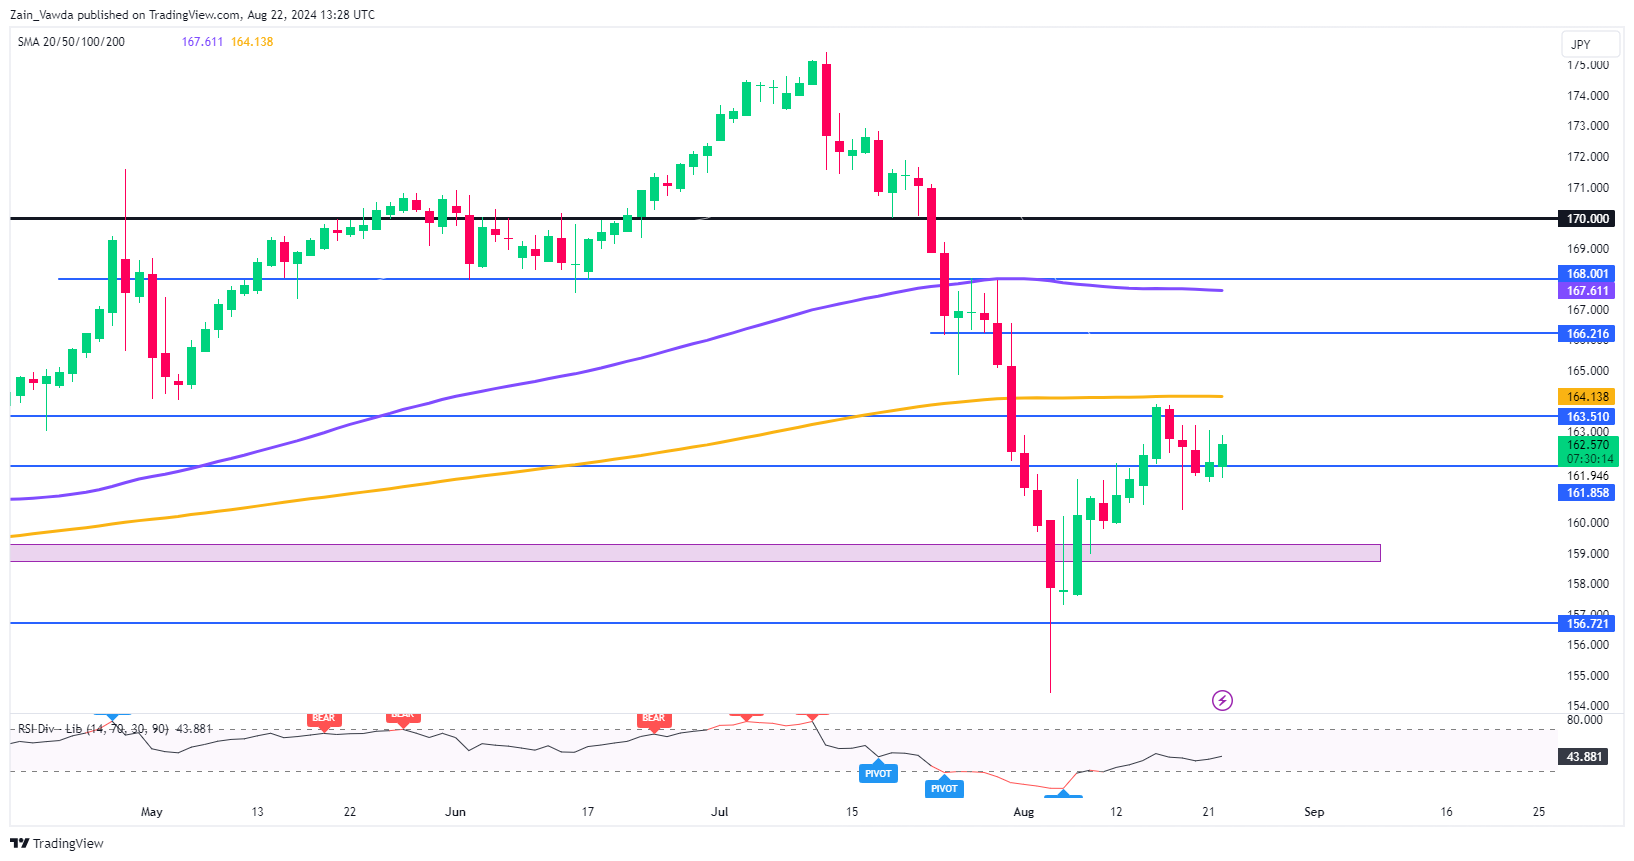
Source: TradingView.Com (click to enlarge)
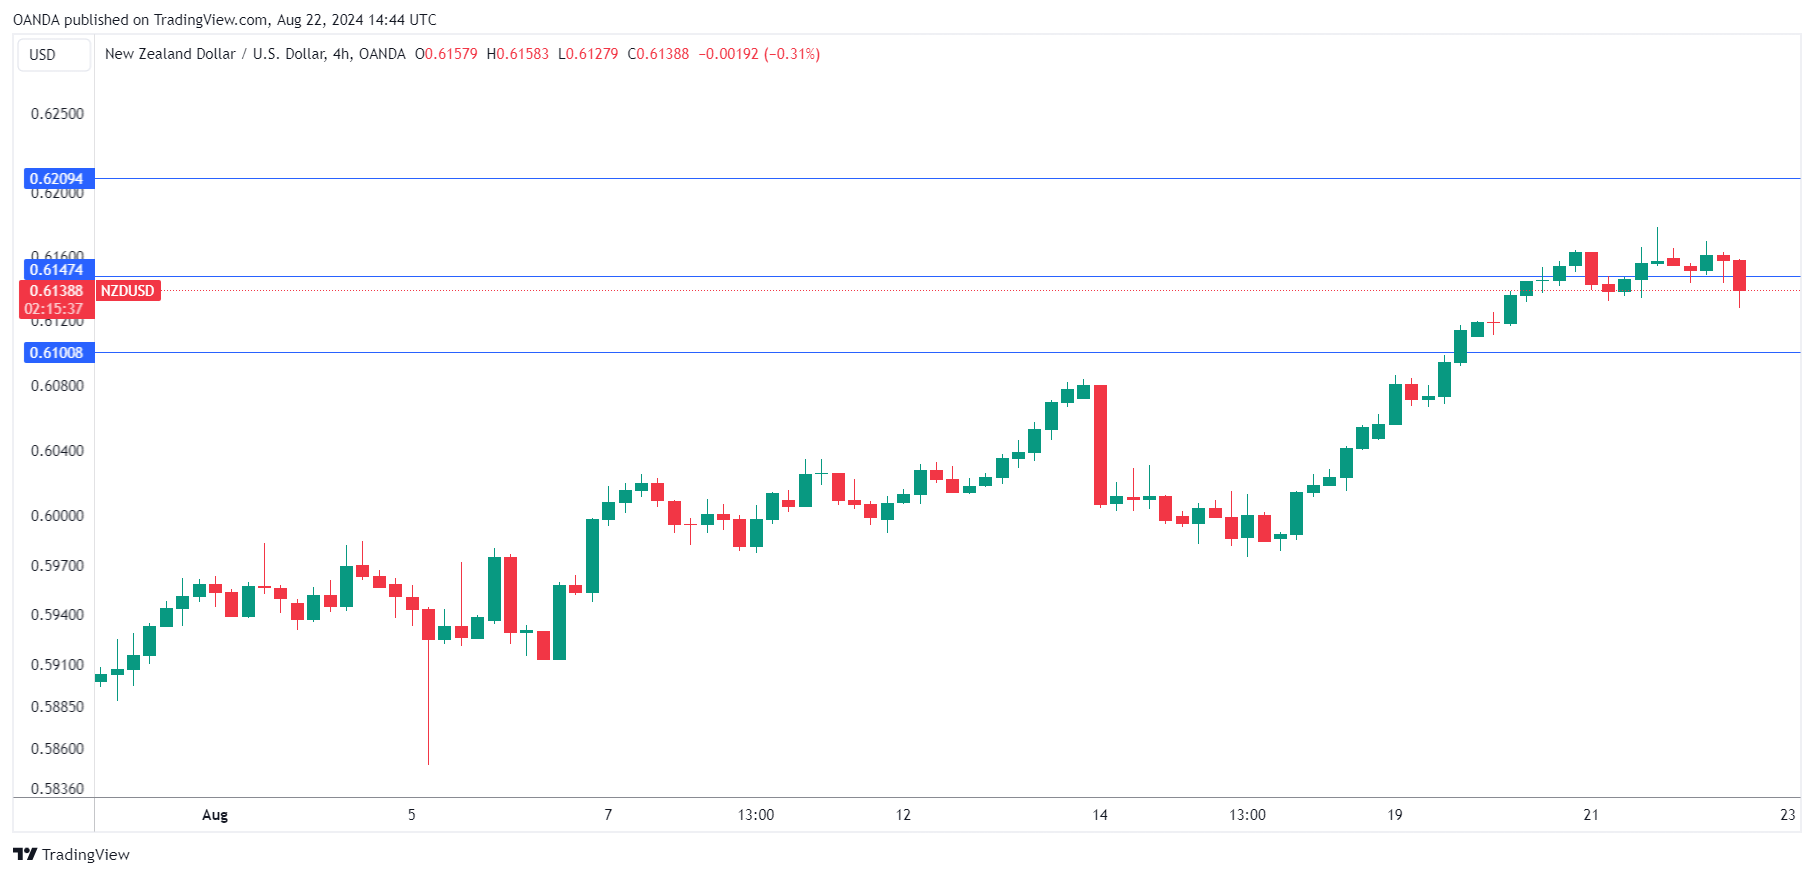
NZ Dollar Slips Ahead of Retail Sales, Powell’s Speech
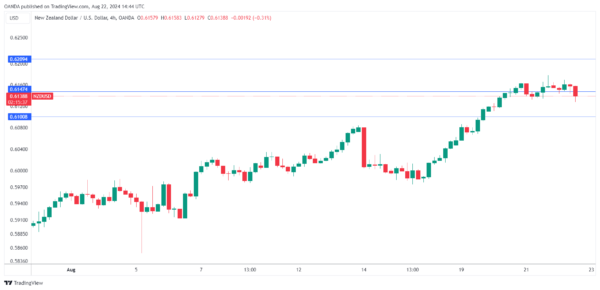
The New Zealand dollar is drifting on Thursday. In the North American session, NZD/USD has fallen to 0.6132 at the time of writing, down 0.41% on the day.
The New Zealand dollar continues to have its way with its US counterpart and has soared 4% since July 29.
New Zealand retail sales expected to slide
The markets are braced for a downturn in retail sales for the second quarter, with a market estimate of -1%, following a 0.5% gain in the first quarter. The New Zealand economy has been struggling and weak retail sales in June drove the Services PSI lower to 40.2 in June, compared to 42.6 in May. A reading below 50 indicates contraction. High interest rates have weighed heavily on economic activity and consumers have cut back sharply on discretionary spending.
In the US, the FOMC minutes of the July meeting reaffirmed that the Fed is headed towards a milestone rate cut at the Sept. 18 meeting. Most of the Fed officials at the meeting favored reducing rates next month, provided that that data “continued to come in about as expected”. The markets have fully priced in a September cut, which hasn’t happened since the onset of the Covid pandemic.
Markets await Powell’s Jackson Hole speech
The annual Jackson Hole symposium is often little more than a photo-op but this year promises to be different. Next month, the Federal Reserve is poised to deliver its first rate cut since March 2020, likely in the form of a quarter-point cut. There is an outside chance of a large half-point cut, which would become more likely if the next jobs report on Sept. 6 points to further cooling job growth.
.
NZD/USD Technical
- NZD/USD is testing support at 0.6147. Below, there is support at 0.6100
- The next resistance line is 0.6209
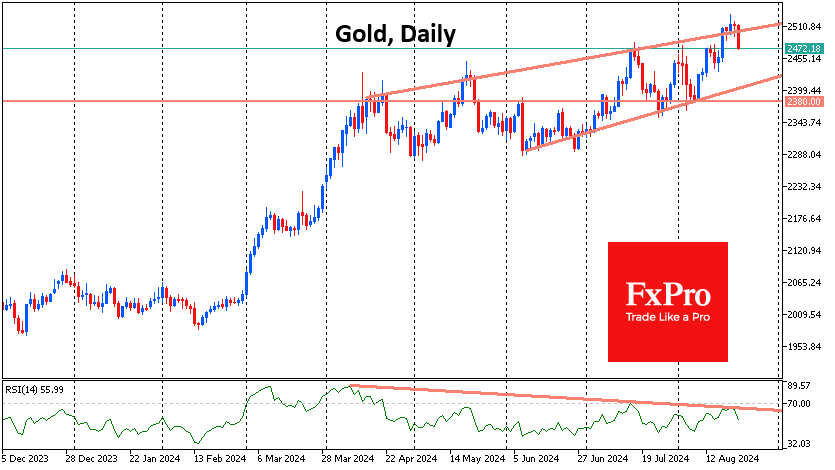
Gold Struggles After Reaching New Highs
Gold started the week with a decisive renewal of all-time highs, reaching the maximum spot price of $2531 per troy ounce. However, the bulls failed to seize the initiative finally, and on Thursday, gold lost more than 1%, falling back to the depths of the upward trend established in April.
We also pay attention to the exhaustion of the growth momentum. On daily timeframes, a divergence is forming between a sequence of increasingly higher price highs and increasingly lower RSI highs. This is considered a harbinger of a deeper dive, and significantly, the most recent reversal occurred from levels below the overbought area. Thus, it is worth paying attention to how events will unfold next.
Trading within the above trend opens the door for a relatively quick pullback to $2420. It will be possible to speak about the break of the upward trend only when the price falls below $2380 – the previous local lows.
Sunset Market Commentary
Markets
European data today managed to temporarily steal attention away from the US. August PMI figures showed EMU business activity rising at a faster pace, but there’s more than meets the eye. The composite PMI ticked up to 51.2 (3-month high) whereas consensus expected a stabilization at 50.1. The EMU manufacturing remains deeply mired in recession territory (45.6 from 45.8) with the services sector outperforming (53.3 from 51.9). It’s unsure whether the domestic services industry will remain as strong in coming months given that this month’s improvement is largely due to a stellar performance of France (55 from 50.1), linked to the 2024 Paris Olympics. Germany underperforms, with the composite measure sliding further into contraction territory (48.5 from 49.1; weakest since March). Underlying details of the composite PMI were also less positive. New orders continued to fall, while there was a broad stagnation of staffing levels across the EMU amid the lowest business sentiment YtD. Meanwhile, the rate of input cost inflation eased to an eight-month low, but companies raised their selling prices at the fastest pace since April. Services charges rose at the sharpest pace in three months, while manufacturing output prices increased for the first time since April 2023. The ECB might find some reassurance in the latest price indices though as input costs in the services sector (proxy for wages), rose at the slowest pace in 40 months. After the PMI, the European central bank announced that Q2 negotiated pay rose 3.6% from a year ago, down from 4.7% in Q1. It’s one of the key metrics they follow to decide whether underlying price pressure are fading, allowing for a less restrictive monetary policy. Minutes of the July ECB meeting later showed consensus that the September meeting was a good time to re-evaluate the level of monetary policy restriction. The complex of EMU figures failed to inspire trading, apart from a brief EUR-uptick following French PMI’s (released earlier than German/EMU data). Today’s price action (ahead of US PMI’s) was more a modest reversal of this month’s strong trends with both core bond yields (up to +4 bps at front end of US yield curve) and the dollar (EUR/USD 1.1140) recovering some ground. Fed comments included Kansas City Fed Schmid who wants more data before supporting a rate cut. Based on yesterday’s FOMC Minutes, that’s the minority view on the board for now. Schmid added that yesterday’s payrolls revisions didn’t change how he thinks on monetary policy. Boston Fed Collins argued that a gradual pace of cutting is likely appropriate. Gradual is the magic word returning in Fed speeches. They suggest the central bank will kick off with a regular 25 bps rate cut instead of large 50 bps one at the mid-September FOMC meeting.
News & Views
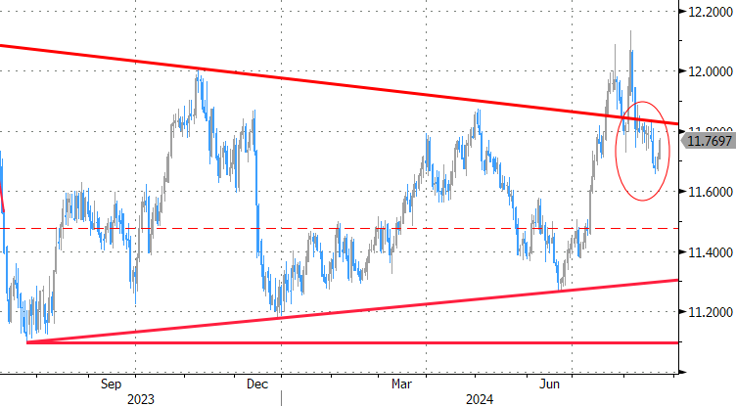
Norwegian Q2 GDP growth jumped by 1.4% Q/Q, but this was mainly due to an unusually high level of activity for the time of the year in oil and gas extraction (5.6% Q/Q) related to higher gas maintenance work carried out last year which allowed to keep production higher in Q2. Growth in the mainland economy was much more subdued at 0.1% Q/Q (vs 0.2% expected) following a downward revision for Q1 (0.2% to 0.1%). Household consumption rose a strong 1.6% Q/Q (sharp rise in car registrations). Final domestic use of goods and services declined slightly however. Other data also suggest subdued activity with the number of employed persons unchanged from Q1 while the number of hours worked decreased 0.1% Q/Q. The Norges Bank recently indicated that it intended to keep the policy rate stable at the current level of 4.5% for some time, amongst others to prevent an inflationary impact from the weak krone. Softer than expected H1 growth at some point might still open the debate on a NB rate cut before the end of the year. The market currently discounts a 25 bps cut in December. EUR/NOK rose from 11.71 to 11.76.
Belgian consumer confidence improved from -5 to -3 in August. All components of the indicator picked up this month without however making up for the downturn observed last month. Belgian consumers expressed significantly more optimism about the general economic situation going forward, with their expectations reaching the most favorable level seen since the start of the year (-10 from -16). Their sentiment concerning the development of unemployment also improved, albeit only marginally (18 from 19), without making up for the sharp deterioration recorded last month (19 from 12 at that time). On a personal level, households expect to see a modest improvement in their financial situation in the coming twelve months (-1 from -2) and intend to save more (18 from 16).
Graphs
EUR/NOK: disappointing GDP data open door for change of heart at Norges Bank
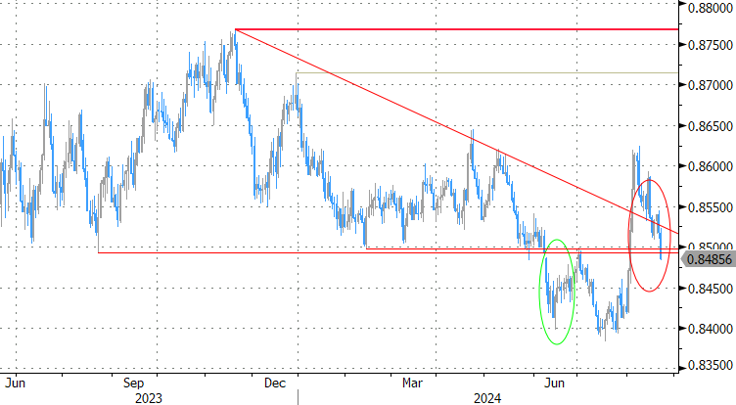
EUR/GBP: sterling outperforms on stronger UK PMI’s
EU 2y swap rate joins today’s broader move, rising slightly away from recent lows
Trade-weighted dollar (DXY): a moment of reprieve