Sample Category Title
Germany’s PMI composite falls to 48.5, risk of another recession growing
Germany’s PMI data for August paints a bleak picture, with both the manufacturing and services sectors underperforming. PMI Manufacturing dropped from 43.2 to 42.1, falling short of the expected 43.5. PMI Services also declined, falling from 52.5 to 51.4, below the expected 52.4. This led to a decrease in PMI Composite, which fell from 49.1 to 48.5.
Cyrus de la Rubia, Chief Economist at Hamburg Commercial Bank, commented on the data, noting that the recession in Germany’s manufacturing sector has intensified, with "no recovery in sight." He highlighted that new orders have plunged more sharply than in the previous month, driven primarily by a significant drop in foreign demand, which signals further challenges ahead.
The manufacturing sector’s struggles are beginning to "spill over" into the services sector, which had been relatively steady until now. For the third consecutive month, growth in services activity has slowed, reflecting the broader economic difficulties.
De la Rubia also pointed out that the anticipated recovery in the second half of the year is "failing to take shape," and the likelihood of Germany experiencing a second consecutive quarter of negative growth has increased. This raises the possibility of a renewed recession in Germany.
France’s PMI services surges to 55, an Olympic outlier
France's PMI data for August revealed a stark contrast between the manufacturing and services sectors. PMI Manufacturing fell from 44.0 to 42.1, marking an 8-month low and falling short of the expected 44.6. On the other hand, PMI Services surged from 50.1 to 55.0, significantly exceeding expectations of 50.5 and reaching a 27-month high. This strong performance in the services sector led to a rise in PMI Composite, which climbed from 49.1 to 52.7—a 17-month high and the first sign of expansion since April.
Norman Liebke, economist at Hamburg Commercial Bank, noted that the French economy is likely to grow by 0.5% in Q3, attributing the improvement in economic conditions to the services sector. He pointed out that this positive development can be traced back exclusively to the service sector, where the business activity index rose by nearly five points.
However, Liebke also cautioned that the strong performance in August could be an "outlier", influenced by the Olympic Games. Meanwhile, the manufacturing sector continues to face challenges, with production declining even more sharply than in July.
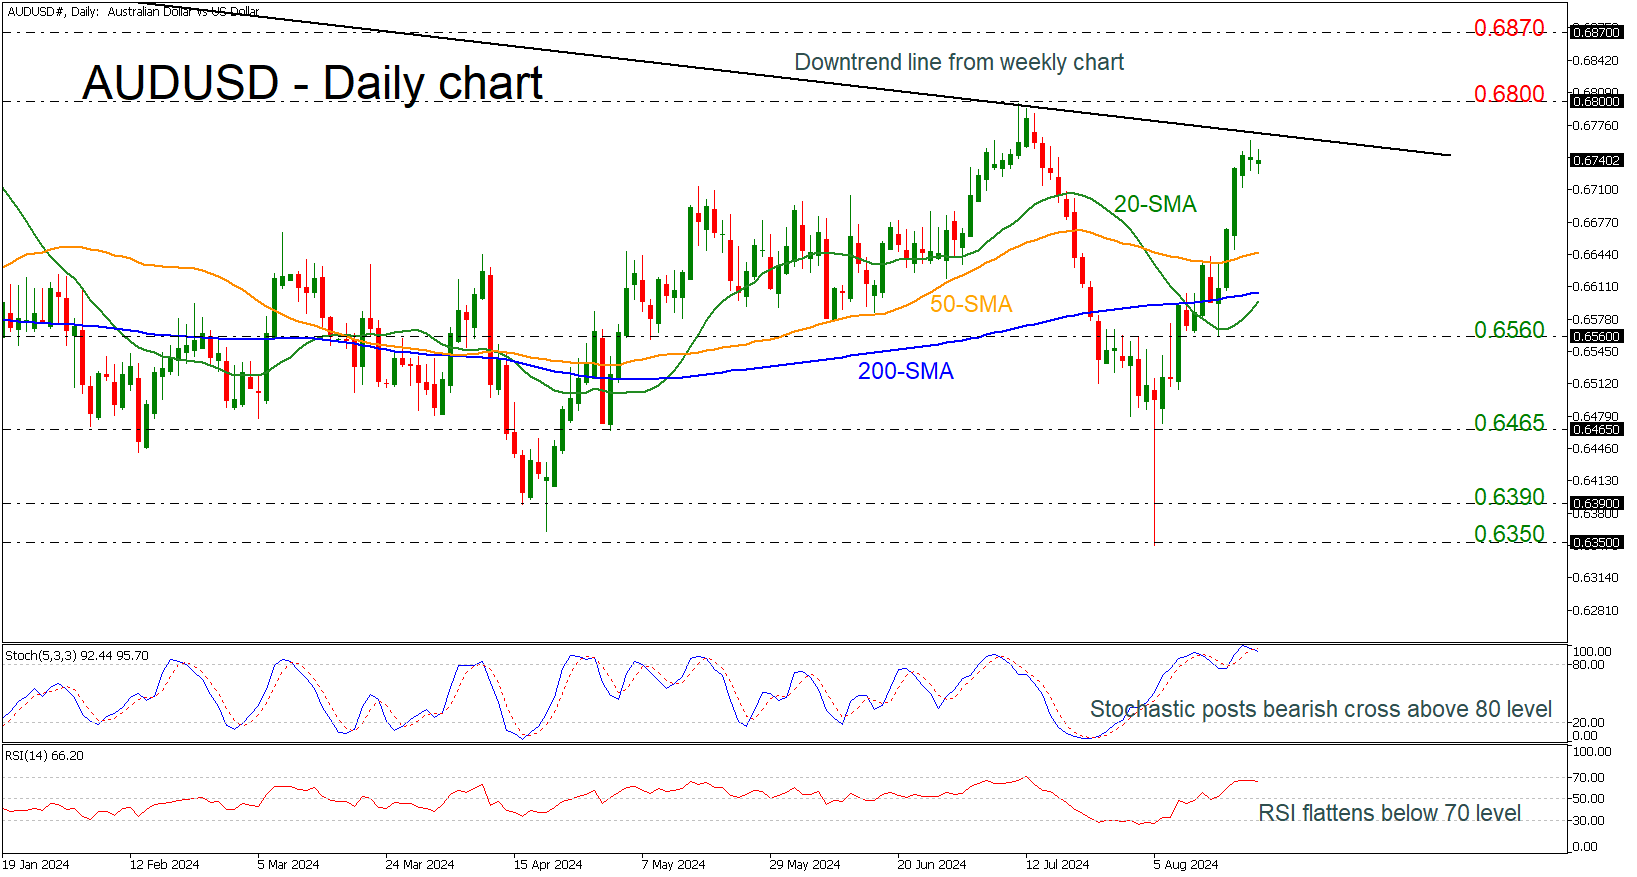
AUDUSD Loses Some Positive Momentum
- AUDUSD gains more than 6% after bottoming at 0.6350
- Immediate resistance near long-term downtrend line
- Technical oscillators suggest bearish correction
AUDUSD has posted an impressive bullish rally after the bearish doji candle on August 5, adding more than 6%. The price has overcome the simple moving average lines and is currently slightly below the weekly downtrend line, which represents the highs from January 2023.
However, the technical oscillators indicate a downside retracement in the market. The stochastic created a bearish crossover within its %K and %D lines in the overbought territory, while the RSI is moving horizontally, marginally beneath the 70 level.
If the upside moves extend beyond the 0.6770 level, which is near the descending trend line, the price may rest around the 0.6800 psychological mark. More advances could take the pair until the December 2023 top at 0.6870.
On the other hand, a slip lower could shift traders’ attention to the SMA lines between 0.6645-0.6600. The next support at 0.6560 may act as a strong turning point in the market before falling to 0.6465.
In a nutshell, AUDUSD has been positive in the short-term picture, but in the bigger outlook, the market will remain negative until a break above the long-term falling trend line occurs.
US Dollar Index (DXY) Tumbles as BLS Revises Job Growth Downward, Rate Cuts Loom
- US Dollar Index Plummets on Revised Jobs Data and Dovish Fed Minutes
- BLS Revises US Job Growth Downward. Biggest Downward Revision Since the Global Financial Crisis.
- Fed Rate Cuts Priced In? Powell’s Jackson Hole Speech in Focus.
The US Dollar has been treading water and is on course for a four day losing streak. A brief bounce earlier in the day was overshadowed by a steep downward revision in payroll data from the US Bureau of Labour Statistics.
The Bureau of Labor Statistics (BLS) recently revised its data, showing that the U.S. added 818,000 fewer jobs than initially thought for the year ending in March 2024. This suggests the job market was cooling faster than expected, with about 68,000 fewer jobs added each month.
Historical Payroll Revisions
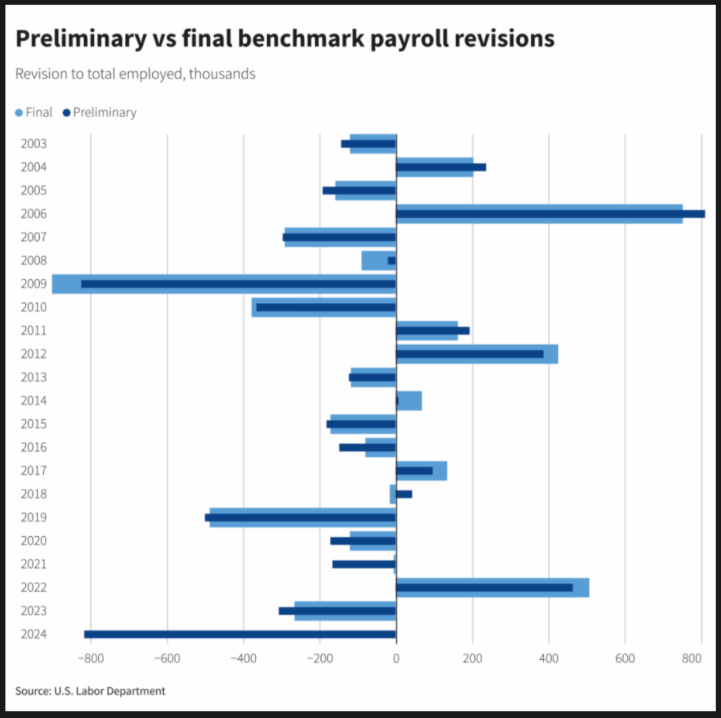
Source: BLS, Refinitiv
In early August, the BLS reported 114,000 new jobs in July 2024, which is lower than the revised 179,000 in June and the forecast of 175,000. This is the steepest downgrade since the Global financial crisis suggesting the job market is a lot softer than originally anticipated. This is not a surprise as there have been some analysts who have been touting this for months but being the minority their views were largely overlooked by market participants.
The only upside is that investors had already expected aggressive rate cuts. With the recent drop in the US Dollar, it seems investors might have already factored in many of the expected cuts.
This was further encapsulated by the minimal reaction to the Fed minutes release. The minutes showed that Fed policymakers agreed that July may be appropriate for a rate cut but opted to wait till September. This no doubt further cements the rate cut narrative heading into the September meeting.
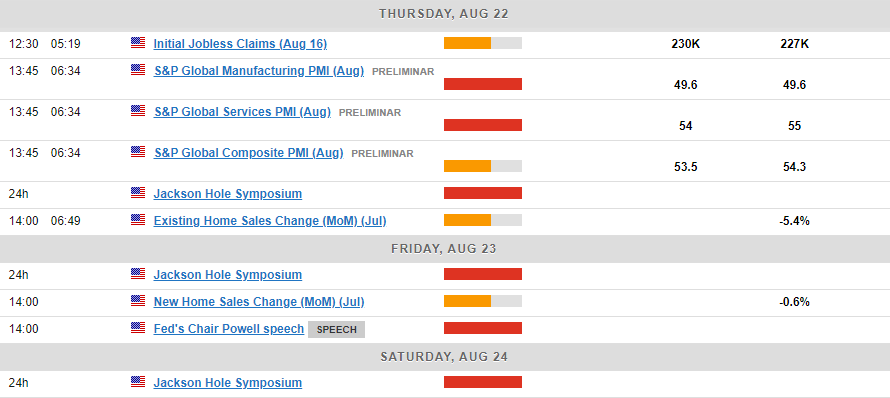
Federal Reserve President Jerome Powell is expected to speak at the Jackson Hole Symposium on Friday. Market participants were expecting volatility and perhaps some clarity regarding September rate cuts. However, today’s data means the Fed has little choice but to start cutting rates in September and begs the question… How much impact will the Powell Speech have on markets given yesterday’s developments?
Later in the day though we also have preliminary S&P PMI data which could give further insight into the US economy. Expect some volatility but barring a significant miss of consensus, i do not expect the data to have a major impact on rate cut expectations.
US Dollar Index (DXY) Technical Analysis
The US Dollar Index (DXY) is facing heavy selling pressure, but today’s daily candle shows indecision with nearly equal wicks on both sides, hinting at a possible midweek reversal.
The DXY is close to the crucial 100.00 level, which was last breached in July 2023, and breaking this could trigger a faster selloff.
I’m concerned about how much of the FED’s upcoming rate cuts have already been priced in.
On the upside, immediate resistance is at 102.160, the August 5 swing low, before 102.64 becomes significant.
US Dollar Index Daily Chat, August 22, 2024
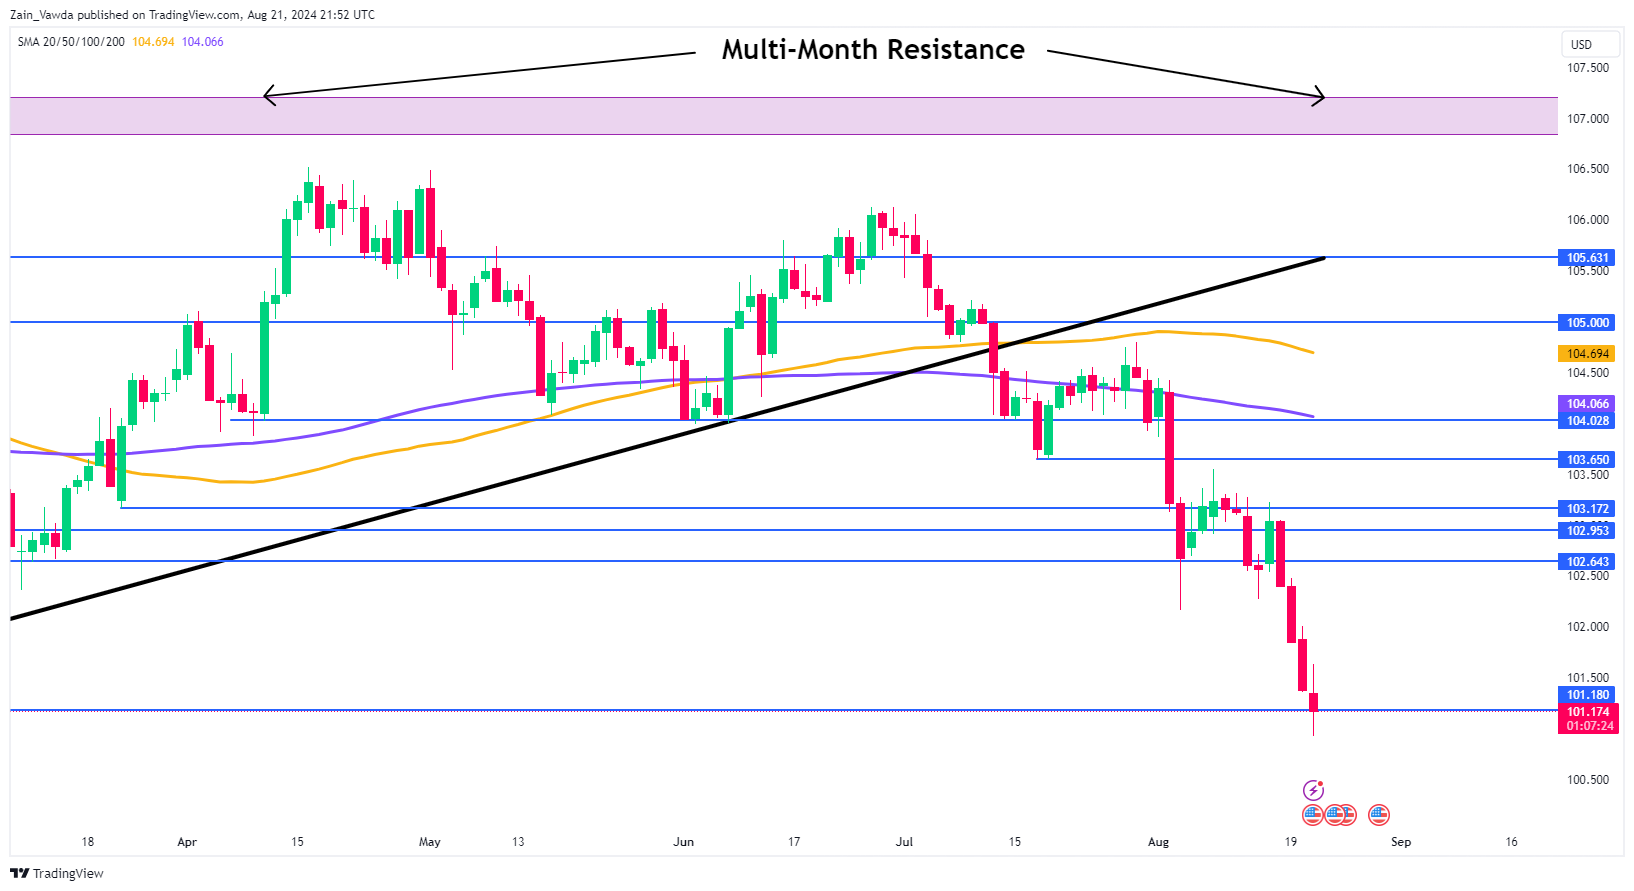
Source:TradingView.com
Support
- 100.50
- 100.00
- 99.00
Resistance
- 102.16
- 102.64
- 103.00
With Inflation Becoming Gradually More Under Control, Fed Has Space to Focus on Second Pillar of Dual Mandate
Markets
The US Bureau of Labour Statistics kept most of us waiting yesterday. The preliminary benchmark payrolls revision for the year through March 2024 eventually showed the feared, significant, downward revision. The actual payroll count was 818k lower or around 68k/month. That lowers the average monthly net job growth over the reference period from 242k to 174k which nevertheless remains solid. However, from a momentum and narrative point of view it adds to worries that the Fed could be behind the curve. With inflation becoming gradually more under control, the Fed has space to focus on the second pillar of its dual mandate: maximum employment. With the labour market tipping, this argues for a less restrictive monetary policy. We agree with that view, but still think that US (money) markets are taking it too far when it comes to rate cut bets this year and next. There’s no sense in fighting the strong market trends for now though. Minutes of the July FOMC meeting showed that the outcome (unchanged) was a closer call than expected. “Several officials observed that the recent progress on inflation and increases in the unemployment rate had provided a plausible case for reducing the target range 25 bps at this meeting or that they could have supported such a decision. The vast majority observed that, if the data continued to come in about as expected, it would likely be appropriate to ease policy at the next meeting.” The US dollar and the front end of the US yield curve drifted further south in the wake of the releases. Interestingly: the very long end of the US curve showed signs of fatigue. The US 30-yr yield even notched somewhat higher already. Daily changes ranged between -5.4 bps (2-yr) and +1.7 bps (30-yr). EUR/USD closed at 1.1150, above the December 2023 top of 1.1139. Eventually, the greenback also closed above the day’s softest levels. Key US equity indices gained up to 0.6% for Nasdaq. Today’s US agenda contains July PMI’s. Risks are tilted to the downside of expectations. We still think that US (ST) yields and USD will stick near recent lows as the possibility of a 50 bps lift-off in September won’t be off the table ahead of early September data releases (ISM’s, payrolls). In Europe, PMI’s and especially Q2 wage data are a wildcard. The latter risk staying more sticky, limiting the ECB’s room for action compared with the Fed.
News & Views
The Bank of Korea (BoK) left its policy rate unchanged at 3.5%. Governor Rhee Chang-young indicated that the central bank might be moving toward a rate cut at the upcoming meetings. The domestic economy has continued with its divergence between slowing domestic demand activities and vigorously growing exports. The BoK revised the 2024 growth forecast slightly to 2.4% from 2.5% in May. 2025 growth is seen unchanged at 2.1%. It assesses that inflation maintained its underlying trend of slowing down. CPI increased to 2.6% Y/Y in July due to higher petrol prices, but the core inflation rate remained steady at 2.2% and the BoK sees inflation slowing further (2.5% from 2.6% this year, 2.1% next year). The BoK statement concludes that the central bank will thoroughly assess the trade-offs among policy variables such as inflation, growth, and financial stability, and examine the proper timing of rate cuts while maintaining a restrictive monetary policy stance. Financial stability concerns (real estate prices and household debt) are a source of caution advocating a cautious approach.
The rift between the Hungarian central bank (MNB) and the government on the balance between fighting inflation and supporting (lagging) economic growth flared up yesterday. Hungarian finance minister Nagy assessed that the MNB is too focused on inflation and believes that inflation near 4% is low enough to start a more growth supportive policy. With economic growth only expected at a subdued 2% this year, Nagy thinks that the central should take supportive action potentially including initiatives such as the previous Funding for Growth program. Comments come as the central bank recently indicated that room to continue its easing cycle is becoming smaller (only one or two additional rate cuts of 25 bps this year; policy rate currently at 6.75%) ). The MNB meets next week. The rift between the MNB and the government often was a negative for the forint, but this time the HUF continues a gradual rebound on the easing of global financial conditions. EUR/HUF currently trades near 292.7.
Graphs
GE 10y yield
The ECB cut policy rates by 25 bps in June. Stubborn inflation (core, services) make follow-up moves less evident. Markets nevertheless price in two to three more cuts for 2024 as disappointing US and unconvincing EMU activity data rolled in, dragging the long end of the curve down. The move accelerated during the early August market meltdown.
US 10y yield
The Fed in its July meeting paved the way for a first cut in September. It turned attentive to risks to the both sides of its dual mandate as the economy is continuing to move better in to balance. Money markets tend to err in favour of a 50 bps lift-off. The pivot weakened the technical picture in US yields with another batch of weak eco data pushing the 10-yr sub 4%.
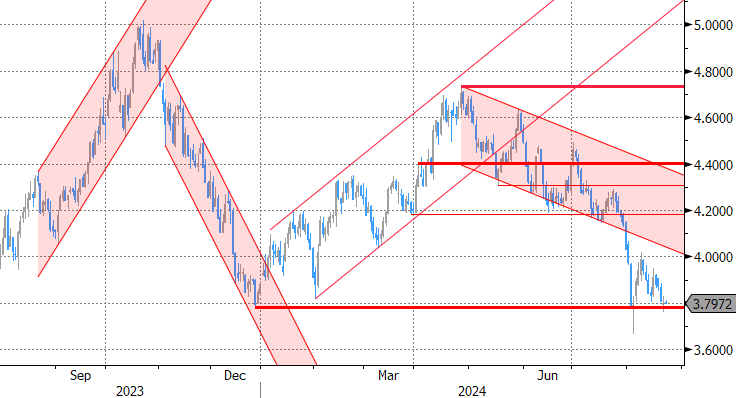
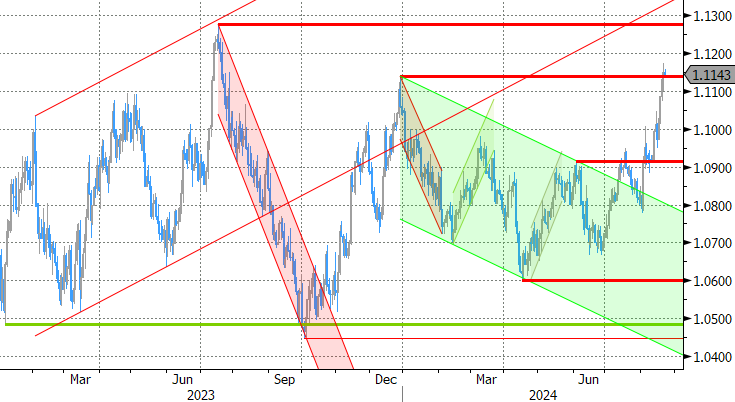
EUR/USD
EUR/USD moved above the 1.09 resistance area as the dollar lost interest rate support at stealth pace. US recession risks and bets on fast and large (50 bps) rate cuts trumped traditional safe haven flows into USD. EUR/USD 1.1139 (Dec 2023 high) is under test. 1.1276 (2023 top) serves as next technical references.
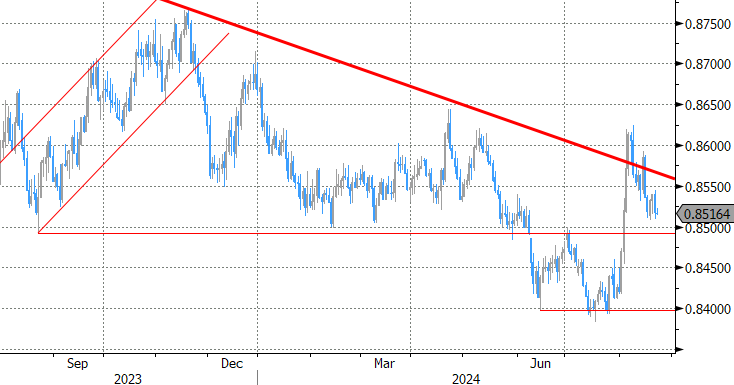
EUR/GBP
The BoE delivered a hawkish cut in August. Policy restrictiveness will be further unwound gradually 0on a pace determined by a broad range of data. The strategy similar to the ECB’s balances out EUR/GBP in a monetary perspective. Risk-off proved a more important driver of GBP recently, triggering a return from 0.84 towards 0.86.
A Questionable Reaction to the Big BLS Revision
The minutes from the latest FOMC meeting showed yesterday that ‘several’ Federal Reserve (Fed) officials were ready to cut rates at the June meeting, while ‘vast majority’ of them were convinced that September would be a good time to start cutting. Some officials were concerned that cutting the rates prematurely could risk reversing the progress made on taming inflation, but others saw a rising risk for the tightening jobs market to transition ‘to a more serious deterioration’. And the latter worries could be funded as the BLS made a whopping 818’000 downside revision to the annual payrolls figures, giving reason to Goldman Sachs where economists were expecting between 600’000 to a million downside revision. That means that the US added 68’000 less jobs per month than the numbers announced over the past year. That’s the biggest revision since 2009.
The FX and commodity side of the story
The combination of dovish Fed minutes and the big downside revision to the annual payrolls number sent the US yields lower and the dollar lower yesterday. The dollar is oversold at the current levels but the news supportive of the dollar bears keep coming in in a way to keep the bears in charge of the market despite the stretched positioning. As such, the EURUSD extended gains to 1.1174 yesterday, Cable advanced to 1.3120, the USDCAD slipped below the 200-DMA – and that despite a further fall in crude oil prices which could’ve prevented the bulls from rushing in, but did not, and the USDJPY consolidated near the 145 level. All of these currencies have one thing in common: their RSI indicators – the relative strength indicator – are flashing overbought conditions against the greenback and continue to suggest that a correction would be healthy at the current levels.
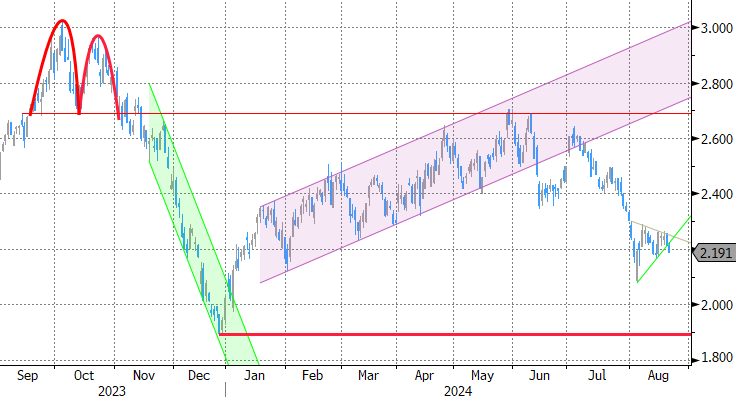
In commodities, gold consolidated near the $2500 per ounce as the risk on environment directed capital toward the stocks rather than the safe haven gold, while crude oil extended losses to the lowest levels since August despite a 4.6-mio barrel decline in US oil inventories last week. The ugly payrolls revision didn’t do much good to sentiment in oil, apparently. The black gold is preparing to test the $72pb support to the downside, and the bearish momentum has enough strength to carry the move toward the $70pb psychological mark.
The stock side of the story
About three weeks ago, when the US had released weak jobs data, the US dollar had fallen on the rising recession odds for the US and the stocks had fallen as well. The latter had even triggered a massive global risk selloff along with a broad unwind of the yen carry positions. Interestingly, yesterday, the market’s reaction to the BLS revision wasn’t quite similar. The S&P500 and Nasdaq both gained on expectation that the Fed will start cutting the rates, the Russell 2000 outperformed, and no one seemed to care that a bad jobs market was a sign of recession that could hurt company profits – the only place we saw that worry was at crude oil, and even the SPDR’s energy sector eked out a small gain yesterday.
Something must give
The Jackson Hole meeting starts today, Fed President Powell will speak on Friday, and many other central bankers will have the opportunity to give hints about their monetary policy plans, as well. Walking into the meeting, the swap markets are back to pricing in a 100bp cut from the Fed before the end of this year. The latter implies a jumbo rate cut at one of the last three FOMC meetings of the year. And because a jumbo rate cut wouldn’t arrive unless there is a deeper economic and financial trouble, the market pricing of the moment is unsustainable for either the US dollar – which has gone too low with the expectation of a 100bp cut, or the stock markets – which have gone too high with the same expectation disregarding the fact that economic trouble is never good for profitability. In summary, I think that something must give: either the US dollar will rebound, or equities will fall. But a weaker dollar and higher equities don’t make sense together.
Elsewhere
Data-wise, the flash PMI numbers and the European Central Bank (ECB) minutes will be on the menu du jour. The figures in Japan showed a slower-than-expected rebound in the manufacturing activity but the services PMI printed a 7th month expansion and the fastest expansion since April. The figures in Europe will likely be mixed, and the figures from the US are expected to point at weaker numbers compared to last month – that could back the dovishness Fed expectations.
In Europe, investors will also be looking for hints of a September rate cut. Many think that the Eurozone’s economic weakness suggests one more cut before the year ends – on top of the September cut. That’s one less cut compared to the Fed, and a possibly 50bp cut less compared to the Fed if the Fed goes ahead with a 50bp in one of its remaining three meetings. And looking how poorly the Eurozone economies performs compared to the US’, it seems that there is a mispricing here, as well.
FOMC Ready For September Rate Cut After Minutes and Weaker Job Growth
In focus today
August Flash PMIs are due for release today from the euro area, the UK and the US. July figures signaled weakening growth momentum especially in the euro area as the manufacturing index remains well in recession territory. We still forecast positive growth for all three economies during H2 and more upbeat PMIs could help alleviate markets' latest recession fears.
The annual Jackson Hole Economic Policy Symposium organized by the Kansas City Fed begins today and runs until Saturday. This year's theme is 'Reassessing the Effectiveness and Transmission of Monetary Policy'. Markets pay the closest attention to the Fed chair Powell's speech which is due at 16.00 CET.
In the euro area we get negotiated wage data for Q2. This is one of the important data releases for ECB before the September monetary policy meeting. Wage growth came in at 4.7% in Q1, and the June staff projections expected wage growth to remain broadly unchanged in Q2.
Early Friday, we receive Japanese inflation data for July. It will be interesting to gauge price pressures over the summer after June inflation was higher than expected following several months with modest price pressures. Tokyo data suggests inflation has moderated once again.
Economic and market news
What happened yesterday
From the US, we received the minutes of the latest FOMC meeting. Several participants said recent progress on inflation and increases in the unemployment rate provided a 'plausible case' for a 25-basis point rate cut at the July-meeting, or that they could have supported such a move. Most participants at Fed's meeting on 30-31 July said it would likely be appropriate to ease policy at the next meeting if data continued to come in as expected, minutes show. The minutes only further strengthen the expectation that we should see a 25 bp rate cut at the September meeting.
The payrolls revisions from the Bureau of Labor Statistics showed that the number of pay rolls was revised down by around 800,000 jobs from March 2023 to March 2024 meaning that jobs growth was way lower than what had been released previously.
Given the minutes and the payrolls revision a rate cut of 25bp by the Federal Reserve in September seems almost to be a done deal.
Market movements
Equities: Global equities were higher yesterday, led by Europe and the US, with the consumer discretionary sector leading the advance on both sides of the Atlantic. Energy stocks were once again found at the bottom of the performance range as oil prices continued to fall. For inflation bears, it is important to note that oil is down roughly 10% from last year, and the negative year-over-year effect will increase to 20% in the coming month if oil prices remain at current levels. Small caps made a significant comeback after their weak performance on Tuesday. In the US yesterday, Dow +0.1%, S&P 500 +0.4%, Nasdaq +0.6%, and Russell 2000 +1.3%. Asian markets are mixed this morning, with Japan continuing to regain some of its lost territory following the turmoil during the heavy carry trade unwind days. US and European futures are marginally lower.
FI: The combination of a downward revision of the US non-farm payroll numbers and the minutes showing that several members of the FOMC committee saw a case for a rate cut in July initially sent US bond yields lower yesterday. 10Y Treasuries declined some 6bp before rising 4bp at the end of the trading session yesterday. 2Y US Treasury yields dropped almost 10bp before rising 3-4bp.
Hence, a rate cut of 25bp by the Federal Reserve in September seems almost to be a done deal given the downward revision to the labour market data of some 800.000, which was the largest downward revision since 2009 as well as the comments in the minutes from the FOMC meeting.
FX: CHF and GBP gained yesterday, where USD and NOK lost ground. EUR/USD rose firmly above 1.11 after revision to job growth and the release of the FOMC minutes. After a strong start to the week, NOK reversed course yesterday. EUR/NOK rose above 11.70 again.
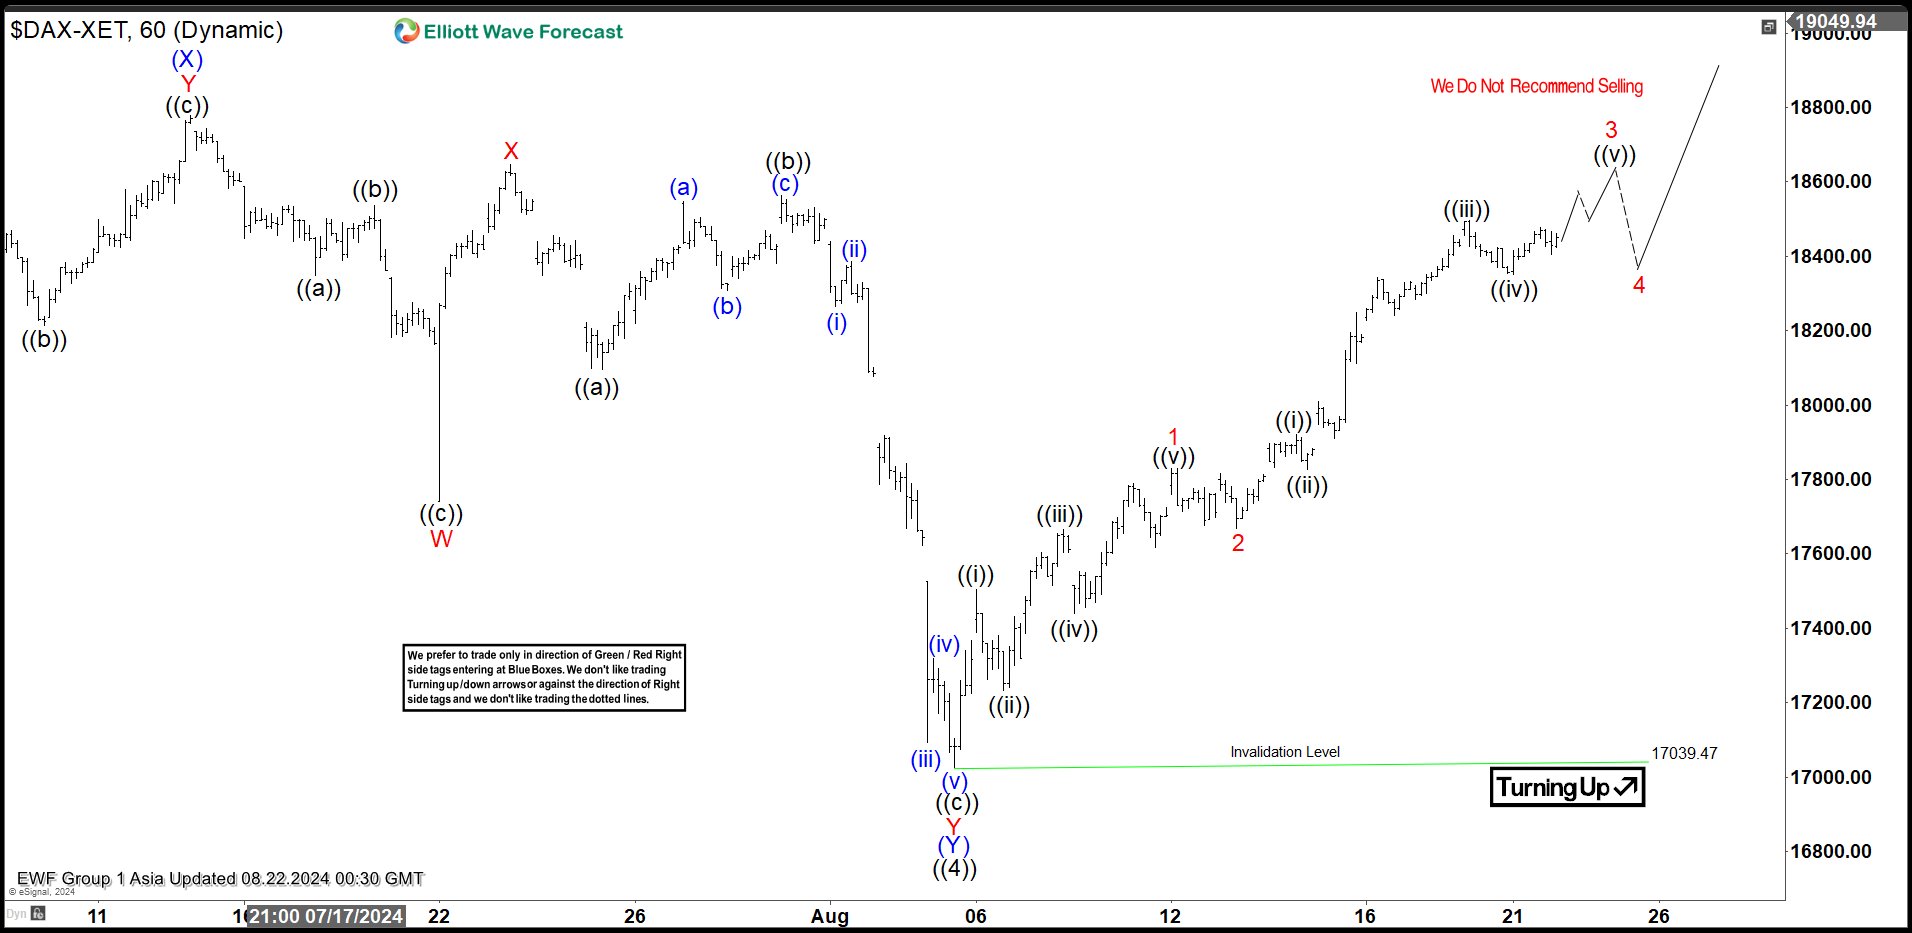
Elliott Wave Intraday on DAX Favoring Bullish Continuation
Short Term Elliott Wave View suggests rally in $DAX to 18892.92 ended wave ((3)). Pullback in wave ((4)) unfolded as a double three structure where wave (W) ended at 17951.17 and wave (X) ended at 18779.40. Index then resumed lower in wave (Y) towards 17039.47 which completed wave ((4)). The Index has turned higher in wave ((5)) with internal subdivision as 5 waves. Up from wave ((4)), wave ((i)) ended at 17505.23 and wave ((ii)) ended at 17233.07. Wave ((iii)) higher ended at 17666.82 and pullback in wave ((iv)) ended at 17439.87. Final wave ((v)) higher ended at 17828.87 which completed wave 1 in higher degree.
Wave 2 pullback ended at 17669.64 and Index has turned higher again. Up from wave 2, wave ((i)) ended at 17921.99 and pullback in wave ((ii)) ended at 17827.08. Index resumed higher in wave ((iii)) towards 18495.28 and pullback in wave ((iv)) ended at 18354.33. Expect Index to extend higher in wave ((v)) and complete wave 3 in higher degree, then it should pullback in wave 4 to correct cycle from 8.13.2024 low before it resumes higher again. Near term, as far as pivot at 17039.47 low stays intact, expect dips to find support in 3, 7, or 11 swing for further upside.
DAX 60 Minutes Elliott Wave Chart
DAX Elliott Wave Video
https://www.youtube.com/watch?v=XmSo276KWA8
Crude Oil Prices At Risk of More Downsides Below $72
Key Highlights
- Crude oil prices struggled to clear the $80.00 resistance zone.
- It traded below a key bullish trend line with support at $77.00 on the 4-hour chart.
- EUR/USD rallied and surpassed the 1.1120 resistance.
- Gold seems to be consolidating near the $2,500 pivot zone.
Crude Oil Price Technical Analysis
Crude oil prices attempted a fresh increase above the $78.00 and $78.80 levels. It even spiked above $80.00 before the bears appeared and pushed prices lower.
Looking at the 4-hour chart of XTI/USD, the price started a fresh decline below the $80.00 level. It traded below the $78.80 and $78.00 levels. It even traded below a key bullish trend line with support at $77.00.
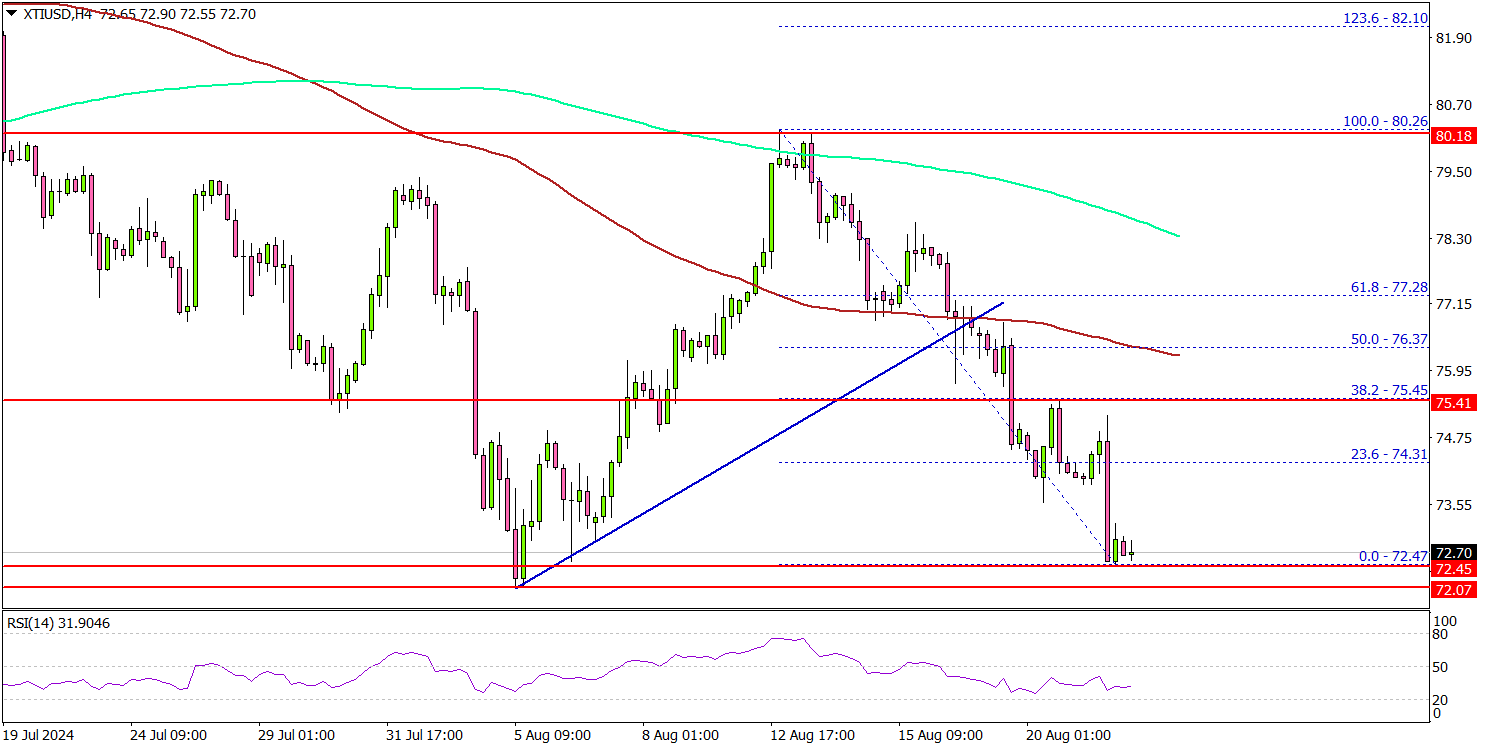
The price is now well below the 100 simple moving average (red, 4-hour) and the 200 simple moving average (green, 4-hour). It tested the $72.00 zone. A low was formed at $72.47 and the price is now consolidating losses.
If there is another increase, the price might face resistance near the $74.20 level. The next major resistance is near the $75.50 zone, above which the price may perhaps accelerate higher. In the stated case, it could even visit the $78.00 resistance.
If not, the price might start another decline. The first major support on the downside is near the $72.20 level. The next major support is $70.00. Any more losses might send oil prices toward $66.50 in the coming sessions.
Looking at Gold, the price is still in a bullish zone and might aim for more gains above the $2,520 resistance zone in the near term.
Economic Releases to Watch Today
- US Initial Jobless Claims - Forecast 230K, versus 227K previous.
- Jackson Hole Symposium.
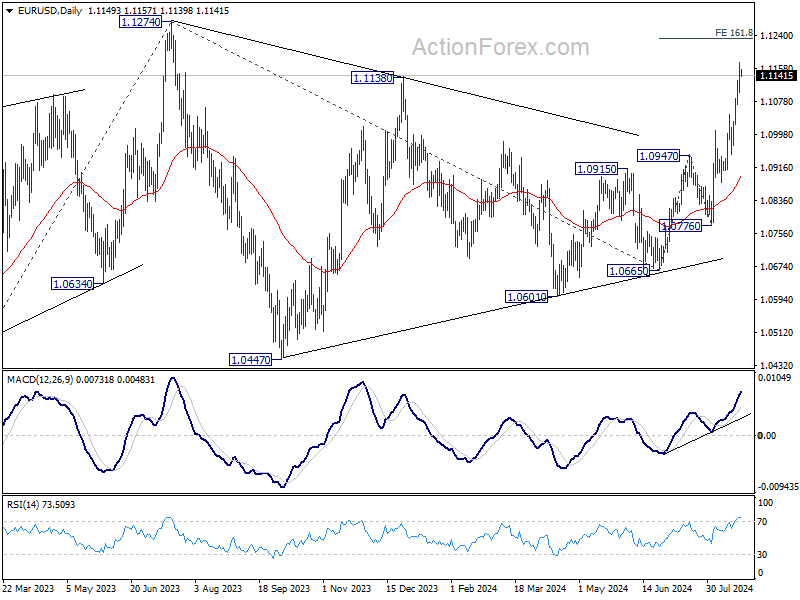
EUR/USD Daily Outlook
Daily Pivots: (S1) 1.1108; (P) 1.1141; (R1) 1.1183; More....
EUR/USD's rally is still in progress and intraday bias stays on the upside. With break of 1.1138 resistance, next target is 161.8% projection of 1.0665 to 1.0947 from 1.0776 at 1.1232. On the downside, below 1.1099 minor support will turn intraday bias neutral and bring consolidations first. But outlook will now remain bullish as long as 1.0948 support holds.
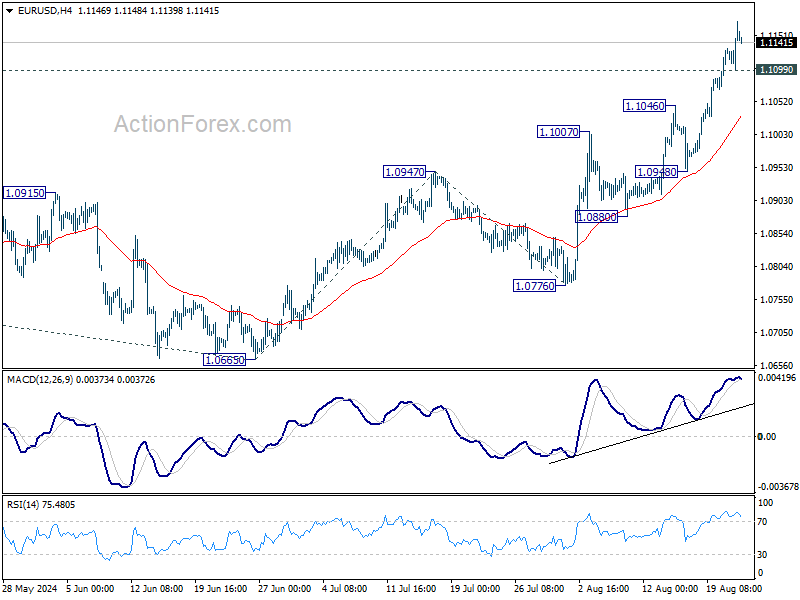
In the bigger picture, price actions from 1.1274 are viewed as a corrective pattern that's could still extend. Break of 1.1138 resistance will be the first signal that rise from 0.9534 (2022 low) is ready to resume through 1.1274 (2023 high). Next target is 61.8% projection of 0.9534 to 1.1274 from 1.0665 at 1.1740. However, break of 1.0974 resistance turned support will extend the correction with another falling leg back towards 1.0447 support.